 Wei Xu1
 Zhenling Liu
- 1College of Civil Engineering, Inner Mongolia University of Science and Technology, Baotou, China
- 2College of Life Sciences, Sun Yat-sen University, Guangzhou, China
With the rapid development of the photovoltaic (PV) industry, the problem of the blind construction of PV power plants is becoming increasingly prominent. Thus, the scientific evaluation of the suitability of regional PV products, power generation potential, and emission reduction benefits is of great significance to the sustainable development of the PV industry. In this study, geographic information sensing and multi-criteria decision making methods are to be combined to calculate a PV development suitability index based on meteorology, topography, location, and vegetation to characterize the spatial patterns of the PV development in the Inner Mongolia Autonomous Region. Subsequently, the power generation potential and emission reduction benefits under different development scenarios were quantitatively assessed. The particularly suitable, and more suitable areas for the PV development in the Inner Mongolia Autonomous Region are 23.66% of the total area. Among these, the more suitable areas are the most extensive. The suitability of PV development in the western part of the Inner Mongolia Autonomous Region is more than that in the central and eastern parts. The suitable areas are mainly distributed in the Alashan League and Bayannur City in the west. Thus, the Inner Mongolia Autonomous Region has enormous potential for electricity generation. The development of 12.57% of the particularly suitable areas can meet the electricity consumption of the Inner Mongolia Autonomous Region in 2021. Moreover, sensitivity analysis is conducted to investigate the impacts of system efficiency variation on energy output. The distribution of the power generation potential and electricity demand in the Inner Mongolia Autonomous Region has robust spatial heterogeneity. PV power generation can achieve remarkable energy saving and emission reduction. If all particularly suitable areas are developed, the annual carbon emission reduction of the Inner Mongolia Autonomous Region will be approximately 2,446,621,000 t, which is 4.46 times the total carbon emission of the Autonomous Region and 21.2% of the total carbon emission of China in 2021. Therefore, this study provides a scientific reference and guide for selecting suitable sites for PV power plants and their sustainable development in the Inner Mongolia Autonomous Region.
1 Introduction
1.1 Importance of PV development suitability evaluation
With the dual challenge of global carbon emission reduction and the energy crisis, establishing an energy system with renewable energy is vital to solving these problems (Ren et al., 2020). Compared to other renewable energy sources, solar energy has the advantages of wide distribution, local availability, absence of transportation, and low environmental impact (Shukla et al., 2022). Photovoltaic (PV) power generation is one of the main methods for using solar energy. The development of PV power plants is essential for global carbon emission reduction and ecological improvement (Guo et al., 2023). The evaluation of the suitability of regional PV development is a prerequisite for the development and use of solar resources, which is essential to ensuring the economic benefits and scientific development of solar PV projects (Höfer et al., 2016).
1.2 Methods for evaluating the suitability of PV development
With the development and popularity of geo-information technology, some researchers have combined geo-information technology with multi-criteria decision making (MCDM) methods to address the siting and generation potential of PV plants (Giamalaki and Tsoutsos, 2019). For example, the combination of geographic information sensing (GIS) with an analysis hierarchical process (AHP) can identify the optimal sites for PV and concentrating solar power plants, and the power generation potential of significant sites was evaluated based on the selected evaluation factors, such as climate, topography, water sources, and road networks, using the Ningxia Hui Autonomous Region of China as an example (Sun et al., 2021). With the combination of fuzzy logic and AHP, the suitability of the PV development in Khuzestan Province, Iran was studied by selecting climatic, topographical, and economic indicators, and using GIS to determine the optimal site for PV power plants (Noorollahi et al., 2022). Using AHP to determine the weights of the suitability evaluation indicators, such as solar radiation and topography, the suitability of the PV development in Kuwait was assessed through GIS, and the PV power generation potential in the particularly suitable areas was evaluated (Rawa et al., 2021). GIS tools were used to analyze the sites for PV development in China with topography and solar radiation as indicators, and the solar potential was calculated based on geographical, technical, and economic aspects (Zhang et al., 2020). There are fewer studies on the analysis of PV generation potential and energy demand. Some scholars have conducted a spatial analysis of generation potential and electricity demand by overlaying night-time lighting data with generation potential. For example, the relationship between electricity demand and PV generation potential in India was analyzed using night-time light data (Tripathy B R, 2018).
1.3 Shortcomings of current methods for evaluating the suitability of PV development
Combining GIS and MCDM methods is a viable method for analyzing the location and generation potential of PV developments (Alami Merrouni et al., 2018a). However, the selection and classification of suitability evaluation indicators in previous studies need to be improved. Existing studies have focused on meteorology, topography (Sun et al., 2013; Elboshy et al., 2022), and location in selecting suitability evaluation indicators, whereas the vegetation, rivers, and distance to protected areas are rarely incorporated as evaluation indicators. In addition, most existing studies have assessed the potential of PV power generation in the study area (Aboelmaaref et al., 2020; Nyimbili and Erden, 2020). However, PV development is influenced by many factors and is subject to a gradual process, and there is a lack of assessment of the potential and emission reduction benefits of PV power generation from the perspective of different development intensities. In terms of the analysis of PV power generation potential and electricity demand, the research is mainly based on the spatial analysis of power generation potential and electricity demand through the superimposition of nighttime lighting data and power generation potential. The night-time light data can reflect the regional electricity demand to a certain extent, but it does not represent the regional electricity demand completely accurately, and the accuracy and reliability of the analysis of PV power generation potential and electricity demand need to be improved.
1.4 Optimisation methods for suitability evaluation of PV development
This study combines the GIS-MCDM method with meteorological, topographical, vegetation, location, vegetation, river, and protected area evaluation indicators to create a PV development suitability evaluation index system, making the suitability evaluation results more accurate (Springer and Thomas, 2013; Hermoso et al., 2023). It is applied in the Inner Mongolia Autonomous Region, China to provide more insights into local solar energy development and assist decision makers with site selection in practice. Secondly, this study assesses the PV power potential at different development ratios and also conducts a sensitivity analysis to explore the impact of efficiency changes on the estimated PV power potential, which is more in line with the scenario of PV development in practice. In addition, based on the government statistics of the whole society’s electricity consumption data, this study makes a comparative analysis of PV power generation potential and electricity demand from the perspective of the whole society’s electricity consumption, which makes the analysis results more accurate and credible and provides strong support for the adjustment of energy structure and reasonable development of PV industry in Inner Mongolia Autonomous Region. The obtained results can facilitate decision making on the strategic planning of solar energy and attract investment in relevant energy infrastructure (Lee et al., 2018; Mitra et al., 2022).
2 Data sources and study area
2.1 Data sources
1) Remote sensing data. The overall horizontal irradiation data were derived from multi-year averages from Global Solar Atlas v2.8 (https://globalsolaratlas.info/), regarding (Sun et al., 2021). The solar radiation data for the Inner Mongolia Autonomous Region were obtained by cropping by mask extraction from the Boundary of Inner Mongolia Autonomous Region Administrative Region and GIS Spatial Analysis Tool. The normalized difference vegetation index (NDVI) data were obtained from the MODISMOD13A1 product released by the National Aeronautics and Space Administration (https://www.nasa.gov/) with a temporal resolution of 16 days and spatial distribution of 500 m. The data used in this study are averages from 2012 to 2022. The land use type data was sourced from Globeland30 (2020 version) (http://www.globallandcover.com/), which is a global land cover database, at a spatial resolution of 30 m. The data was divided into ten land types, such as grassland arable land, and water bodies. Referring to Hassaan et al. (2021) study, the land use type data of the Inner Mongolia Autonomous Region were obtained by cropping the administrative boundaries of the Inner Mongolia Autonomous Region and the mask extraction function of the GIS spatial analysis tool. It was also divided into two categories, restricted and unrestricted areas, and the restricted areas were excluded.
2) Meteorological data. The China Meteorological Data Sharing Service network (http://data.cma.cn/) was used to obtain the daily temperature, precipitation, wind speed, and sunshine hours for 45 meteorological stations in the Inner Mongolia Autonomous Region. The data used in this study are averages from 2012 to 2022. Referring to (David et al., 2000), the temperatures were spatially interpolated using the SPLINA module of the Anusplin software. The parameter SIGNAL is 18.5, which is less than half of the interpolation number of meteorological station points, proving that the interpolation method is feasible. Precipitation, wind speed, and sunshine hours were spatially interpolated in Lee (2022) study using the Kriging method of interpolation analysis in the GIS spatial analysis tool.
3) Basic geographic element data. The data on the roads, settlements, protected areas, rivers, and administrative boundaries were derived from the 1:1 million national primary geographic databases (https://www.webmap.cn/). Referring to (Kocabaldir and Yucel, 2023), the corresponding layers were obtained through Euclidean distance analysis in the GIS spatial analysis tool distance analysis.
4) Topographic data. Digital elevation model data were obtained from the Geospatial Data Cloud Platform (https://www.gscloud.cn/) at a spatial resolution of 90 m. Slope and slope direction data were generated using slope and slope direction analyses for surface analysis in the GIS spatial analysis tool, according to (Grenon and Laflamme, 2011).
5) Socio-economic data. 2021 social electricity consumption by all municipalities in the Inner Mongolia Autonomous Region is from the Inner Mongolia Statistical Yearbook (2022) published by the Statistics Bureau of the Inner Mongolia Autonomous Region (http://tj.nmg.gov.cn/). Data on China’s average coal consumption for electricity supply, total carbon emissions, and unit emission reductions in 2021 are from the China Statistical Yearbook (2022) published by the China Statistical Bureau (http://www.stats.gov.cn/).
All data used in this study have undergone projection transformation, shearing, and resampling (Almasad et al., 2023). The coordinate system is WGS_1984_UTM_zone_50N with a uniform spatial resolution of 500 m × 500 m. All the above various variables with different natures influence the site selection for solar power plant installation simultaneously. To avoid overlap and bias in the assessment results due to uncertainty in the data, standardization was carried out by classifying each type of data into 10 categories using the natural breakpoint method of GIS. The cell values of the input rasters were sorted and reclassified according to a common hierarchical scale (from 1 to 10), and Table 1 shows the grading criteria for PV suitability assessment and their reclassification scores. The natural breakpoint method is a classification method that comes with GIS and mainly uses the idea of clustering to maximize the similarity within each group and the dissimilarity between external groups. The natural breakpoint method will also take into account the range and number of elements between each group as similar as possible, avoiding the subjectivity brought by artificial classification.
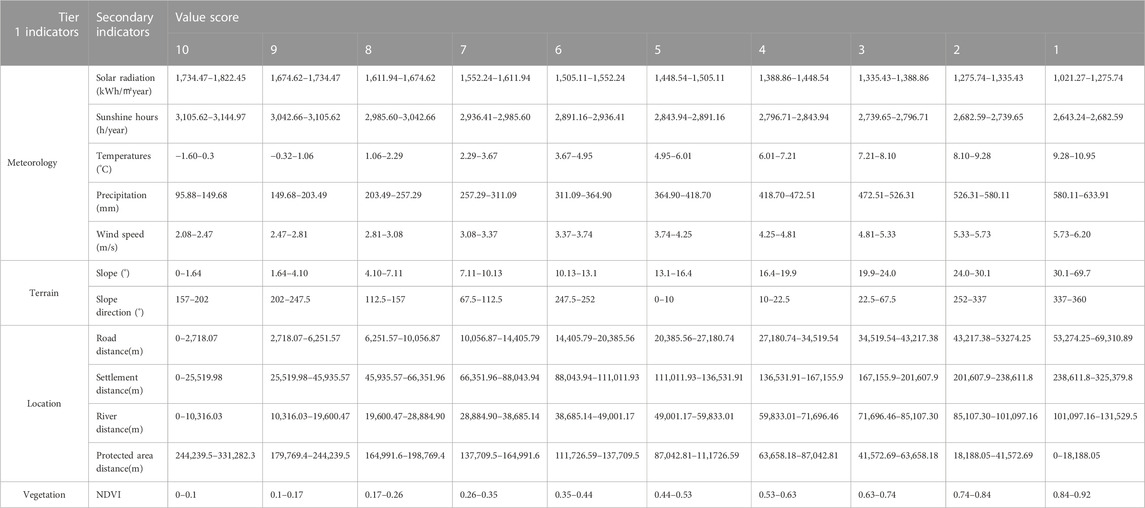
TABLE 1. Evaluation criteria and their reclassification with the corresponding scores.
2.2 Overview of the study area
The Inner Mongolia Autonomous Region is located in northern China with the geographical coordinates of 37°24′to 53°23′north latitude and 97°12′to 126°04′east longitude. It has a total regional area of 118.3 km2 and a population of approximately 24,012,000, including 12 league cities, such as Hohhot, Baotou, and Erdos. It is separated into three regions, namely, western (Baotou, Erdos, Wuhai, Bayannur, and Alashan League), central (Hohhot, Ulanqab, and Xilingol League), and eastern (Chifeng, Tongliao, and Hulunbeier). Its average altitude is 1,800 m above sea level (Figure 1A). There are eight types of land use in the Autonomous Region, including grassland, arable land, and forest (Figure 1B). The Inner Mongolia Autonomous Region has a temperate continental climate with abundant sunshine and low precipitation (Zhao et al., 2022; Wang et al., 2023a).
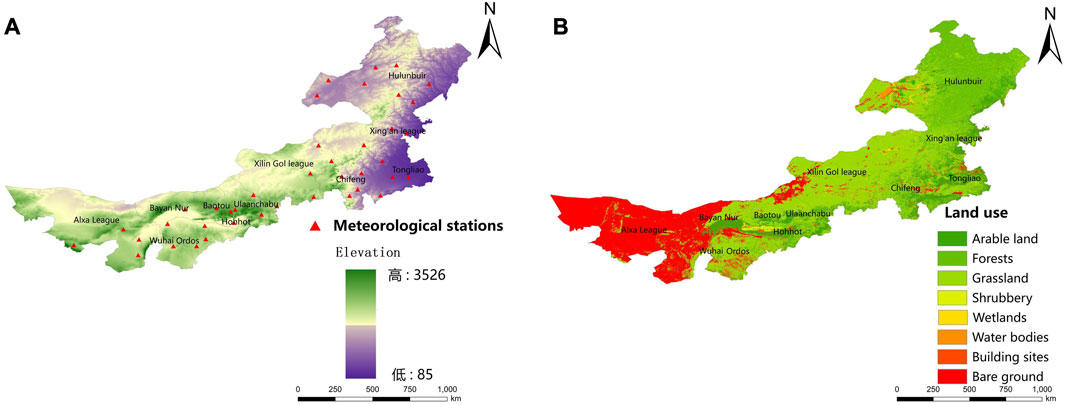
FIGURE 1. Overview of the study area. (A) Distribution of elevations and meteorological stations in the study area, (B) Land use.
2.3 Analysis of the solar resources in the study area
The multiyear solar radiation averages in the Inner Mongolia Autonomous Region range from 1,021.27 to 1,822.445 kWh/m2 (Figure 2A) for all leagues and cities. The amount of solar radiation in the western part of the Inner Mongolia Autonomous Region is higher than that in the eastern part with Alashan League having the largest annual radiation output of approximately 1,820 kWh/m2. The solar energy resources in the Inner Mongolia Autonomous Region are divided following the solar energy resource criteria in the meteorological industry standard of the People’s Republic of China (Solar Energy Resource Assessment Standard for Grid-connected Photovoltaic Power Plants; QX/T89-2008) issued by the China Meteorological Administration (https://www.cma.gov.cn/) (Table 2). The results are shown in Figure 2B. Most of the leagues and cities in the autonomous region are rich in resources with Hulunbeier among the more resource-rich regions and Alashan League as the most resource-rich region. The distribution of days with sunshine hours of >6 h in the Inner Mongolia Autonomous Region is shown in Figure 2C. The highest number of days is distributed in the Alashan League and Chifeng City, and the lowest number of days is distributed in Hulunbeier City. The distribution of solar stability within the Autonomous Region is shown in Figure 2D, in which minimal variations are noted between the leagues and cities; all of which belong to areas with stable solar resources according to the classification criteria of China (Table 3). The ratio between the maximum and minimum number of days with >6 h of sunshine per month was used to assess the stability of solar resources; the lower the ratio, the more stable the solar resources are. With a cumulative installed PV capacity of 15.508 million kW and a new installed capacity of 1.444 million kW in 2022, the Inner Mongolia Autonomous Region is the largest new energy base in China and the first batch of national comprehensive renewable energy demonstration zones (Xu et al., 2020) with a huge potential for PV development.
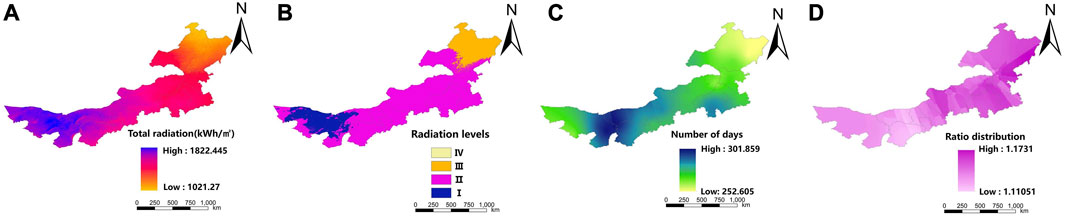
FIGURE 2. Distribution of solar resources in the study area. (A) Spatial distribution of total solar radiation, (B) Distribution of solar resource abundance, (C) Distribution of days with > 6 h of sunshine, (D) Stable distribution of solar resources.

TABLE 2. Classification of solar resource abundance.
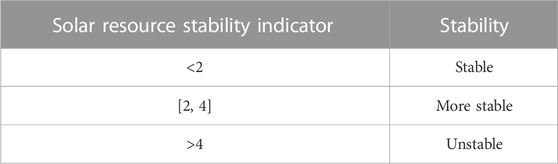
TABLE 3. Classification of solar resource stability.
3 Research process and methodology headings
3.1 Technical lines of research
This study combined GIS with the MCDM method to evaluate the suitability of PV development in the Inner Mongolia Autonomous Region (Ouchani et al., 2021). The flow of this study is shown in Figure 3, and the research process is divided into three steps. Firstly, the basic overview of the Inner Mongolia Autonomous Region and its solar energy resources were analyzed. Restricted areas, such as protected, built-up, and water areas, are unsuitable for the construction of PV plants; thus, they were excluded. By selecting four primary and 12 secondary indicators, the suitability evaluation index system for PV development was constructed. The suitability evaluation was carried out on the areas. Based on the evaluation results, the sites were classified into five categories, namely, unsuitable, less suitable, suitable, more suitable, and particularly suitable, and their spatial distribution characteristics were obtained. Finally, the PV power generation potential and emission reduction benefits in the Inner Mongolia Autonomous Region under different development intensities were estimated considering the power generation efficiency and loss rate of the PV panels.

FIGURE 3. Flow chart of the study.
3.2 Screening of the restricted areas
The sites that are unsuitable for constructing PV plants are restricted areas owing to topographical and legal factors (Dawson and Schlyter, 2012). These sites in the Inner Mongolia Autonomous Region were classified into three categories: protected areas, land cover areas, and water areas.
3.2.1 Protected areas
Protected areas are divided into three main land types: forests, grasslands, and shrublands. Cutting down the trees and foliage in the woodlands and shrublands in the Inner Mongolia Autonomous Region to create solar power facilities is legally prohibited to maintain biodiversity and prevent land degradation (Bórawski et al., 2023). The Inner Mongolia Autonomous Region has a well-developed livestock industry, which occupies an important position in its economic and social development. The grasslands are the basis for the development of livestock farming; thus, it is unsuitable for constructing PV power plants.
3.2.2 Land cover area
The land cover area mainly includes two types of land, construction, and arable lands. Construction land is specifically allocated for urban residents, transport facilities, and industrial and mining. Arable land refers to agricultural land. These land types are not suitable for building PV power plants and are excluded in this work as restricted areas (Ziuku et al., 2014).
3.2.3 Water area
Water areas include two main types of land use: water bodies, which include rivers, lakes, and reservoirs, and wetlands, which are land with shallow water and excessively wet soil in the border zone between land and water. Neither the water bodies nor the wetlands are suitable for constructing PV plants (Shriki et al., 2023).
3.3 Analysis of the selection of evaluation indicators
The suitability evaluation of PV power plants needs to consider the influence of multiple factors (Charabi and Gastli, 2011; Alami Merrouni et al., 2016; Avenel et al., 2018). Meteorology, topography, location, and vegetation were chosen as the primary indicators based on the relevant research literature and characteristics of the development of the Inner Mongolia Autonomous Region (Magalhães et al., 2020; Raza et al., 2023). The four primary indicators were further divided into 12 secondary indicators to establish a suitability evaluation index system to assess the suitability of the PV development in the Inner Mongolia Autonomous Region.
The meteorological indicators include five secondary indicators, namely, solar radiation, sunshine hours, temperature, precipitation, and wind speed. The amount of solar radiation is the most critical indicator for the suitability assessment because it directly affects the amount of electricity generated by PV panels. The number of sunshine hours affects the stability of the PV power generation (Schmitter et al., 2018). Temperature and precipitation affect the stability of solar resources and consequently, the efficiency of the PV power generation. Wind speed mainly affects the safety of the PV panels. Excessively high wind speed can damage the PV panels, and increase the operation and maintenance costs (Md Khairi et al., 2022).
The terrain indicators include two secondary indicators: slope and aspect. The pitch and direction of the slope affect the solar radiation intensity and sunshine hours. As the Inner Mongolia Autonomous Region is located in the northern hemisphere, the solar radiation in the southern direction and plane is higher. As the slope increases, the difficulty and cost of constructing PV power plants increase.
The location indicators include the road network, settlement, river, and protected area distances. The proximity to the road network reduces the cost of the initial construction, transport, operation, and maintenance (Dzikuć et al., 2022). In particular, proximity to the population, which is the electricity consumer market, reduces transport costs and electricity losses through the grid. As the Inner Mongolia Autonomous Region has dusty weather in spring, proximity to rivers allows easy cleaning of the dust and sand on PV panels.
As an important ecological barrier in northern China and a tourist destination in the north, the Inner Mongolia Autonomous Region has 216 nature reserves, which should be avoided during the construction of PV power plants (Broisch et al., 2014). NDVI is a secondary indicator of vegetation cover. NDVI ranges between [−1, 1], and its magnitude represents the vegetation cover of the area, with NDVI ≤0 representing no vegetation cover and NDVI of 1 indicating high vegetation cover. PV plants should be built in areas with low vegetation cover to protect the ecological diversity of the Inner Mongolia Autonomous Region (Maraj et al., 2022).
3.4 Research methodology
3.4.1 MCDM method and AHP for determining indicator weights
This study used AHP, which is a standard method used in MCDM, to determine the weights of the evaluation indicators (Alami Merrouni et al., 2018). MCDM methods can be divided into multi-objective decision making (MODM) and multi-attribute decision making (MADM). MADM addresses a discrete domain of alternatives, whereas MODM addresses the continuous occupation of other options. AHP is a MADM method developed by Saaty (Al Garni and Awasthi, 2017).
The AHP divides the problem into several levels, which are further divided into several indicators (Tennakoon et al., 2023). The importance of an indicator is compared two by two using a nine-level scale to evaluate the weight of each indicator. Where 1 means equal importance and 9 extremely higher importance of one criterion compared to another. Generate a two-by-two comparison matrix based on the expert’s judgment. If there are n indicators at a level, a judgment matrix P. is constructed, as follows:
where
The matrix P was normalized by adding the values of each column of matrix P and then dividing each item by the sum of its column. Finally, the normalized matrix was averaged over the rows to obtain the relative weights. Solving for the maximum eigenvalue and eigenvector of a matrix by the eigenvalue method (Ali et al., 2023), the maximum eigenvalue λmax = 12.0155 was determined. To ensure the consistency of expert judgments, the following formula is required to test the consistency of the judgment matrix:
where:
Where CR is the consistency ratio (if CR < 0.1, the consistency test is passed; otherwise, the judgment matrix has to be revised); RI is the random consistency index (Table 4); and λmax is the maximum eigenvalue.

TABLE 4. Random consistency indicators.
In this study, by consulting five experts in the field of solar energy, each expert compared the importance of the 12 secondary evaluation indicators two by two by reviewing the literature, constructed a 12-order judgment matrix, determined the importance of each secondary indicator, and finally obtained the final weights of each indicator by calculation (Table 5). The CR index values of the judgment matrix of the five experts were 0.00091, 0.00089, 0.00096, 0.00072, and 0.00069, and the results are less than 0.1, indicating that the results are acceptable. As can be seen, the meteorological indicators have the greatest weight, as radiation is the most important factor influencing the potential of PV power generation, which is a decisive factor in the siting of PV plants. Location is the second most important indicator, indicating a preference for building PV plants close to road networks and electricity consumption markets to reduce construction and electricity transportation costs later on.
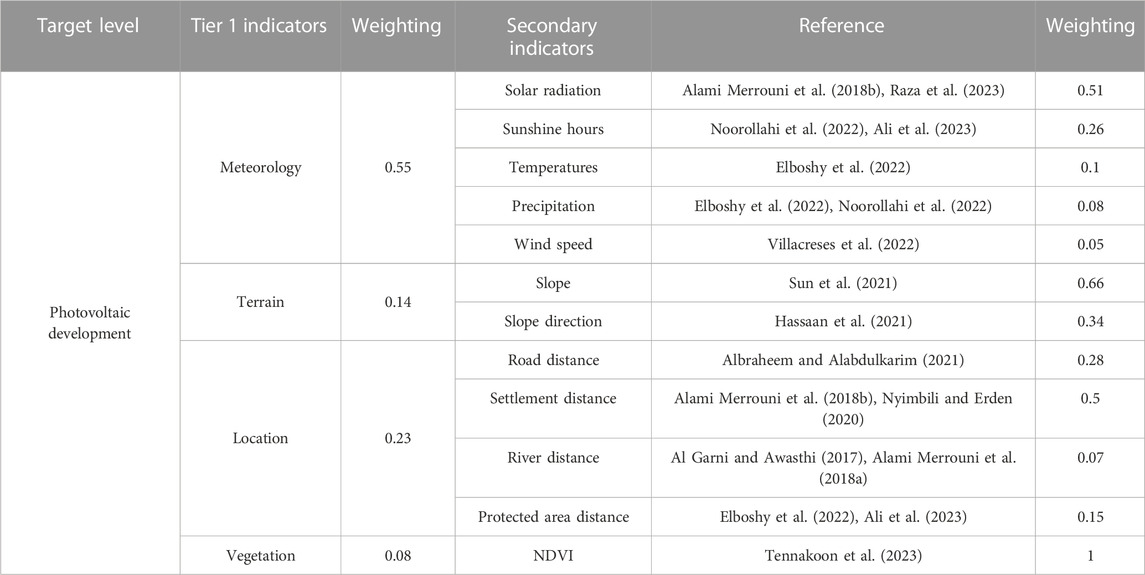
TABLE 5. PV development suitability evaluation indicators and weights.
3.4.2 PV development suitability calculations
The suitability evaluation indicators are divided into ten levels according to the equal interval distance method. The larger the value of the enormous indicators, including the solar radiation, sunshine hours, and distance to protected areas, the higher the level is; the opposite is true for the small indicators, including the slope, precipitation, temperature, wind speed, and distance to settlements, rivers, and roads. The slope direction is an interval indicator with the highest grading in the south and plane directions and the lowest grading in the north. The suitability index was calculated using the weights of the primary and secondary indicators. The level of the graded secondary indicators was obtained as follows:
where Si is the PV development suitability index, Wr is the weight of the r-th level indicator (r = 1, 2, 3, 4), Wrl is the weight of the l-th secondary indicator under the r-th primary indicator (l = 1, 2, 3, … , s); s is the number of secondary indicators under the r-th level indicator; Crl is the number of levels of the l-th post-grading level 2 indicator under the r-th level 1 indicator.
3.4.3 PV power potential assessment
The assessment of the PV power generation potential is essential to the feasibility study of PV power plant projects. Solar energy must be transformed into the total energy output to determine the PV power generation capacity. The type of PV panel is the main factor of the overall energy output efficiency (Chen et al., 2023). Various types of solar panels are available in the market, including monocrystalline silicon, polycrystalline silicon, and amorphous silicon as the main varieties. In this study, the polycrystalline silicon PV panels, which are the most widely used, were considered in calculating the potential for PV power generation with an energy conversion efficiency of 16.5% (Wang et al., 2022). In recent years, a high degree of PV development in the Inner Mongolia Autonomous Region has resulted in a certain amount of light abandonment, and to improve the accuracy of the PV power generation potential assessment, the influence of the light abandonment rate on the PV power generation potential is considered. The influencing factors of total annual solar radiation per unit area, area suitable for PV power plants, area coefficient of receiving solar radiation, and power generation loss rate coefficient also affect PV power generation potential (Narvaez et al., 2022). Considering all these influencing factors, the PV power generation potential is calculated as follows:
where SEGP is the PV power generation potential, kWh; SA is the area suitable for the construction of PV power plants, m2; AF is the area coefficient of receiving solar radiation, which is equal to 0.35 in this study according to the actual research of PV power station in Dalat Banner, Ordos City; ASR is the total annual solar radiation per unit area, kWh/m2; PE is the power generation efficiency of PV panels; LO is the power generation loss rate, which is equal to 7.5% in this study regarding Li et al.; and AP is the light abandonment rate. The specific parameter values and setting criteria are shown in Table 6.
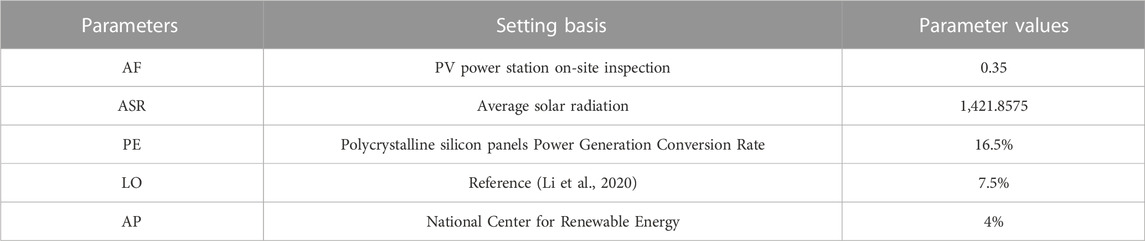
TABLE 6. Parameter settings for the PV power potential assessment.
It is worth noticing that the materials and technologies also affect the efficiency of solar power generation. Currently, the conversion efficiency of polycrystalline silicon cells is in the range of 16%–22.8% (Yang and Wang, 2022). Considering future improvements in PV technology and referring to (Noorollahi et al., 2022). This study analyses the sensitivity of the power generation potential for four scenarios with power generation efficiencies of 16.5%, 18%, 21%, and 24% respectively.
4 Results and discussion
4.1 Grading and distribution pattern of the evaluation indicators
The Inner Mongolia Autonomous Region has a high solar radiation grade (Figure 4A), with the western grade higher than the eastern grade. The areas with the highest grades are in the western portion, including the Alashan League and Bayannur City, and the areas with the lower grades are primarily in the east at the Hulunbeier City. For the sunshine hour, the areas with higher grades (Figure 4B) are primarily in Alashan and Chifeng, and the areas with lower grades are mainly in Hulunbeier. For the temperature, the areas with lower grades (Figure 4C) are primarily concentrated in the southern parts of the Alashan League, Wuhai City, and Ordos City, and the areas with higher grades are mainly focused on the northern part of Hulunbeier City. The precipitation grading (Figure 4D) increases from the eastern to the western part of the Inner Mongolia Autonomous Region, with the highest grading in the Alashan League and the lowest in Hulunbeier City. The most inadequate grading for the road distance (Figure 4E), river distance (Figure 4F), and residential distance (Figure 4G) are in a small part of the Alashan League, with the rest of the region having higher grades. The higher distance grade of the protected areas (Figure 4H) is minimal, and mainly in the northern areas of the central and western parts of the Inner Mongolia Autonomous Region, with the rest of the area generally having a lower grade. The areas with higher wind speed classification (Figure 4I) are mainly located in the northeastern part of Baotou, Ordos, Hohhot, and Hulunbeier, whereas those with the lower category are primarily in the western part of the Alashan League. The areas with the lower slope grading (Figure 4J) are mainly located in the west of Hulunbeier City, Tongliao City, Xing’an League, Baotou City, and some areas in Erdos City. Other regions have high grades with minimal variations.
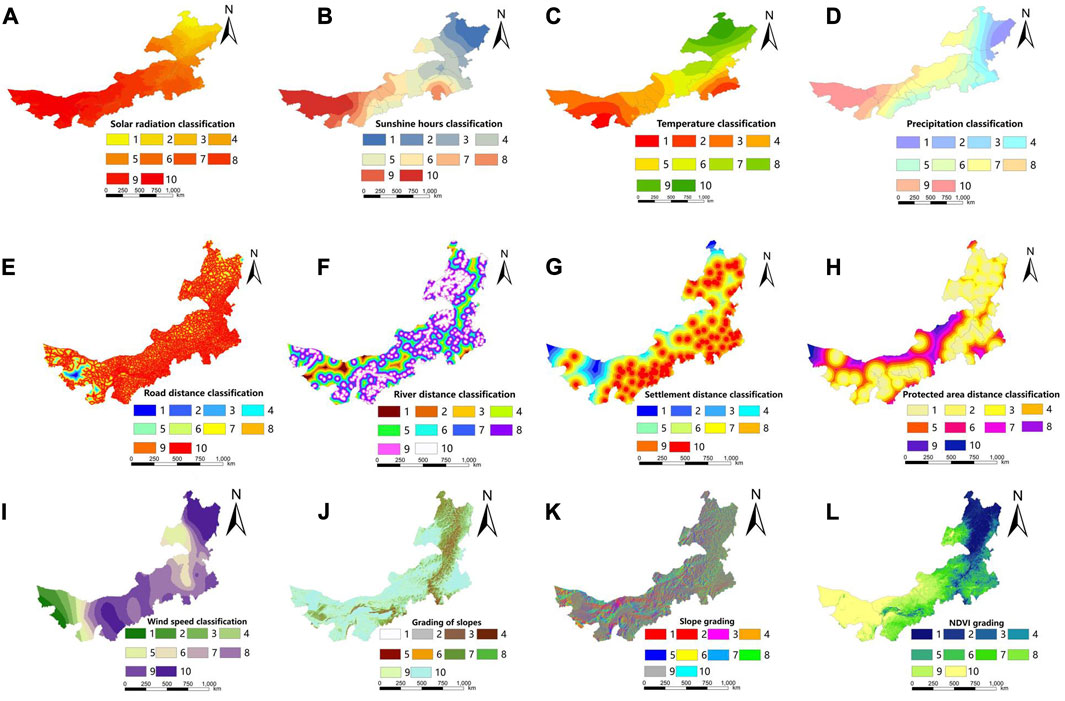
FIGURE 4. Classification of the secondary indicators for the PV development suitability assessment. (A) Solar radiation classification, (B) Sunshine hours classification, (C) Temperature classification, (D) Precipitation classification, (E) Road distance classification, (F) River distance classification, (G) Settlement distance classification, (H) Protected area distance classification, (I) Wind speed classification, (J) Garding of slopes, (K) Slop grading, (L) NDVI grading.
The slope grades (Figure 4K) are higher in the southern and planar directions, and lower in the northern border. The NDVI classification (Figure 4L) exhibits a decreasing trend from the west to the east of the Inner Mongolia Autonomous Region with the highest classification in the Alashan League and the lowest in Hulunbeier City. Overall, the spatial distribution characteristics of the suitability evaluation secondary indicators vary significantly.
4.2 PV development suitability analysis
After excluding the restricted areas, the areas assessed for suitability for PV development account for 24.24% of the total Inner Mongolia Autonomous Region area. The PV development suitability index ranges between [5.223, 9.213] and is divided into five categories according to the primary method (Figure 5) unsuitable [5.223, 6.021), less suitable [6.021, 6.819), suitable [6.819, 7.517), more suitable [7.517, 8.415), and particularly suitable [8.415, 9.213). The particularly suitable, suitable, and less suitable and unsuitable areas are 50,184.54, 186,009.32, 43,705.94, and 6,804.92 km2 (Table 7), which account for17.50%, 64.88%, 15.24%, and 2.38% of the total assessment area, respectively. The particularly suitable areas are distributed in Alashan League, Bayannur City, and Chifeng City, with Alashan League accounting for the highest percentage of 78.59%, followed by Bayannur City. The more suitable cities for the regional distribution are Alashan League, Bayannur, Baotou, Erdos, Wuhai, Ulanqab, and Xilin Gol League, with Alashan League accounting for the highest percentage 83.48%. The most extensive distribution of the suitable areas is found in all 11 cities, except Xing’an Meng, with Alashan Meng still accounting for the highest proportion of 64.03%, followed by Ordos. The less suitable and unsuitable areas are lower than the above three types. The largest less suitable area is in Hulunbeier, and the largest unsuitable area is in Xing’an Meng.
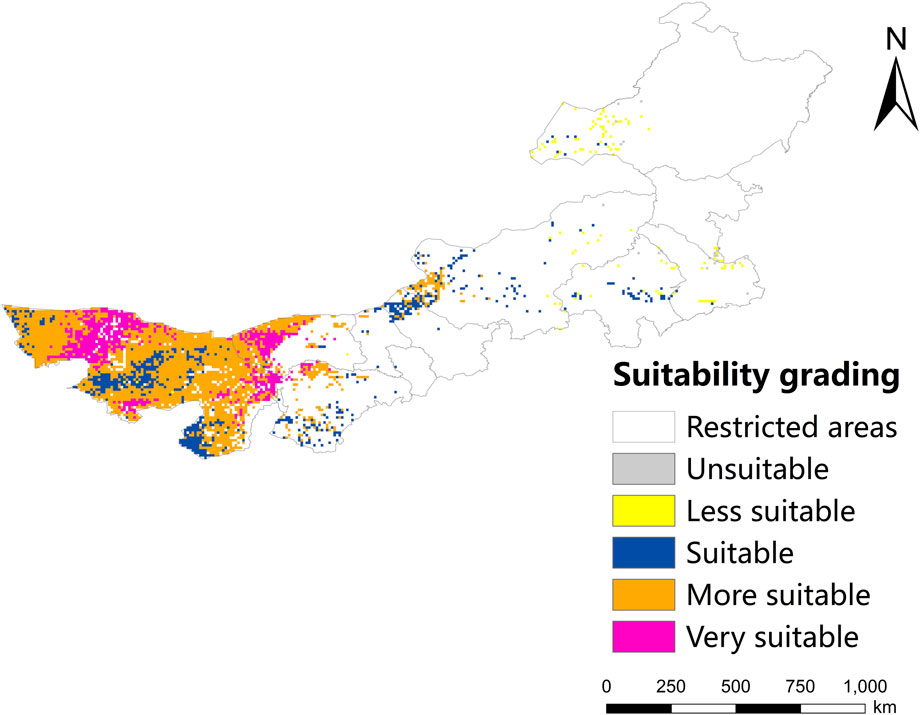
FIGURE 5. Suitability of the PV development in the Inner Mongolia Autonomous Region.
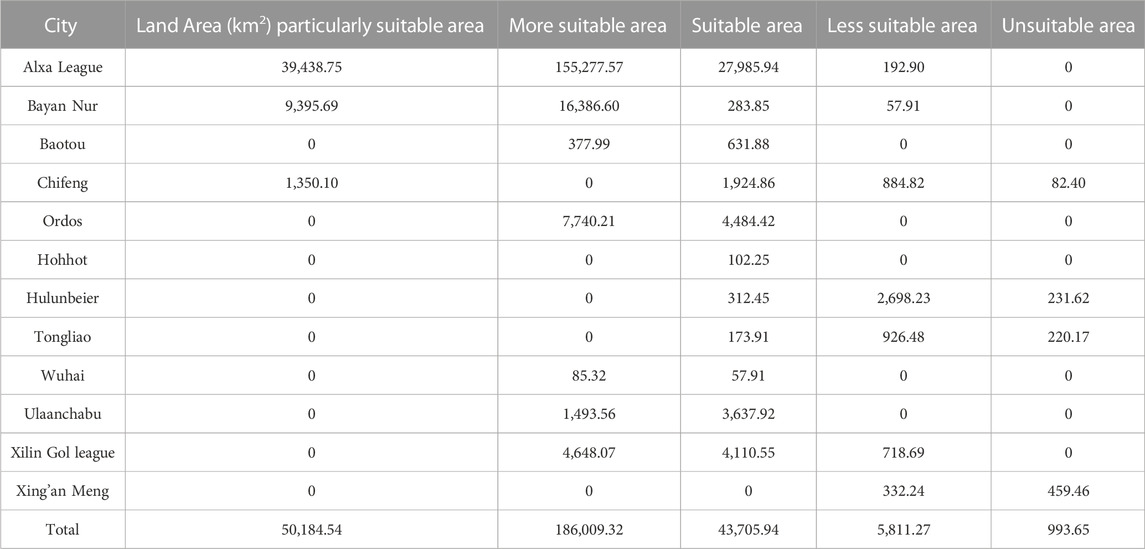
TABLE 7. Land area of different suitability in the Inner Mongolia Autonomous Region.
The Inner Mongolia Autonomous Region has a spatial pattern that favors PV development with more significant potential in the western than that of the central and eastern portions. The particularly suitable, more suitable, and suitable areas are primarily found in Alashan Meng and Bayannur City in the west, and Baotou City, Erdos City, and Chifeng City in the east. With the flat terrain, small slopes, solar radiation of more than 1,600 kWh/m2, average annual sunshine hours of more than 2,950 h, good meteorological conditions, such as precipitation and wind speed, low vegetation cover, and moderate distances from roads, settlements, and rivers, these areas have natural advantages for PV development, which dramatically improves the efficiency of the PV power generation and reduces the cost of transporting during the construction of PV power plants and electricity generation. The less suitable and unsuitable areas are primarily located in Hulunbeier City and Xing’an League City, These areas have low total annual radiation and average annual sunshine hours; poor precipitation, wind speed, and other meteorological conditions; low efficiency for PV power generation; large slope, which makes the construction of PV power plants difficult and costly; high vegetation coverage, and difficult and expensive structures (Ariztia and Raglianti, 2020; Xin-gang et al., 2021).
4.3 Analysis of the PV power potential and electricity demand
The assessment of the power generation potential of the Inner Mongolia Autonomous Region has revealed its significant potential for power generation. If all the particularly suitable, more suitable, and suitable areas are developed, the annual power generation capacity can reach 2. 0,409,113 kWh or 44.37 times the amount of electricity used by the Inner Mongolia Autonomous Region in 2021. According to Table 8, the annual power generation potential of the particularly suitable, more suitable, and suitable areas are 36,592.41, 135,630.00, and 31,868.50 TWh, respectively. Of which, 12.57% of the development in the particularly suitable area can satisfy the electricity demand of the Inner Mongolia Autonomous Region in 2021.
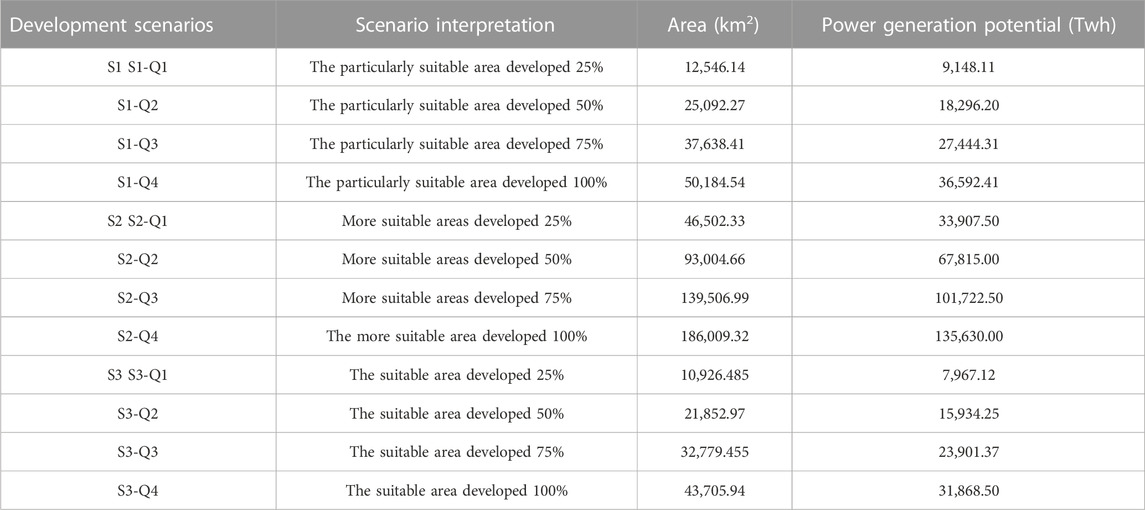
TABLE 8. Generation potential of PV in Inner Mongolia Autonomous Region under different development scenarios.
The impact on PV power generation potential at different power generation efficiencies is shown in Figure 6. When the efficiency of the PV system increases to 18%, 21%, and 24%, the PV generation potential will increase by 9.09%, 27.27%, and 45.45% respectively, with a PV system generation potential of 222,644.6 TWh/year, 259,752.04 TWh/year and 296,856.46 TWh/year respectively.
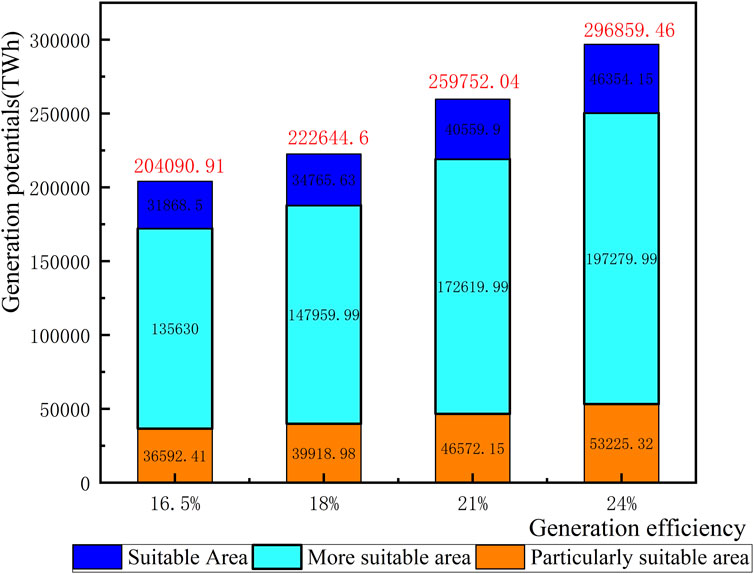
FIGURE 6. Sensitivity analysis of generation potential at different generation efficiencies.
The study determined the substantial spatial heterogeneity in the distribution of the power generation potential and electricity demand in the Inner Mongolia Autonomous Region. The western part of the Inner Mongolia Autonomous Region has more significant power generation potential than the central and eastern parts, with the western, central, and eastern parts accounting for 93.66%, 5.18%, and 1.16% of the power generation potential (Figure 7A), respectively. Of the 12 municipalities in the Inner Mongolia Autonomous Region, Alashan League, and Bayannur accounted for 97.31% of the power generation potential in the particularly suitable Zone (Figure 8A), 92.29% in the more suitable zone (Figure 8B), and 88.88% in the Inner Mongolia Autonomous Region (Figure 7A). In contrast, Alashan League and Bayannur City only account for 5.18% of the electricity consumption in the Inner Mongolia Autonomous Region in 2021 (Figure 7B. Figure 7 shows three types of power generation potential and electricity demand in the Inner Mongolia Autonomous Region: high power generation and low electricity demand; low power generation potential and high electricity demand; and balanced power generation potential and electricity demand. Among them, Hohhot, Baotou, Erdos, Tongliao, Chifeng, and Ulaanchabu have low generation potential and high electricity demand, whereas Wuhai, Hulunbeier, Xing’an, Xilingol, Alashan, and Bayannur are of the balanced generation potential and electricity demand type. Overall, more apparent changes are noted in the electricity consumption of the Inner Mongolia Autonomous Region. The Hubao-E urban agglomeration has a developed economy with a high concentration of industrial plants and consequently, strong electricity demand. However, its potential for PV power generation is insufficient. A large portion of its electricity originates from coal-fired thermal power plants, and carbon emission reduction and environmental problems are prominent.
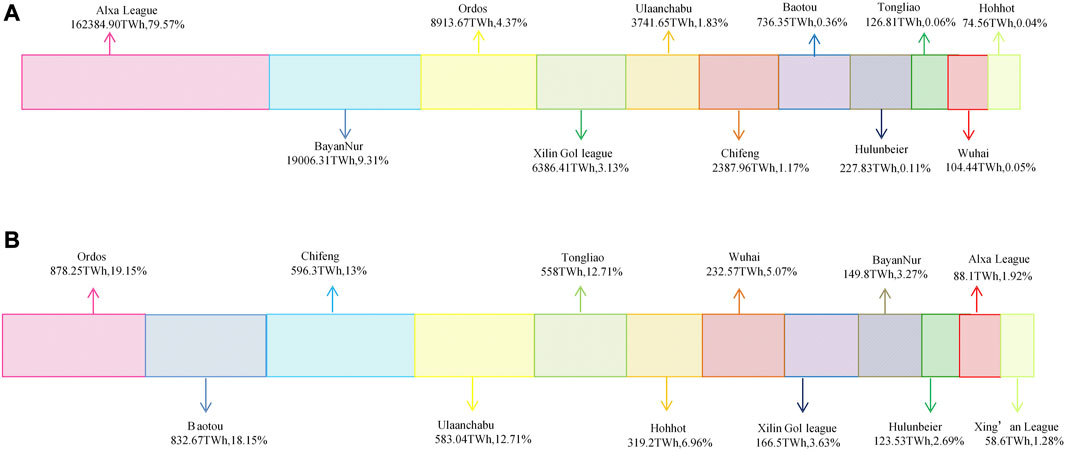
FIGURE 7. PV power generation potential (A) and 2021 electricity demand by the municipality in Inner Mongolia Autonomous Region (B).
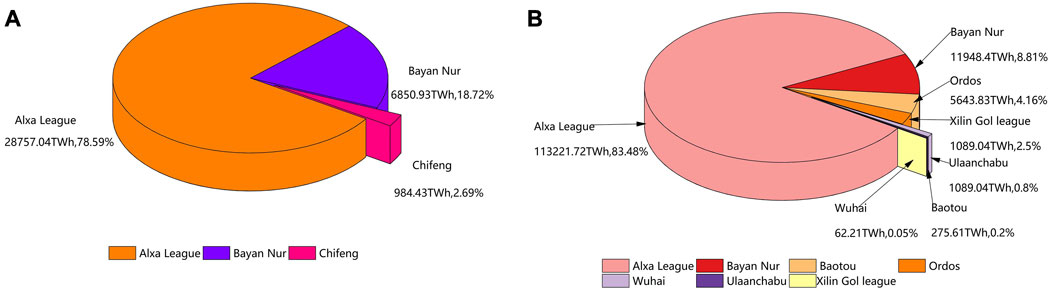
FIGURE 8. Photovoltaic power potential by the municipality in the Especially Suitable (A) and More Suitable Zones (B).
4.4 Emission reduction effects under different development intensities
The Inner Mongolia Autonomous Region has long relied on its resources to develop its economy. The secondary sector accounts for a large proportion of the total carbon emissions, which have been increasing annually. PV development is affected by national policies, electricity demand, and other factors. It is not a quick fix but a gradual process to achieve large-scale PV development in a relatively short period. Therefore, in this study, considering the gradual increase in the proportion of PV power generation in the future energy mix, 12 development scenarios were set to analyze the emission reduction effect according to the ratio of the particularly suitable, more suitable, and suitable areas for development (Table 9). In 2021, China’s average coal consumption for power supply will be 302.5 g/kWh. Burning 1 tonne of standard coal will emit 2,662 kg of carbon dioxide (CO2), 22 kg of sulfur dioxide (SO2), 10 kg of nitrogen oxides (NOx), and 17 kg of total suspended particulate matter (TSP). If all the particularly suitable areas are developed, the annual carbon emission reduction in the Inner Mongolia Autonomous Region would be approximately 2,446,621,000 t, which is 4.46 times the total carbon emission of the Autonomous Region and 21.2% of China’s total carbon emission in 2021. In addition, 110,692,400 t standard coal can be saved, and the emission of approximately 24,352,200 t SO2, 11,069,200 t NOx, and 18,817,600 t TSP would be prevented. If all the particularly suitable, more suitable, and suitable areas in the Inner Mongolia Autonomous Region are developed, the region would save 617,375,000 t standard coal, reduce carbon emissions by approximately 1,643,452,600 t, which is 1.18 times the total carbon emissions of China in 2021, and reduce the SO2, NOx, and TSP emissions by approximately 135,822,500, 61,737,500, and 104,953,700 t, respectively. Thus, the PV development in the Inner Mongolia Autonomous Region is crucial to reducing the carbon emissions in the autonomous region (Ji et al., 2022; Wang et al., 2023), thereby transforming the energy structure, and achieving China’s dual carbon targets (Gobio-Thomas et al., 2023).
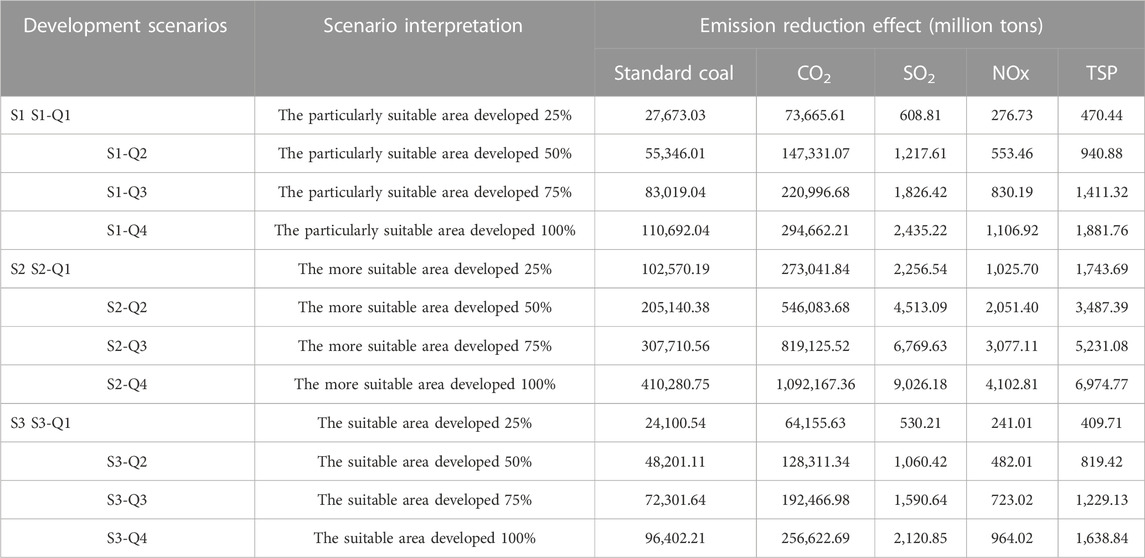
TABLE 9. Emission reductions under different PV development scenarios.
4.5 Discussion
Inner Mongolia Autonomous Region has huge potential for PV power generation, with significant energy saving and emission reduction effects. However, in the process of practical application, the opportunities and challenges of PV development coexist. Firstly, the Inner Mongolia Autonomous Region is an ethnic minority region in China, with a small population and a large potential for PV power generation, which is prone to the problem of power consumption. The main reason for the power consumption problem is that the western part of the Inner Mongolia Autonomous Region, which is particularly suitable for PV development, has weak energy storage facilities power grids, and ancillary facilities, making it difficult to transmit power. Secondly, the conversion of PV power into hydrogen energy requires the consumption of a large number of water resources, and the western part of the Inner Mongolia Autonomous Region is a semi-arid and arid region with scarce water resources. But the Inner Mongolia Autonomous Region “14th Five-Year Plan” power development regulations, pointed out that to increase investment in the power grid in the western part of the Inner Mongolia Autonomous Region, to promote the western part of the Inner Mongolia Autonomous Region and Beijing-Tianjin-Hebei and Shandong asynchronous interconnection, the implementation of the plan is expected to solve the western part of the Inner Mongolia Autonomous Region of the problem of power consumption and to promote the economic and social development of the local economy. At the same time, it will help alleviate the problem of power tension in Beijing-Tianjin-Hebei and Shandong, improve its energy structure, reduce carbon emissions, and help China realize its dual-carbon goals (Xie et al., 2023). In addition, the western part of the Inner Mongolia Autonomous Region is full of deserts, and the soft geology and lack of water in the desert areas bring considerable challenges to the construction of PV power plants and the cleaning of dust and sand on the surface. With the improvement of China’s PV manufacturing, construction and operation, and maintenance capabilities in recent years, it is possible to build PV power plants in complex desert environments, such as the “Dalat PV Pilot Base,” which is the world’s largest centralized PV power plant in the desert. In addition, the construction of photovoltaic power plants in the desert, and later power transmission costs will lead to an increase, but the construction of photovoltaic power plants in the desert also has many benefits. On the one hand, the land cost is relatively small and the solar radiation is relatively stable and abundant. On the other hand, the National Energy Administration and the autonomous region strongly support the construction of desert photovoltaic bases in the western part of the Inner Mongolia Autonomous Region, and the development of desert photovoltaic is also beneficial to the improvement of the desert ecological environment.
It has been shown that large-scale construction of power plants will have a certain impact on the local ecological environment during the construction period, but in the long term, it will be beneficial to plant growth, increase species diversity, and improve the ecological environment (Wu et al., 2018). Because the PV power plant in the later stage of operation and maintenance of less human disturbance factors, and photovoltaic facilities in the shade can prevent plants from being subjected to strong solar radiation, cleaning photovoltaic panels water can also provide plants with the necessary water for growth (Ali et al., 2017). The construction of photovoltaic power plants in desert areas can also play a certain role in preventing sandstorms, as the fragile ecological environment has been improved to some extent (Hengevoss et al., 2016).
In summary, although the development of photovoltaics in Inner Mongolia has many constraints, photovoltaic power generation in the Inner Mongolia Autonomous Region and even China’s energy structure and energy saving and emission reduction play an increasingly important role, accompanied by the upgrading of the photovoltaic manufacturing industry, the improvement of the grid infrastructure, the level of construction, operation, and maintenance of the level of enhancement of the development of energy storage technology, photovoltaic development of the difficult problems will be gradually overcome, to help the development of large-scale photovoltaic in the Inner Mongolia Autonomous Region.
The layout of PV development in the “14th Five-Year Plan for Electricity Development in Inner Mongolia Autonomous Region” issued by the Energy Bureau of Inner Mongolia Autonomous Region and the distribution of existing PV power plants in Inner Mongolia Autonomous Region verified the reliability of the results of our suitability assessment. However, it is important to note that in practice, the results should be interpreted with caution in terms of hypotheses, data quality, decision-maker preferences, and applied procedures. More precise information and analysis are required for practical deployment. Eration penetration should also be carefully addressed and analyzed. The decision makers’ preferences in determining restrictive criteria, assessment criteria, and their weights have a significant impact on the results. As a result, weight sensitivity analysis or other uncertain analysis technologies associated with the MCDM technique must be done and investigated further to assess the robustness of the conclusions. Other considerations, such as the cost of land and the attitude of the population, may also influence the location of PV plants. Therefore, the suitability evaluation index system should be further expanded in future studies to achieve more scientific evaluation results.
5 Conclusion
This study combined GIS and MCDM methods to select multidimensional indicators, such as meteorology, topography, location, and vegetation and used AHP to determine their weights to investigate the spatial pattern characteristics, PV power generation potential, energy saving, and emission reduction of the PV development in the Inner Mongolia Autonomous Region. The following main conclusions were obtained:
1) The particularly suitable, more suitable, and suitable areas for PV development in the Inner Mongolia Autonomous Region account for 23.66% of the total area, with the more suitable areas as the most extensive. The suitability of PV development is characterized by an obvious spatial pattern, with the suitability in the western region being higher than that in the central and eastern regions.
2) The potential for photovoltaic power generation in the Inner Mongolia Autonomous Region is huge, with 12.57% development in particularly suitable areas to meet the electricity consumption of the Inner Mongolia Autonomous Region in 2021. With the future technology advance, the generation potentials could increase by 9.09%, 27.27%, and 45.45%, if the system efficiencies improved to 18%, 21%, and 24%.
3) There is a strong spatial heterogeneity in the distribution of power generation potential and electricity demand in each municipality of the Inner Mongolia Autonomous Region, with significant spatial pattern characteristics. From an overall perspective, the power generation potential in the western part of the Inner Mongolia Autonomous Region is greater than that in the central and eastern parts, and there is a strong demand for electricity in the Hubao-E urban agglomeration.
4) PV power generation significantly impacts energy savings and pollution reduction in the Inner Mongolia Autonomous Region. If the particularly suitable area is fully developed, the Inner Mongolia Autonomous Region will have an annual carbon emission reduction of approximately 294,662,210 t, which is 4.46 times its total carbon emissions and 21.2% of China’s total carbon emissions in 2021. Therefore, this work demonstrated the considerable energy-saving and emission-reduction effects of PV development.
Data availability statement
The original contributions presented in the study are included in the article/Supplementary Material, further inquiries can be directed to the corresponding author.
Author contributions
WX was involved in the data curation and editing of the manuscript; ZL was involved in the data analysis, and manuscript writing; SL was involved in the conceptualization and editing of the manuscript. All authors contributed to the article and approved the submitted version.
Funding
The work described in this paper was financially supported by the National Social Science Foundation of China (No. 22XJY001) and the Philosophy and Social Science Foundation of Inner Mongolia (No. 2022NDC220).
Acknowledgments
Thanks to the China Meteorological Administration and the Inner Mongolia Autonomous Region Bureau of Statistics for their data support.
Conflict of interest
The authors declare that the research was conducted in the absence of any commercial or financial relationships that could be construed as a potential conflict of interest.
Publisher’s note
All claims expressed in this article are solely those of the authors and do not necessarily represent those of their affiliated organizations, or those of the publisher, the editors and the reviewers. Any product that may be evaluated in this article, or claim that may be made by its manufacturer, is not guaranteed or endorsed by the publisher.
References
Aboelmaaref, M. M., Zayed, M. E., Zhao, J., Li, W., Askalany, A. A., Salem Ahmed, M., et al. (2020). Hybrid solar desalination systems driven by parabolic trough and parabolic dish csp technologies: technology categorization, thermodynamic performance and economical assessment. Energy Convers. Manag. 220, 113103. doi:10.1016/j.enconman.2020.113103
Al Garni, H. Z., and Awasthi, A. (2017). Solar pv power plant site selection using a gis-ahp based approach with application in Saudi Arabia. Appl. Energy 206, 1225–1240. doi:10.1016/j.apenergy.2017.10.024
Alami Merrouni, A., Elwali Elalaoui, F., Ghennioui, A., Mezrhab, A., and Mezrhab, A. (2018). A gis-ahp combination for the sites assessment of large-scale csp plants with dry and wet cooling systems. Case study: eastern Morocco. Sol. Energy 166, 2–12. doi:10.1016/j.solener.2018.03.038
Alami Merrouni, A., Mezrhab, A., and Mezrhab, A. (2016). Pv sites suitability analysis in the eastern region of Morocco. Sustain Energy Technol. Assess. 18, 6–15. doi:10.1016/j.seta.2016.09.006
Albraheem, L., and Alabdulkarim, L. (2021). Geospatial analysis of solar energy in riyadh using a gis-ahp-based technique. Isprs Int. J. Geoinf 10, 291. doi:10.3390/ijgi10050291
Ali, A. H. H., Zeid, H. A. S., and AlFadhli, H. M. G. (2017). Energy performance, environmental impact, and cost assessments of a photovoltaic plant under Kuwait climate condition. Sustain Energy Technol. Assess. 22, 25–33. doi:10.1016/j.seta.2017.05.008
Ali, S., Stewart, R. A., Sahin, O., and Vieira, A. S. (2023). Integrated gis-ahp-based approach for off-river pumped hydro energy storage site selection. Appl. Energy 337, 120914. doi:10.1016/j.apenergy.2023.120914
Almasad, A., Pavlak, G., Alquthami, T., and Kumara, S. (2023). Site suitability analysis for implementing solar pv power plants using gis and fuzzy mcdm based approach. Sol. Energy 249, 642–650. doi:10.1016/j.solener.2022.11.046
Ariztia, T., and Raglianti, F. (2020). The material politics of solar energy: exploring diverse energy ecologies and publics in the design, installation, and use of off-grid photovoltaics in Chile. Energy Res. Soc. Sci. 69, 101540. doi:10.1016/j.erss.2020.101540
Avenel, C., Raccurt, O., Gardette, J., and Therias, S. (2018). Review of accelerated ageing test modelling and its application to solar mirrors. Sol. Energy Mater Sol. Cells 186, 29–41. doi:10.1016/j.solmat.2018.06.024
Bórawski, P., Holden, L., and Bełdycka-Bórawska, A. (2023). Perspectives of photovoltaic energy market development in the European Union. Energy (Oxf) 270, 126804. doi:10.1016/j.energy.2023.126804
Broisch, J., Schmidt, J., Haunschild, J., and Rein, S. (2014). Umg n-type cz-silicon: influencing factors of the light-induced degradation and its suitability for pv production. Energy Procedia 55, 526–532. doi:10.1016/j.egypro.2014.08.019
Charabi, Y., and Gastli, A. (2011). Pv site suitability analysis using gis-based spatial fuzzy multi-criteria evaluation. Renew. Energy 36, 2554–2561. doi:10.1016/j.renene.2010.10.037
Chen, Y., Yue, X., Tian, C., Letu, H., Wang, L., Zhou, H., et al. (2023). Assessment of solar energy potential in China using an ensemble of photovoltaic power models. Sci. Total Environ. 877, 162979. doi:10.1016/j.scitotenv.2023.162979
David, T., Price, D. W. M. I., Michael, F., and Hutchinsond, J. L. K. (2000). A comparison of two statistical methods for spatial interpolation of canadian monthly mean climate data. Meteorology, Agric. For., 81–89. doi:10.1016/s0168-1923(99)00169-0
Dawson, L., and Schlyter, P. (2012). Less is more: strategic scale site suitability for concentrated solar thermal power in western Australia. Energy Policy 47, 91–101. doi:10.1016/j.enpol.2012.04.025
Dzikuć, M., Piwowar, A., and Dzikuć, M. (2022). The importance and potential of photovoltaics in the context of low-carbon development in Poland. Energy Storage Sav. 1, 162–165. doi:10.1016/j.enss.2022.07.001
Elboshy, B., Alwetaishi, M., Aly, R., and Zalhaf, A. S. (2022). A suitability mapping for the pv solar farms in Egypt based on gis-ahp to optimize multi-criteria feasibility. Ain Shams Eng. J. 13, 101618. doi:10.1016/j.asej.2021.10.013
Giamalaki, M., and Tsoutsos, T. (2019). Sustainable siting of solar power installations in mediterranean using a gis/ahp approach. Renew. Energy 141, 64–75. doi:10.1016/j.renene.2019.03.100
Gobio-Thomas, L. B., Darwish, M., and Stojceska, V. (2023). Environmental impacts of solar thermal power plants used in industrial supply chains. Therm. Sci. Eng. Prog. 38, 101670. doi:10.1016/j.tsep.2023.101670
Grenon, M., and Laflamme, A. (2011). Slope orientation assessment for open-pit mines, using gis-based algorithms. Comput. Geosci. 37, 1413–1424. doi:10.1016/j.cageo.2010.12.006
Guo, X., Dong, Y., and Ren, D. (2023). Co2 emission reduction effect of photovoltaic industry through 2060 in China. Energy (Oxf) 269, 126692. doi:10.1016/j.energy.2023.126692
Hassaan, M. A., Hassan, A., and Al-Dashti, H. (2021). Gis-based suitability analysis for siting solar power plants in Kuwait. Egypt. J. Remote Sens. Space Sci. 24, 453–461. doi:10.1016/j.ejrs.2020.11.004
Hengevoss, D., Baumgartner, C., Nisato, G., and Hugi, C. (2016). Life cycle assessment and eco-efficiency of prospective, flexible, tandem organic photovoltaic module. Sol. Energy 137, 317–327. doi:10.1016/j.solener.2016.08.025
Hermoso, V., Bota, G., Brotons, L., and Morán-Ordóñez, A. (2023). Addressing the challenge of photovoltaic growth: integrating multiple objectives towards sustainable green energy development. Land Use Policy 128, 106592. doi:10.1016/j.landusepol.2023.106592
Höfer, T., Sunak, Y., Siddique, H., and Madlener, R. (2016). Wind farm siting using a spatial analytic hierarchy process approach: A case study of the städteregion aachen. Appl. Energy 163, 222–243. doi:10.1016/j.apenergy.2015.10.138
Ji, Q., Li, K., Wang, Y., Feng, J., Li, R., and Liang, R. (2022). Effect of floating photovoltaic system on water temperature of deep reservoir and assessment of its potential benefits, a case on xiangjiaba reservoir with hydropower station. Renew. Energy 195, 946–956. doi:10.1016/j.renene.2022.06.096
Kocabaldir, C., and Yucel, M. A. (2023). Gis-based multicriteria decision analysis for spatial planning of solar photovoltaic power plants in canakkale province, Turkey. Renew. Energy 212, 455–467. doi:10.1016/j.renene.2023.05.075
Lee, C. (2022). Long-term wind speed interpolation using anisotropic regression kriging with regional heterogeneous terrain and solar insolation in the United States. Energy Rep. 8, 12–23. doi:10.1016/j.egyr.2021.11.285
Lee, M., Hong, T., Jeong, J., and Jeong, K. (2018). Development of a rooftop solar photovoltaic rating system considering the technical and economic suitability criteria at the building level. Energy (Oxf) 160, 213–224. doi:10.1016/j.energy.2018.07.020
Li, X., Mauzerall, D. L., and Bergin, M. H. (2020). Global reduction of solar power generation efficiency due to aerosols and panel soiling. Nat. Sustain 3, 720–727. doi:10.1038/s41893-020-0553-2
Magalhães, I. B., Cabral De Barros Nogueira, G. C., Lage Alves, I. S., Calijuri, M. L., Lorentz, J. F., and Alves, S. D. C. (2020). Site suitability for photovoltaic energy expansion: A brazilian's high demand states study case. Remote Sens. Appl. Soc. Environ. 19, 100341. doi:10.1016/j.rsase.2020.100341
Maraj, A., Kërtusha, X., and Lushnjari, A. (2022). Energy performance evaluation for a floating photovoltaic system located on the reservoir of a hydro power plant under the mediterranean climate conditions during a sunny day and a cloudy-one. Energy Convers. Manag. X 16, 100275. doi:10.1016/j.ecmx.2022.100275
Md Khairi, N. H., Akimoto, Y., and Okajima, K. (2022). Suitability of rooftop solar photovoltaic at educational building towards energy sustainability in Malaysia. Sustain. Horizons 4, 100032. doi:10.1016/j.horiz.2022.100032
Mitra, K. Y., Zeiner, C., Köder, P., Müller, J., Lotter, E., Willert, A., et al. (2022). Development of a p1-filling process to increase the cell performance in the copper indium gallium selenide photovoltaics by implementation of the inkjet technology. Micro Nano Eng. 16, 100152. doi:10.1016/j.mne.2022.100152
Narvaez, G., Giraldo, L. F., Bressan, M., and Pantoja, A. (2022). The impact of climate change on photovoltaic power potential in southwestern Colombia. Heliyon 8, e11122. doi:10.1016/j.heliyon.2022.e11122
Noorollahi, Y., Ghenaatpisheh Senani, A., Fadaei, A., Simaee, M., and Moltames, R. (2022). A framework for gis-based site selection and technical potential evaluation of pv solar farm using fuzzy-boolean logic and ahp multi-criteria decision-making approach. Renew. Energy 186, 89–104. doi:10.1016/j.renene.2021.12.124
Nyimbili, P. H., and Erden, T. (2020). Gis-based fuzzy multi-criteria approach for optimal site selection of fire stations in istanbul, Turkey. Socioecon. Plann Sci. 71, 100860. doi:10.1016/j.seps.2020.100860
Ouchani, F. Z., Jbaihi, O., Maaroufi, M., and Ghennioui, A. (2021). Identification of suitable sites for large-scale photovoltaic installations through a geographic information system and analytical hierarchy process combination: A case study in marrakesh-safi region, Morocco. Prog. Photovoltaics Res. Appl. 29, 714–724. doi:10.1002/pip.3357
Rawa, M., Abusorrah, A., Bassi, H., Mekhilef, S., Ali, Z. M., Abdel Aleem, S. H. E., et al. (2021). Economical-technical-environmental operation of power networks with wind-solar-hydropower generation using analytic hierarchy process and improved grey wolf algorithm. Ain Shams Eng. J. 12, 2717–2734. doi:10.1016/j.asej.2021.02.004
Raza, M. A., Yousif, M., Hassan, M., Numan, M., and Abbas Kazmi, S. A. (2023). Site suitability for solar and wind energy in developing countries using combination of gis-ahp; A case study of Pakistan. Renew. Energy 206, 180–191. doi:10.1016/j.renene.2023.02.010
Ren, F., Tian, Z., Liu, J., and Shen, Y. (2020). Analysis of co2 emission reduction contribution and efficiency of China’s solar photovoltaic industry: based on input-output perspective. Energy (Oxf) 199, 117493. doi:10.1016/j.energy.2020.117493
Schmitter, P., Kibret, K. S., Lefore, N., and Barron, J. (2018). Suitability mapping framework for solar photovoltaic pumps for smallholder farmers in sub-saharan africa. Appl. Geogr. 94, 41–57. doi:10.1016/j.apgeog.2018.02.008
Shriki, N., Rabinovici, R., Yahav, K., and Rubin, O. (2023). Prioritizing suitable locations for national-scale solar pv installations: israel's site suitability analysis as a case study. Renew. Energy 205, 105–124. doi:10.1016/j.renene.2023.01.057
Shukla, S., Lee, E., Lunt, R. R., and Anctil, A. (2022). Net energy and cost benefit of phthalocyanine and heptamethine transparent photovoltaics in commercial buildings. Sustain Energy Technol. Assess. 53, 102631. doi:10.1016/j.seta.2022.102631
Springer, R. M., and Thomas, M. E. (2013). Analysis and comparison of single crystal and polycrystalline nd:yag, absorption. Ieee J. Quantum Electron 49, 667–676. doi:10.1109/JQE.2013.2269026
Sun, L., Jiang, Y., Guo, Q., Ji, L., Xie, Y., Qiao, Q., et al. (2021). A gis-based multi-criteria decision making method for the potential assessment and suitable sites selection of pv and csp plants. Resour. Conservation Recycl. 168, 105306. doi:10.1016/j.resconrec.2020.105306
Sun, Y., Hof, A., Wang, R., Liu, J., Lin, Y., and Yang, D. (2013). Gis-based approach for potential analysis of solar pv generation at the regional scale: A case study of fujian province. Energy Policy 58, 248–259. doi:10.1016/j.enpol.2013.03.002
Tennakoon, S., Apan, A., Maraseni, T., and Altarez, R. D. D. (2023). Decoding the impacts of space and time on honey bees: gis based fuzzy ahp and fuzzy overlay to assess land suitability for apiary sites in queensland, Australia. Appl. Geogr. 155, 102951. doi:10.1016/j.apgeog.2023.102951
Tripathy, B. R., Sajjad, H., Elvidge, C. D., Ting, Y., Pandey, P. C., Rani, M., et al. (2018). Modeling of electric demand for sustainable energy and management in India using spatio-temporal DMSP-OLS night-time data. Environ. Manag. 4, 615–623. doi:10.1007/s00267-017-0978-1
Villacreses, G., Martínez-Gómez, J., Jijón, D., and Cordovez, M. (2022). Geolocation of photovoltaic farms using geographic information systems (gis) with multiple-criteria decision-making (mcdm) methods: case of the ecuadorian energy regulation. Energy Rep. 8, 3526–3548. doi:10.1016/j.egyr.2022.02.152
Wang, L., Xu, S., Gong, Y., Ning, J., Zhang, X., and Zhao, Y. (2022). High resolution photovoltaic power generation potential assessments of rooftop in China. Energy Rep. 8, 14545–14553. doi:10.1016/j.egyr.2022.10.396
Wang, R., Li, Y., and Gao, B. (2023). Evolutionary game-based optimization of green certificate-carbon emission right-electricity joint market for thermal-wind-photovoltaic power system. Glob. Energy Interconnect. 6, 92–102. doi:10.1016/j.gloei.2023.02.008
Wu, Y., Ke, Y., Zhang, T., Liu, F., and Wang, J. (2018). Performance efficiency assessment of photovoltaic poverty alleviation projects in China: A three-phase data envelopment analysis model. Energy (Oxf) 159, 599–610. doi:10.1016/j.energy.2018.06.187
Xie, Y., Chen, Y., and Wu, L. (2023). Regional industrial development trend under the carbon goals in China. Energy Sources Part a-Recovery Util. Environ. Eff. 45, 8029–8046. doi:10.1080/15567036.2023.2225466
Xin-gang, Z., Wei, W., and Ling, W. (2021). A dynamic analysis of research and development incentive on China's photovoltaic industry based on system dynamics model. Energy (Oxf) 233, 121141. doi:10.1016/j.energy.2021.121141
Xu, Z., Lian, J., Zhang, J., and Bin, L. (2020). Investigating and optimizing the water footprint in a typical coal energy and chemical base of China. Sci. Total Environ. 727, 138781. doi:10.1016/j.scitotenv.2020.138781
Yang, H., and Wang, H. (2022). Numerical simulation of the dust particles deposition on solar photovoltaic panels and its effect on power generation efficiency. Renew. Energy 201, 1111–1126. doi:10.1016/j.renene.2022.11.043
Zhang, Y., Ren, J., Pu, Y., and Wang, P. (2020). Solar energy potential assessment: A framework to integrate geographic, technological, and economic indices for a potential analysis. Renew. Energy 149, 577–586. doi:10.1016/j.renene.2019.12.071
Zhao, K., Ma, X., Zhang, H., and Dong, Z. (2022). Performance zoning method of asphalt pavement in cold regions based on climate indexes: A case study of inner Mongolia, China. Constr. Build. Mater 361, 129650. doi:10.1016/j.conbuildmat.2022.129650
Keywords: geographic information sensing, multi-criteria decision making, photovoltaic power generation, suitability, generation potential, emission reduction benefits
Citation: Xu W, Liu Z and Liu S (2023) Suitability of photovoltaic development and emission reduction benefits based on geographic information sensing and multi-criteria decision making method—an example from Inner Mongolia Autonomous Region. Front. Energy Res. 11:1222306. doi: 10.3389/fenrg.2023.1222306
Received: 14 May 2023; Accepted: 07 September 2023;
Published: 15 September 2023.
Edited by:
Xiaofeng Xu, China University of Petroleum, ChinaReviewed by:
Agnimitra Biswas, National Institute of Technology, Silchar, IndiaChristian Wagner, Georgetown University, United States
Copyright © 2023 Xu, Liu and Liu. This is an open-access article distributed under the terms of the Creative Commons Attribution License (CC BY). The use, distribution or reproduction in other forums is permitted, provided the original author(s) and the copyright owner(s) are credited and that the original publication in this journal is cited, in accordance with accepted academic practice. No use, distribution or reproduction is permitted which does not comply with these terms.
*Correspondence: Zhenling Liu, m17861856998@163.com