 Jilu Liu1*
 Zechen Zhang2
- 1School of Business, Zhejiang Wanli University, Ningbo, Zhejiang, China
- 2Department of Engineering, Woosuk University, Wanju, Jeonbuk, Republic of Korea
In recent years, although China’s economy has continued to grow, the environmental impact is greatly affected by the use of primary energy, such as global warming, which has become more and more serious. Under the background of energy conservation and emission reduction, China’s emission reduction pressure is very great. In this paper, an online monitoring system for carbon emissions is developed for real-time monitoring of carbon emissions, and the ant colony algorithm is used to perform multi-objective optimization based on “construction period-cost-carbon emissions.” Through the organic integration of wireless sensors, communication networks, cloud servers, and mobile devices, a real-time monitoring system for carbon emissions has been developed, which can monitor and visualize the carbon emissions generated by major machinery on site in real time. At the same time, the resource consumption of each process in different modes is sorted out, and the multi-objective optimization problem of “construction period-cost-carbon emission” is designed to seek the optimal solution by combining the multi-objective optimization theory. In this paper, the developed real-time monitoring system is applied in the actual field, the stability and practicability of the system are verified, and the process-related data is obtained by combining the monitoring system and field investigation. The experimental results show that the relative deviations of the two units are consistent, fluctuating between 0.54% and 6.14%, and the overall deviations are 3.61% and 3.63%, respectively. Therefore, the online carbon emission monitoring system has stable data and high accuracy. By comparing the data trends of the online monitoring method and the emission factor method, it is found that the two trends are consistent, which verifies the applicability of the online monitoring method in the field of carbon emission monitoring.
1 Introduction
High quality emission data is the foundation of carbon trading, and the selection of monitoring methods is crucial for establishing a reliable carbon emission monitoring system and improving the accuracy of carbon emission data (Blanco-Donado et al., 2022). China’s energy conservation and emission reduction plan faces great challenges. Under the background of sustainable development and the new normal of the economy, China needs to closely integrate the development of the national economy with the reduction of carbon emissions, and find a new way of economic development. The advancement of information technology provides a platform for the field of carbon emission calculation and assessment, which not only improves efficiency but also provides management ideas. Using IT technology to conduct real-time monitoring and research on carbon emissions will help to achieve effective management of carbon emissions and promote low-carbon development (Chang-Ho et al., 2021). It enables on-site managers to easily understand the changes in carbon emissions in real time, which is conducive to the formulation of targeted emission reduction measures. At the same time, the research on the mechanism behind carbon emission data can also provide a reliable and detailed data basis for the government or other relevant departments to formulate emission reduction policies, carbon emission standards or quotas. In addition, the system can monitor the running time of various construction machinery, which can help construction enterprises to formulate the consumption quota of internal machinery. Or it proposes a correction factor for the industry quota to improve the pertinence of the quota and promote the continuous development of the quota (Zhang et al., 2021). The carbon emission data of manuscript quality is the foundation of carbon trading, and a reliable carbon emission monitoring, reporting, and verification system is the cornerstone of the construction and operation of the carbon trading system. The system studied in this article can not only achieve real-time monitoring of carbon emission data on construction sites, but also help construction personnel view the carbon emission situation on site in real time.
Comprehensive analysis of urban transportation carbon emissions is the key to realizing low-carbon transportation. Sun D. J. et al. (2017) started with the architectural design of a carbon emission mobile monitoring system using multiple sets of equipment, and collected traffic data to calibrate the emission model MOVES. He combined various sensitivity and correlation evaluation indicators to monitor and analyze transportation carbon emissions. Yuan et al. (2017) research showed that AMS monitors airflow velocity and methane concentration among other ventilation-related parameters at specific mine locations. Based on the theory of heat and mass transfer in ventilation airflow, it uses CO, CO, and airflow velocity from AMS sensor data. Sun J. et al. (2017) used multi-dimensional mobile monitoring equipment to study the formation mechanism of transportation carbon dioxide emissions from different dimensions. He found out the main factors that affect CO2 emissions from transportation, the vehicle emission model is calibrated using the results of mobile monitoring, and the reliability of the model is verified. Reducing emissions from deforestation and forest degradation in developing countries is considered an effective and cost-effective measure to mitigate climate change. Olayinka et al. (2021) assessed Nigeria’s progress in implementing forest carbon storage monitoring and quantification requirements in the context of REDD+. This study was conducted through a case study that reviewed and analyzed national and international REDD+documents related to MRV. SunXueCheng et al. (2021) proposed a trajectory based analysis method to determine the sources of high travel carbon emissions and the relationship between car use and travel carbon emissions. The Vehicle Specific Power Model (VSP) considers the impact of vehicle operating speed on emissions and is used to estimate emissions from the start of travel to the destination. He divided the research area into grids based on population distribution, and calculated grid carbon emissions (GCE) and grid average carbon emissions. However, the acquisition of relevant data such as mechanical shifts and engineering quantities by these methods is achieved through the engineering quantity list and the consumption quota.
Building a smart city has become a key task of construction work, and the top priority of building a smart city is to control carbon emissions. In the context of carbon emissions, Liu et al. (2020) established a decision-making optimization model for auto parts low-carbon supply chain based on carbon emission responsibility sharing and resource sharing. Smart cities provide sustainable and economical services to citizens, and with the increase in carbon emissions, the popularization of EVs is an important step towards an environmentally friendly smart city. Aujla et al. (2018) proposed a multi-leader and multi-follower Stackelberg game for energy trading, and designed multi-parameter pricing through parameters such as electricity consumption and usage time. Considering the relevance of IoT-connected smart city concepts, Galvo et al. (2017) aimed to improve the sustainability and energy autonomy of buildings by applying new energy models in existing public buildings. The idea of a smart city is to seek to improve the lives of these city dwellers by utilizing high-capacity modern means of communication. Kadhim (2019) has effectively contributed to the improvement of the quality of life in some congested cities through solutions such as reducing energy consumption and reducing carbon dioxide emissions. With the explosion of smart cities and IoT applications, this brings more intelligence to smart cities and public transportation to solve fundamental problems such as human monitoring of safety, traffic and traffic. Alam et al. (2017) implemented collaborative sensing for smart beaches and intelligent transportation systems in IoT and develops an end-to-end reference implementation utilizing big data. The above studies propose methods for monitoring carbon emissions. However, these methods have not achieved the effect of real-time monitoring in terms of monitoring frequency, and the visualization of carbon emission data is still insufficient.
The traditional emission coefficient method refers to the statistical average of the amount of gas emitted by a unit of production under normal technical, economic, and management conditions, and the emission coefficient is also known as the emission factor. However, there are significant differences in carbon emission coefficients under the influence of factors such as different technological levels, production conditions, energy usage, and process processes. Therefore, the uncertainty of using the coefficient method is also significant. The system studied in this article can not only achieve real-time monitoring of carbon emission data on construction sites, but also help construction personnel view the carbon emission situation on site in real time. It can also obtain more data related to the construction process, facilitating management personnel to have a better understanding of the construction site.
2 Carbon emission monitoring and algorithm design
2.1 Status of carbon emission and digital management system
Carbon dioxide emissions cannot be equated with carbon emissions, which are an umbrella term for all greenhouse gases. In the case that the actual measurement conditions are not popular, the state proposes a default value based on the measurement results of multiple units to represent the average level of the majority of units. However, according to multi-party calculations, this method has many influencing factors, and the representativeness of the default value is questionable.
Although the introduction of intelligent methods has improved the calculation efficiency of carbon emission evaluation and the visualization of evaluation results to a certain extent, most of these methods simulate and predict carbon emissions from different dimensions before or after project construction, rather than real-time monitoring at the construction site stage (Reuter et al., 2019). Some people use the GID database to evaluate and calculate carbon reduction, which can develop more accurate carbon reduction planning plans and refine carbon reduction targets onto individual devices; Some scholars have also simulated and tested carbon emission efficiency using the Carbon Monitor big data system. Moreover, many methods use quotas or bills of quantities when calculating carbon emissions, which may lead to deviations in the calculation results. Because the quota can only represent the national or industry average level, it cannot reflect the real level of each specific project.
2.2 Evaluation indicators and algorithm design
2.2.1 Evaluation indicators
Since the optimization process in this paper involves three objectives of time, cost and carbon emission, how to evaluate the pros and cons of each feasible solution has become a problem that needs to be solved before algorithm design. In the research process of this paper, the meanings represented by each goal are not the same. For each sub-objective function, the relative deviation is used to measure the pros and cons of the feasible solution, that is, the deviation of the actual value of a certain target from the minimum value of all feasible solutions of the target (Fedi, 2017). In this paper, the method of random and dynamic weighting is adopted, and a comprehensive objective function is constructed by combining the related concepts of aggregation function. This effectively simplifies the multi-objective solution, thereby speeding up the solution progress and ensuring the accuracy of the solution results (Mohammed and Miklas, 2019).
For the model in this paper, each ant corresponds to a feasible solution, and the evaluation of the pros and cons of an ant includes three indicators: time, cost, and carbon emissions. The degree of deviation of the time index of the kth ant corresponding to the feasible solution can be expressed by Formula 1.
In the same way, the cost of the kth ant corresponding to the feasible solution and the deviation degree of the carbon emission index are shown in Formulas 2, 3.
Formulas 1–Formulas 3 have given the evaluation method of the pros and cons of each ant corresponding to the sub-goals of feasible solutions. Therefore, for the evaluation of the pros and cons of the overall goal, on the basis of the pros and cons of the sub-goals, the corresponding weight coefficient w is introduced for calculation, so as to obtain the comprehensive objective function expression as shown in Formula 4:
Among them, r is a random number between (0, 1), which can effectively ensure the validity of the target value. At the same time, in order to achieve the global optimal effect, this paper draws on the practice in previous research. The random dynamic weight method is used to provide weight coefficients for the comprehensive objective function, so that the model can continuously change the search direction during the optimization process, and it will not fall into a local optimum (Spurrier, 2017). For a comprehensive function with m sub-objectives, the distribution of the weight coefficients follows the Formula 5.
2.2.2 Algorithm design
Under the given construction mode and construction conditions, it is necessary to find the construction scheme with the minimum time, cost and carbon emission, so as to effectively guide the construction process. The specific algorithm flow and algorithm design include the following parts:
It prevents the solution process from falling into a local optimum and ensures the rationality and globality of the optimal solution (Gately and Hutyra, 2017). The comprehensive objective function assigns weight coefficients as shown in Formula 6.
For the comprehensive objective function, when the function value is smaller, it indicates that the corresponding feasible solution has less consumption in terms of “time, cost and carbon emission”, which means that the feasible solution is better (Tamilarasu et al., 2020). According to this principle, we need to calculate the value of the comprehensive objective function in the solution process as shown in Formula 7.
After completing one cycle, the pheromone concentration of the path needs to be updated in time for the next cycle. The pheromone is obtained by adding the remaining concentration of the pheromone concentration before the current cycle after the current cycle and the pheromone concentration left by the ants during this cycle, as shown in Formula 8.
The basic calculation formula of
Before the next cycle starts, the ants’ selection probability for each path should be calculated. Generally speaking, the path choice of ants will be affected by two factors. Among them, the concentration of pheromone can be known from the foregoing content, and the degree of visibility is shown in Formula 10.
a and β represent the relative importance of pheromone and path visibility, respectively, which are both constants. When the j node cannot form an effective process with the i node, its selection probability value is 0. When an ant faces a path selection, its probability is shown in Formula 11.
When choosing a path for an ant, it will go through two selection processes. First, generate a random number q between (0, 1), and compare it with the given number
Due to the constraints of various resources in the process of production and life, people need to use limited resources to produce more products, or try to consume less resources under the premise of producing the same products (Vojtisek-Lom et al., 2020; Deepak Kumar et al., 2022).
2.3 Multi-objective function processing
The objective programming method is generated earlier and is suitable for the situation where the optimal value of the sub-objective is easy to find. The mathematical expression is:
Among them, q represents the number of constraints, and
When using the hierarchical sorting method to solve the multi-objective optimization problem, the importance of all sub-objectives is firstly quantified and then sorted to obtain the optimal solution of the original problem, as shown in Formula 15.
Then the second round of solution is performed:
The fixed weight method assigns a fixed weight coefficient to each sub-objective, and performs weighted calculation on the sub-objective function value corresponding to each feasible solution. The pros and cons of feasible solutions are evaluated by comparing the comprehensive objective function values calculated by weighting (Ershov and Sochilova, 2020; Nasser et al., 2023). For example, if there are m sub-goals, first set a weight coefficient for each sub-goal through the expert scoring method or the analysis and comparison method to satisfy:
Assuming that each sub-goal is
Then, by comparing the single-objective optimization methods, the pros and cons of the feasible solutions can be judged, and finally the optimal solution of the original problem can be obtained (Kuhlmann et al., 2020).
Through the construction of sub-goal models of construction period, cost and carbon emission, based on the purpose of minimizing construction period, cost and carbon emission, a multi-objective optimization model of “construction period-cost-carbon emission” can be established, as shown below:
3 Construction and carbon emission monitoring and digital management system
3.1 Framework construction of carbon emission real-time monitoring system
The design of the platform is based on the concept of “comprehensive planning, appropriate promotion, step-by-step implementation.” The overall design of the cloud platform system for smart city and carbon monitoring management consists of 3 main parts: cloud monitoring platform, engineering team and equipment support team, as shown in Figure 1.

FIGURE 1. Smart city and carbon emission monitoring and management cloud platform system.
As shown in Figure 1, the cloud monitoring platform is the core of the smart energy and carbon monitoring system, including a data processing center, an interactive web interface, and a large-screen display. In order to make this design scheme scientific, especially more practical, the implementation and operation of the whole system should take into account all aspects, and form the integration and mutual support of technology, engineering and service. The computing layer consists of corresponding servers and databases, similar to the CPU of the system, which is mainly responsible for computing, storing and processing data. The interaction layer is composed of the corresponding portable client and virtual model, which is mainly responsible for the interaction between the real world and the virtual model. The overall framework of the system is shown in Figure 2.
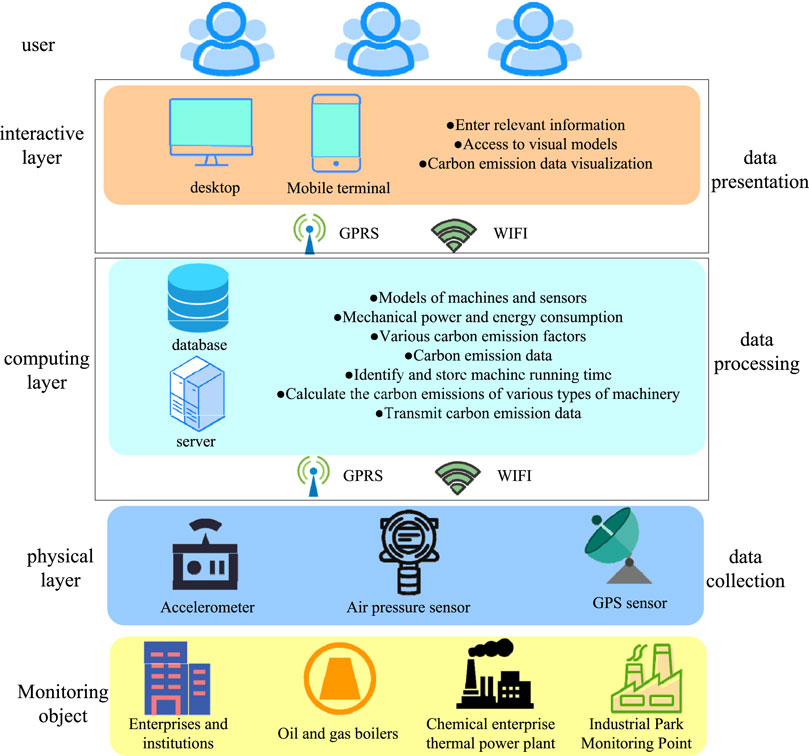
FIGURE 2. Overall framework of the system.
As shown in Figure 2, in this system framework, the physical layer is mainly composed of wireless sensors to collect machinery operation data at the construction site. When the sensors are connected with the construction machinery, they can record the movement state of the construction machinery, and send the movement state and corresponding data to the server, thus completing the data collection function of the physical world. When the operation state of the construction machine is transmitted to the server, the server determines the operation time of the construction machine, and calculates the carbon dioxide emission in the time period according to a predetermined calculation logic, and then stores it in the database. The interaction layer consists of desktops and mobile phones, where users can view the operating status and carbon dioxide emission data of construction machinery, enabling efficient interaction.
In the system development process, for better division of labor, system development activities are divided into hardware and software development. The hardware part includes the development of wireless sensors, while the software part includes the choice of communication network, server, database and client platform.
3.2 Measuring point arrangement for flow and concentration measurement
In view of the large deviations in the measurement of flow, humidity and carbon dioxide concentration in the direct monitoring method, on the basis of solving these problems, a set of carbon emission on-line monitoring system is researched and developed. Figure 3 shows the schematic layout of the flue section concentration and pressure difference measuring points.
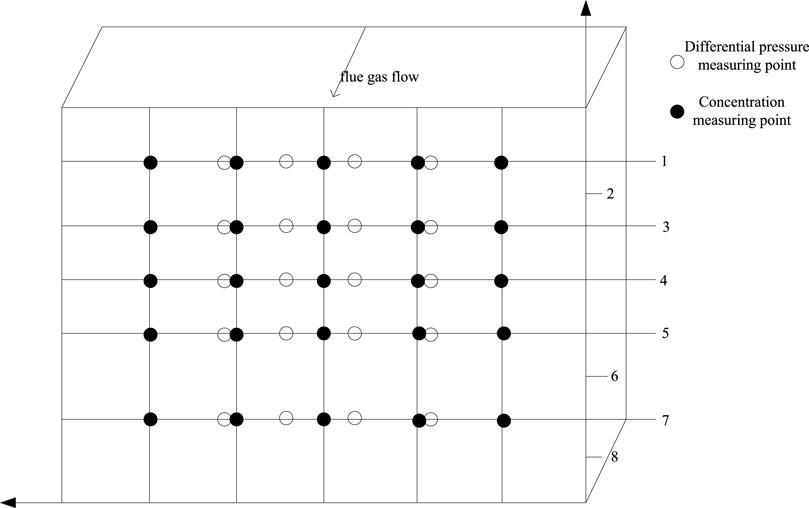
FIGURE 3. Schematic diagram of the layout of the concentration and pressure difference measuring points in the flue section.
As shown in Figure 3, referring to the setting of environmental protection measuring points, it is determined that the section where the environmental protection comparison flange hole is located outside the tail flue is the sampling section. The measuring section of the flue is 6 m deep and 5.3 m high. Taking the flue depth as the X-axis and the height as the Y-axis, 5*5 measuring points are selected. In view of the site construction conditions, the concentration measurement point and the differential pressure measurement point are slightly different. This has little effect on the overall uniformity of the flow field and concentration field on the study section, which can be ignored. There are 8 flange holes on the flue wall, and the backrest pipe and sampling pipe are extended from the 1, 3, 4, 5, and 7 flange holes to carry out measurement work.
Referring to the national standard, this paper takes 0.8, 1.8, 2.8, 3.8, and 4.8 m on the X-axis, and 1.59, 2.65, 3.18, 3.71, and 4.77 m on the Y-axis. The values of X and Y are cross-combined to obtain 5*5 measuring points. The measured carbon dioxide volume concentrations are shown in Table 1.
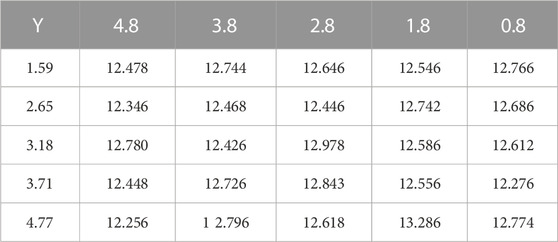
TABLE 1. Sectional CO2 volume concentration measurements (%).
As shown in Table 1, the average cross-sectional carbon dioxide volume concentration is 12.63%, the standard deviation is 0.23, and the relative standard deviation is 1.8%. Although the volume concentration of carbon dioxide varies slightly on the cross section, its distribution remains uniform as a whole. Based on the experimental results, it is known that a smaller number of measurement grids can effectively improve the measurement accuracy of cross-section concentration. It is recommended to arrange two or three measuring points on the same section and the same level. In addition, the concentration of CO was also measured during the test, and its average concentration was only 1/100,000 of the concentration of
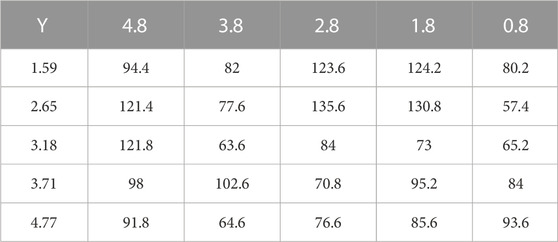
TABLE 2. Differential pressure (Pa) at measuring points of flue section.
As shown in Table 2, the maximum differential pressure of the section is 135.6 Pa, the minimum differential pressure is 57.2 Pa, and the relative standard deviation of the differential pressure is 12.35%. Based on the field test results and the engineering practice, it is recommended to arrange multiple sets of measuring points symmetrically on the same section to improve the speed measurement accuracy.
3.3 Architecture of carbon emission online monitoring system
Based on the above research, based on the concept of in situ measurement of some flues, a set of in situ measurement of carbon dioxide by TDLAS method was built in the laboratory. In this device, a heating wire is wound around the upper part of the gas pool to heat the gas and simulate the temperature of the flue gas. Dust and water vapor are also added to the gas to simulate the real flue gas with high humidity and high dust, as shown in Figure 4.
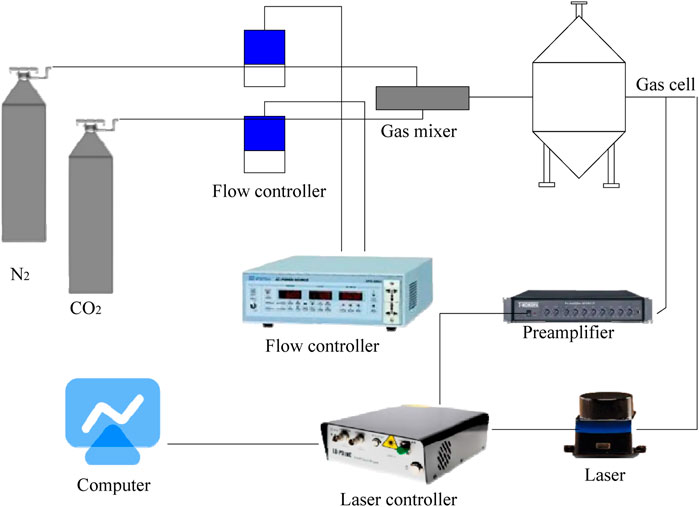
FIGURE 4. Schematic diagram of the in situ measurement of carbon dioxide by TDLAS method.
As shown in Figure 4, water vapor and dust will contaminate the optical mirror in a short time, seriously affecting the measurement accuracy. Considering that the dust concentration and humidity in the on-site flue are high, and the vibration of the flue wall will also affect the performance of the optical path and optical instruments, the interference of dust and water vapor can be eliminated through pretreatment. The measuring device is far away from the flue, and cannot be affected by vibration on the optical path and optical instruments. The flue gas enters from the sampling probe, and reaches the analysis cabinet through the sampling and heat tracing pipeline. After pretreatment, it is measured by the measurement module. The working flow chart of the carbon emission online monitoring system is shown in Figure 5.
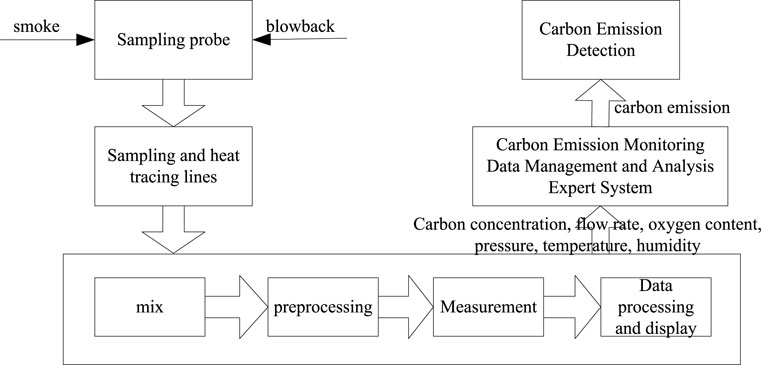
FIGURE 5. Workflow of the carbon emission online monitoring system.
As shown in Figure 5, it is determined to select two measurement points, and after sampling, mixing and pretreatment, gas concentration measurement is carried out. Due to the high dust concentration in the flue, in order to prolong the service life of the sampling probe, a back-purging pipeline is set up, and the sampling tube and probe are regularly purged. In this paper, parameters such as carbon dioxide concentration, flow rate, oxygen content, pressure, temperature, and humidity are transmitted to the carbon emission monitoring data management and analysis expert system, and the purchased electricity data is read. The carbon emission monitoring data management and analysis expert system conducts comprehensive processing to calculate the carbon dioxide emission rate and emission amount of the enterprise. Finally, the carbon emission data is connected to the carbon emission detection for online verification.
3.4 Total deconstruction
The error of the online monitoring method mainly comes from the results of the two parameters of flue gas flow rate and carbon dioxide concentration, with few parameters and high accuracy. There are few human factors in the error, which mainly come from the error brought by the sampling point and the equipment itself. Carrying out operation and maintenance according to the requirements can control the error within a certain range. The solution circulation volume can be adjusted appropriately according to changes in load. It can also strengthen oxidation regeneration to ensure the residence time of the rich liquid in the spray regeneration tank, achieving the purpose of regeneration. The total CO2 emissions from the desulfurization process of the two units in the effective months of the year are shown in Figure 6.
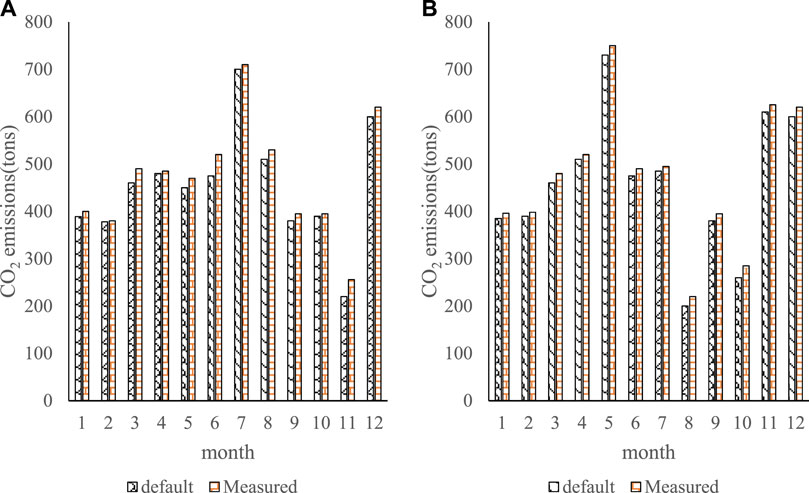
FIGURE 6. Carbon dioxide emissions from the desulfurization process of Units 1 and 2. (A) Carbon emissions of Unit 1 (B) Carbon emissions of Unit 2.
As shown in Figure 6, the measured carbon emissions of Unit 1 fluctuate in the range of 234–695 t, the total annual emissions are 5,486 t, and the default emission range is 221–684 t. Total emissions are 5,288 t. The measured emission of Unit 2 is 196–766 t, and the default value fluctuation range is 188–730 t. It can be concluded from the annual trend that the measured carbonate content is higher than the default value, and the measured carbon emission value is higher than the default calculated value.
3.5 Deviation deconstruction
To quantify the impact of carbonate content on carbon dioxide emissions, the relative deviation analysis of the two units is shown in Figure 7.
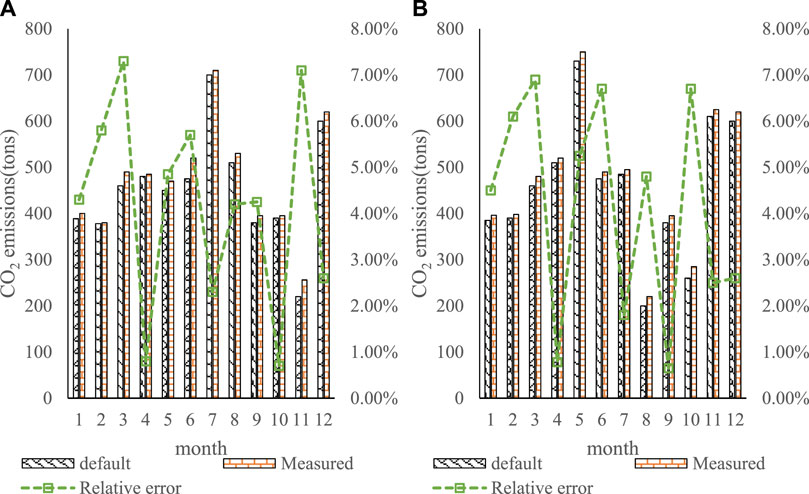
FIGURE 7. Effect of carbonate content in desulfurizers for Units 1 and 2 on carbon emissions. (A) Impact of Unit 1 on carbon emissions (B) Impact of Unit 2 on carbon emissions.
As shown in Figure 7, the relative deviations of the two units are consistent, fluctuating between 0.54% and 6.14%, and the overall deviations are 3.61% and 3.63%, respectively. The default and actual measurement have little effect on the carbon dioxide emissions from desulfurization, and the default value of carbonate content is representative.
The annual average value of coal carbon oxidation rate of the two units (measured), the annual average value of single coal carbon oxidation rate (measured), the annual average value of coal carbon oxidation rate (semi-measured), and the annual carbon dioxide emissions of the two units are shown in Tables 3, 4.
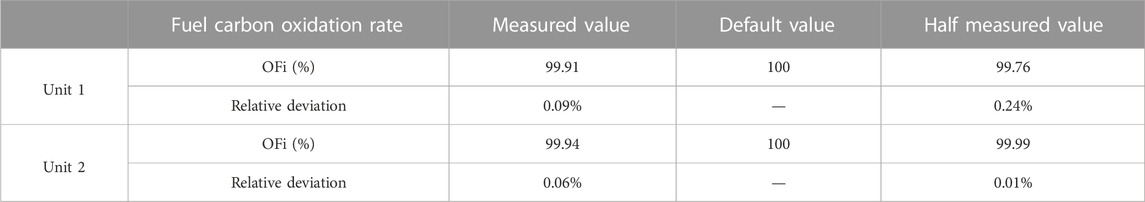
TABLE 3. Annual average of coal carbon oxidation rate of units 1 and 2.
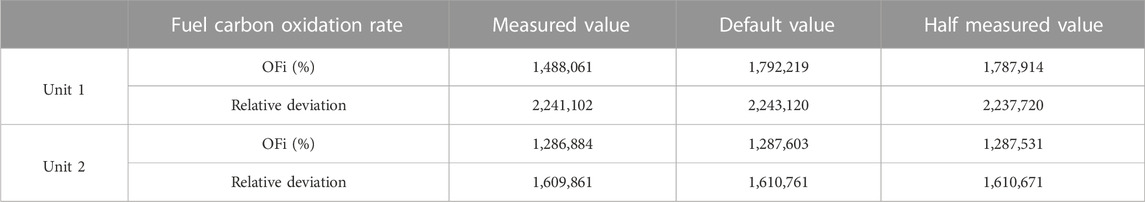
TABLE 4. Annual carbon emissions of units 1 and 2 (t).
As shown in Tables 3, 4, the differences between the three data are relatively small, with a deviation of less than 1%. Comparing the six combinations of annual data of Units 1 and 2, the conclusions are as follows: the six groups of measured carbon oxidation rates and the measured carbon content per unit of calorific value correspond to the smallest annual carbon emissions. Units 1 and 2 are 1,488,061 and 1,286,884 t respectively. The default value of carbon oxidation rate and the default value of carbon content per unit calorific value correspond to the largest annual carbon emissions. Unit 1 and Unit 2 are 2,243,120 and 1,610,761 t respectively. For the annual carbon emissions measured by the two units, the difference between the maximum and minimum emissions is 20.5% and 20% respectively. There is little difference between the three cases of carbon oxidation rate, and the difference between the maximum value and the minimum value is not more than 1%. The default value of carbon content per unit calorific value has a large deviation from the measured value. The default value of Unit 1 and Unit 2 are 21% and 18% higher than the measured value respectively. According to the third point, it can be inferred that the selected carbon content per unit of calorific value is the main factor leading to the large deviation of annual emissions.
3.6 Carbon emissions based on online monitoring method
This section analyzes the CO2 emissions data monitored by the CEMS of the two units. The two units are regularly maintained, overhauled and calibrated to ensure that the system error is within a controllable range and the data is valid. Since the carbon dioxide monitors of Units 1 and 2 were officially operated in March, the data from March to December were used for analysis, as shown in Figure 8.
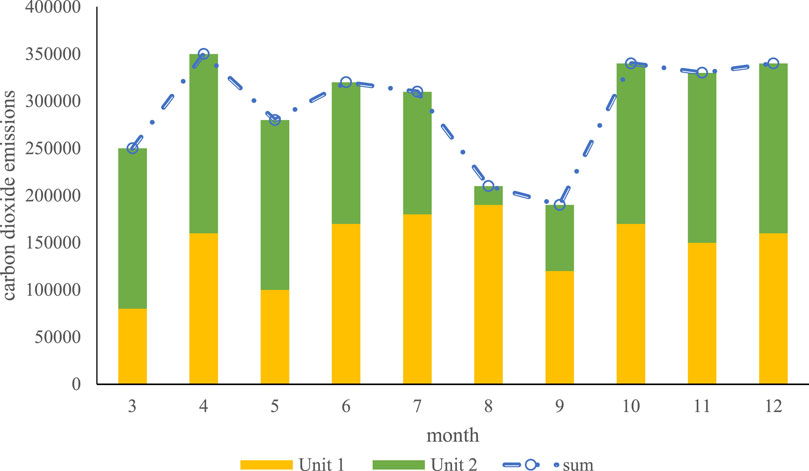
FIGURE 8. Annual carbon emissions of two units.
As shown in Figure 8, the total carbon dioxide emissions of the two units are in line with the emission law of the region where winter is the peak tourist season and summer is the off-season. The largest carbon emission of Unit 1 in the whole year was 188,842 t in August. The largest carbon emission of Unit 2 in the whole year was 209,395 t in December. The total emissions of the two units were the largest in December, at 374,159 t. According to the data of routine maintenance, the CEMS of the two units are running well and the data is stable.
3.7 Comparison of carbon emissions between calculation method and online monitoring method
This section compares the CO2 emissions of the online monitoring method and the emission factor method to verify the stability and effectiveness of the CEMS. Since the total emissions are compared, the emission factor method here is the sum of the carbon dioxide emissions from the fuel combustion process and the desulfurization process. The monthly carbon emissions of Units 1 and 2 are shown in Figure 9.
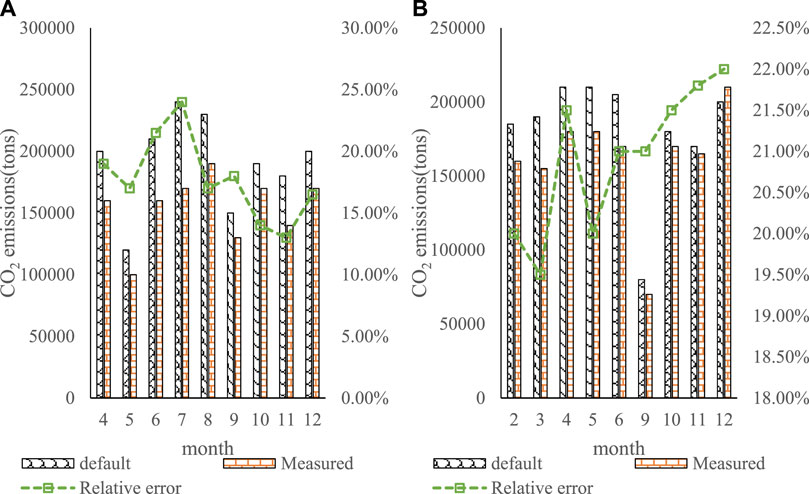
FIGURE 9. Monthly carbon emissions of Units 1 and 2. (A) The monthly carbon emissions of Unit 1 (B) The monthly carbon emissions of Unit 2.
It can be seen from Figure 9 that the trend of the emission factor method and the online monitoring method is basically the same, and the trend of the online monitoring data is stable. From the numerical value, it can be seen that the result of the emission factor method is conservative, which is larger than that of the online monitoring method. According to calculations, the deviation between the two sets of data for Unit 1 is between 17% and 20%. The deviation of the two sets of data for Unit 2 is between 18% and 20%. Overall, the online monitoring method data is more accurate. The reason for the analysis is mainly because the emission factor method assumes that the carbon combustion products are all
4 Conclusion
On the basis of fully analyzing the related research on carbon emissions in the whole life cycle of prefabricated buildings, this paper takes the on-site construction stage as the research object. A real-time monitoring system for carbon emissions at the construction site was developed using CPS technology, and a multi-objective optimization model of “construction period-cost-carbon emissions” was established in the construction process. The stability and accuracy of the CPS monitoring system were verified, and the basic data of the optimization model was formed by combining the system monitoring data and the field survey data. The ant colony algorithm is used to solve the multi-objective optimization model, and the Pareto optimal solution is obtained. It thus realizes the optimization of “construction period-cost-carbon emission” through the reasonable selection of process execution mode. In this paper, the monitoring system is divided into physical layer, computing layer and interaction layer to form a complete system framework. In the development process, the system is divided into a hardware part and a software part, and the appropriate hardware and software system components are selected according to the characteristics of the construction site, and finally the system functions are realized through the integration of the two parts. The system can not only realize the real-time monitoring of the carbon emission data on the construction site, but also help the construction personnel to check the carbon emission situation on site in real time. It can also obtain more data related to the construction process, which is convenient for managers to understand more about the construction site.
Data availability statement
The original contributions presented in the study are included in the article/Supplementary Material, further inquiries can be directed to the corresponding author.
Author contributions
JL-writing and static analysis of data. ZZ-experimental operation and check. All authors contributed to the article and approved the submitted version.
Funding
This study is funding by the Yongjiang Talent Project of Ningbo (2022B-034-G).
Conflict of interest
The authors declare that the research was conducted in the absence of any commercial or financial relationships that could be construed as a potential conflict of interest.
Publisher’s note
All claims expressed in this article are solely those of the authors and do not necessarily represent those of their affiliated organizations, or those of the publisher, the editors and the reviewers. Any product that may be evaluated in this article, or claim that may be made by its manufacturer, is not guaranteed or endorsed by the publisher.
References
Alam, M., Ferreira, J., Mumtaz, S., Jan, M. A., Rui, R., and Fonseca, J. A. (2017). Smart cameras are making our beaches safer: A 5G-envisioned distributed architecture for safe, connected coastal areas. IEEE Veh. Technol. Mag. 12 (4), 50–59. doi:10.1109/mvt.2017.2753540
Aujla, G. S., Kumar, N., Singh, M., and Albert, Y. (2018). Energy trading with dynamic pricing for electric vehicles in a smart city environment. J. Parallel Distributed Comput. 127, 169–183. doi:10.1016/j.jpdc.2018.06.010
Blanco-Donado, E. P., Schneider, I. L., Artaxo, P., Lozano-Osorio, J., Portz, L., and Oliveira, M. L. (2022). Source identification and global implications of black carbon. Earth Sci. Front. 13 (1), 101149–101416. doi:10.1016/j.gsf.2021.101149
Deepak Kumar, J., Neelakandan, S., Veeramani, T., Bhatia, S., and Hussain Memon, F. (2022). Design of fuzzy logic based energy management and traffic predictive model for cyber physical systems. Comput. Electr. Eng. 102, 108135. doi:10.1016/j.compeleceng.2022.108135
Ershov, D. V., and Sochilova, E. N. (2020). Assessment of direct pyrogenic carbon emissions in forests of Russia for 2020 according to remote monitoring data. For. Sci. Issues 4 (4), 1–8. doi:10.31509/2658-607x-2020-3-4-1-8
Fedi, L. (2017). The monitoring, reporting and verification of ships' carbon dioxide emissions: A European substantial policy measure towards accurate and transparent carbon dioxide quantification. Ocean. Yearb. Online 31 (1), 381–417. doi:10.1163/22116001-03101015
Galvo, J. R., Moreira, L., Gaspar, G., Vindeirinho, S., and Sergio, L. (2017). Energy system retrofit in a public services building. Manag. Environ. Qual. Int. J. 28 (3), 302–314. doi:10.1108/meq-02-2014-0028
Gately, C. K., and Hutyra, L. R. (2017). Large uncertainties in urban-scale carbon emissions. J. Geophys. Res. Atmos. 122 (20), 242–311. doi:10.1002/2017jd027359
Kadhim, W. (2019). Case study of dubai as a smart city. Int. J. Comput. Appl. 178 (40), 35–37. doi:10.5120/ijca2019919291
Kuhlmann, G., Brunner, D., Broquet, G., and Meijer, Y. (2020). Quantifying CO<sub>2</sub> emissions of a city with the Copernicus Anthropogenic CO<sub>2</sub> Monitoring satellite mission. Atmos. Meas. Tech. 13 (12), 6733–6754. doi:10.5194/amt-13-6733-2020
Liu, Z., Hu, B., Huang, B., Lang, L., and Zhao, Y. (2020). Decision optimization of low-carbon dual-channel supply chain of auto parts based on smart city architecture. Complexity 2020 (5), 1–14. doi:10.1155/2020/2145951
Mohammed, H., and Miklas, S. (2019). Tracking the low carbon transition in the UK road transport sector using emissions monitoring framework. Int. J. Eng. Trends Technol. 67 (3), 90–95. doi:10.14445/22315381/ijett-v67i3p217
Nasser, N., Emad-ul-Haq, Q., Imran, M., Ali, A., Razzak, I., and Al-Helali, A. (2023). A smart healthcare framework for detection and monitoring of COVID-19 using IoT and cloud computing. Neural Comput. Applic 35, 13775–13789. doi:10.1007/s00521-021-06396-7
Olayinka, O. U., Paul, D., and Edem, E. N. (2021). Assessing Nigeria's progress toward monitoring and measuring of forest carbon in the context of REDD+. J. Environ. Sci. 10 (1), 337–348. doi:10.14196/sjes.v10i1.1609
Reuter, M., Buchwitz, M., Schneising, O., Krautwurst, S., Burrows, J. P., Richter, A., et al. (2019). Towards monitoring localized CO<sub>2</sub> emissions from space: Co-located regional CO<sub>2</sub> and NO<sub>2</sub> enhancements observed by the OCO-2 and S5P satellites. Atmos. Chem. Phys. 19 (14), 9371–9383. doi:10.5194/acp-19-9371-2019
Sun, D. J., Zhang, Y., Rui, X., and Zhang, Y. (2017a). Modeling carbon emissions from urban traffic system using mobile monitoring. Sci. Total Environ. 599-600, 944–951. doi:10.1016/j.scitotenv.2017.04.186
Sun, J., Zhang, Y., and Xue, R. (2017b). Formation mechanism of urban traffic carbon emissions based on mobile monitoring: Case study of shanghai. Zhongguo Gonglu Xuebao/China J. Highw. Transp. 30 (5), 122–131. http://zgglxb.chd.edu.cn/EN/Y2017/V30/I5/122
SunXueCheng, M. C. Y., Zhao, L., and Long, Z. (2021). Analyzing spatiotemporal daily travel source carbon emissions based on taxi trajectory data. IEEE Access 9 (99), 107012–107023. doi:10.1109/access.2021.3101409
Tamilarasu, P., Phd, S. R., Senthilkumar, M., Jaiganesh, K., and Logeswaran, (2020). A 7-level inverter with less number of switches for grid-tied PV applications. J. Adv. Res. Dyn. Control Syst. 12 (8), 409–416. doi:10.5373/jardcs/v12sp8/20202539
Vojtisek-Lom, M., Zardini, A. A., Pechout, M., Dittrich, L., Martini, G., Montigny, F., et al. (2020). A miniature Portable Emissions Measurement System (PEMS) for real-driving monitoring of motorcycles. Atmos. Meas. Tech. 13 (11), 5827–5843. doi:10.5194/amt-13-5827-2020
Chang-Ho, Y., Der-Fa, C., Yoau-Chau, J., and Chang, Y. F. (2021). A study of the construction of indicators for "IT-APP" principals technology leadership for industrial and vocational high school in taiwan. Am. J. Educ. Res. 9 (8), 555–558. doi:10.12691/education-9-8-14
Yuan, L., Thomas, R. A., and Zhou, L. (2017). Characterization of a mine fire using atmospheric monitoring system sensor data. Min. Eng. 69 (6), 57–62. doi:10.19150/me.7567
Keywords: carbon emission monitoring, digital management system, smart city, ant colony algorithm, online monitoring methods
Citation: Liu J and Zhang Z (2023) Integrated energy carbon emission monitoring and digital management system for smart cities. Front. Energy Res. 11:1221345. doi: 10.3389/fenrg.2023.1221345
Received: 12 May 2023; Accepted: 15 June 2023;
Published: 22 June 2023.
Edited by:
Amrit Mukherjee, University of South Bohemia in České Budějovice, CzechiaReviewed by:
Hongping Cao, University of Warsaw, PolandHaitao Yang, Beijing University of Technology, China
Copyright © 2023 Liu and Zhang. This is an open-access article distributed under the terms of the Creative Commons Attribution License (CC BY). The use, distribution or reproduction in other forums is permitted, provided the original author(s) and the copyright owner(s) are credited and that the original publication in this journal is cited, in accordance with accepted academic practice. No use, distribution or reproduction is permitted which does not comply with these terms.
*Correspondence: Jilu Liu, bGl1amxAend1LmVkdS5jbg==