 Jiyang Qiao
 Min Li2
95% of researchers rate our articles as excellent or good
Learn more about the work of our research integrity team to safeguard the quality of each article we publish.
Find out more
ORIGINAL RESEARCH article
Front. Energy Res. , 20 July 2023
Sec. Process and Energy Systems Engineering
Volume 11 - 2023 | https://doi.org/10.3389/fenrg.2023.1220751
This article is part of the Research Topic New Paths Towards Carbon-Neutral Future Energy Systems: Planning, Operation and Market Design View all 7 articles
The construction of a power system including renewable energy has become the direction of development for the power industry as a result of the “carbon peaking and carbon neutrality” targets. Yet because the electricity market (EM), carbon market (CM), and green certificate market (GCM) have traditionally operated independently, with little interaction among them. To explore the interaction and correlation among the three markets, this paper analyzes the trading patterns and mutual influencing factors of the EM, CM and GCM and proposes the optimal decision-making model of “carbon-electricity-certificate” integration of multiple markets based on the decision-making behavior of power producers in each market. Finally, the golden jackal optimization algorithm (GJO) is used to solve the problem under the condition of network security. The simulation results show that the integration of multiple markets is more conducive to promoting the consumption of renewable energy source (RES), and also verify the feasibility and effectiveness of GJO in solving the optimal decision-making problem of power producers in EM.
With the increasingly severe environmental problems, China is actively building a power system including renewable energy as the main body to help achieve the strategic goal of “carbon peaking and carbon neutrality”. Under the circumstance of new power system construction, the proportion of renewable energy connected to China’s power grid has rapidly increased. In order to promote the consumption of renewable energy power, China has successively implemented a fixed electricity price mechanism and Renewable Portfolio Standard (RPS) (Yang et al., 2021; Sun et al., 2022). In the GCM, the green certificate trading mechanism cooperates with the implementation of the RPS to promote the development of renewable energy power, making it possible for green electricity to be sold at a low price, and greatly promoting the consumption of green electricity. The convergence mechanism and development planning of the three markets are not well unified, which leads to the uncertain development prospects of the markets and the lack of coordination among them. In order to improve the efficiency and vitality of carbon trading market and green certificate trading market, the integration of the two markets and power wholesale market will become the future market development trend.
In recent years, there has been increasing research on CM and the development of renewable energy. (Xin-gang et al., 2022) used system dynamics to construct a long-term trading model under China’s Renewable Portfolio Standard (RPS). (Wang et al., 2022) proposed a comprehensive energy system optimization and scheduling model for a ladder-type carbon trading mechanism. (Sun and Nie, 2015) compared the effectiveness of Feed-in Tariff and RPS policies for promoting renewable energy electricity generation. Government regulation (Zhu, 2017), carbon quota prices, carbon quota allocation, and management (Yang et al., 2020) are all key factors affecting the normal operation of carbon emissions trading. Similarly, the GCM is also constrained by factors such as green certificate prices (Zhao et al., 2019), environmental factors, and market policies. The opening of the CM and the GCM is aimed at promoting the consumption of renewable energy electricity (Wang et al., 2014) and promoting low-carbon emission reduction (Radpour et al., 2021), but from the current trading environment, these three markets (CM, EM and GCM) operate in isolation from each other and have low interaction with other markets. The isolated operation of each market does not produce satisfactory results.
Currently, domestic and foreign scholars have also studied the coupling relationship between the CM, GCM, and EM, Among them, in the coupling research of the CM and the EM, (Liu and Jin, 2020), studied the mutual influence of EM, fossil fuel, and carbon emission trading prices. (Ding et al., 2020) studied the way to achieve clean energy transformation in the carbon-electricity joint market. As for the coupling research of the GCM and the EM, (An et al., 2019), established an oligopoly trading equilibrium model for the electricity market incorporating tradable green certificates. (Song et al., 2021) studied the impact of RPS on the trading of renewable electricity in multiple markets. But the research is mainly focused on the coupling of two markets, and there is little research on the impact of the deep integration of trading elements of the three markets on the main trading strategies.
The EU’s research on the coupling relationship and cohesion mechanism of the CM, GCM, and EM (Schusser and Jaraitė, 2018) can provide a reference for China. Many scholars have conducted extensive research on the interactions among the three markets. (Ju et al., 2016) constructed an optimization model for power system planning under carbon emission trading and renewable energy quota system. (Chen and Jiang, 2023) established a multi-market fusion model, but fixed carbon prices limited the scope of its research.
Research on network constraints in power systems is of great significance for ensuring the stable operation of power systems and developing reasonable system planning. Currently, there has been a considerable amount of research on network constraints in power systems. (Liu et al., 2023) investigated the peer-to-peer transaction model of multi-microgrids partitioned pricing under network constraints. (Zun et al., 2019) established a network model of the electric-gas-heat energy system for regional comprehensive energy systems and proposed a linearization method. At present, there are few researches on network constraints in multi-markets.
Based on the current research situation, most related studies lack the necessary description of the “carbon-electricity-certificate” market relationship, and most related studies do not include the network constraints and the spot market of carbon trading. Therefore, the main innovations of this paper are as follows.
a) Describe the operation modes of the three markets and their coupling relationship in detail;
b) Consider the trading model of thermal power companies in the spot trading of carbon market, and adopt a ladder carbon price higher than the current price level to better simulate the development trend in the future market;
c) Consider the network constraints and compare GJO algorithm with particle swarm optimization and improved particle swarm optimization in the simulation process of an example to illustrate the advantages of GJO algorithm in the power system simulation process.
The contributions of this paper can be summarized as follows.
a) The research explains the interaction among the GCM, CM, and EM, and constructs a decision optimization model for power producers considering the integration of multiple markets from the perspective of maximizing overall producer interests.
b) The consideration of high-level ladder-type carbon trading price instead of fixed carbon prices helps power producers to formulate trading strategies in the future event of carbon price increases.
c) Through the exploration of the “carbon-electricity-green certificate” trading model, the paper provides strategy for members in the three markets on how to maximize their benefits under the circumstance of the continuous improvement of renewable energy under the condition of network security.
The remainder of this paper is organized as follows. In Section 2, the paper proposes the transaction modes of the EM, CM, and GCM. In Section 3, the market framework for the “carbon-electricity-green certificate” is designed. In Section 4, “carbon-electricity-certificate” market trading model are constructed. In Section 5, GJO is used to solve the optimal decision-making model of power producers in the “carbon-electricity-green certificate” multi-market integration. In Section 6, the market competition under different quota ratios and carbon prices is analyzed through a case-study. Section 7 is the discussion and limitation. Finally, Section 8 provides a summary of the entire paper.
In China, the allocation of carbon quotas mainly includes free allocation and paid allocation. Under the free allocation, enterprises obtain carbon quotas without paying any fees, while under the paid allocation, enterprises need to purchase carbon quotas through auctions or fixed prices. The historical total amount method, the historical intensity method, and the reference line method are three main methods for the free allocation of carbon allowances. The administration of China’s carbon quota allocation technique is getting better and better, and it has switched from the mixed use of numerous approaches to the reference line method, learning from the development experience of European and American countries. This paper will discuss the reference line method as the quota allocation method. The reference line method, refers to the use of carbon emissions intensity of the products produced within the scope of carbon quota management as the benchmark, and uses this as a reference indicator for carbon quota allocation. Specifically, the carbon emissions per unit of the same product among different enterprises within the carbon quota management scope are arranged in ascending order, and the top 20% of the products are selected as the product benchmark (20% is a hypothetical data). The carbon quota obtained by an enterprise is equal to the product output multiplied by the product benchmark value.
Companies that produce thermal power are subject to more complicated economic effects because they must balance the demands of the EM and the CM. The government can determine the annual pre-allocated carbon quota of thermal power producers (TPP) using the reference line method. To acquire a single-day carbon quota threshold, which serves as a benchmark for single-day EM and CM transactions, TPP typically distribute it to each day. In the EM trading stage, TPP predict the rise and fall of carbon prices based on historical single-day carbon prices, and combine the cost of TPPs’ carbon emission units, coal consumption costs, and risk preferences to declare power bidding information. After the market organization releases the clearing price and unit winning bid, the TPP calculates the single-day carbon emission, compares it with the single-day carbon emission threshold to obtain the difference, and then determines the single-day carbon quota trading decision based on its own marginal cost. In the CM trading stage, the CM conducts paired clearing for buyers and sellers under constraints, and obtains the single-day carbon allowance clearing amount and clearing price, which are recorded in historical data.
At present, EM transactions mainly include “medium and long-term” transactions and spot transactions. The enterprises that mainly provide electricity services are power generation enterprises and electricity sales enterprises. Through the power forward contract, the forward market exchanges a specific quantity of electricity for a specific amount of time in the future at a price that is satisfactory to both sides. The influence of uncertainty on transaction prices in the real market is eliminated by the ahead electricity market, which supports the equilibrium market electricity price. According to the time dimension, spot trading can be separated into day-ahead market, intraday market, and real-time market. Each market participant submits quotations and demands in the day-ahead market based on variables such as their own costs and price forecasts/purchase volume and factors announced by the market operations department after the market operation department announces the market transaction-related information and rules the day before the transaction. To match transaction objects, facilitate transactions, supervise and limit both parties to complete power supply and settlement within the allotted time, the marketing department will use the outcomes of the bidding process and market rules.
After the day-ahead market closes, the intraday market adjusts the power generation and consumption schedule to account for forecast errors and unforeseen circumstances. The real-time market establishes the real-time clearing price and quantity of each unit in a shorter time by using centralized bidding or a real-time balancing mechanism. Although the pricing in the spot market is more volatile and carries higher market risk than the forward market, it can more accurately reflect the market’s supply and demand dynamics. In addition to addressing the various transaction requirements of power producers, the joint operation of the two market transaction modes promotes the stability and long-term operation of the EM.
In order to effectively solve the problem of lack of government subsidies, China learned from the development experience of European and American countries and officially began to implement the green certificate system in 2017 and implemented it in the form of voluntary subscription. The green certificate system was initially designed as a means to help alleviate the government’s subsidy shortfall for renewable energy by providing income from the sale of certificates. The system also aimed to develop the domestic market for green electricity consumption and was later linked to the responsibility of accommodating renewable power generation. With the improvement of the GCM system and policies, the scope of issuance of green certificates has been gradually expanded to cover all renewable energy power generation projects according to the standard of 1 MW h of settlement electricity per certificate. Renewable power producers participate in electricity market transactions by selling their electricity at market prices and obtaining the corresponding number of green certificates. These green certificates can be sold for additional revenue through various channels, such as listing or offline bilateral transactions, in the green certificate market. However, once the green certificates are sold, the corresponding electricity will no longer receive government funding subsidies and cannot be traded again. The RPS clarifies the renewable energy consumption responsibility of local governments and market entities, thereby promoting the utilization of renewable energy generation.
Currently, although China’s green certificate market is still in its early stages, China adopts a RPS and a green certificate system in parallel to stimulate the consumption and development of renewable energy in order to strengthen the connection mechanism between the green certificate system and the EM. There are two main types of transactions in the market, namely, “certificate-electricity unification” and “certificate-electricity separation”. In the " certificate-electricity unification " mode, buyers of green electricity make a power contract purchase and then actually use a certain amount of green electricity, whereas in the " certificate-electricity separation " mode, green electricity has been traded on the EM and buyers serve as a proof of nominal consumption of green electricity. The performance of the GCM is typical “certificate and electricity integration” under the medium and long-term green electricity agreement, which is advantageous to the overall planning and scheduling of production activities. The “certificate-electricity separation” mode separates the environmental value of green electricity from the EM, enhances transaction flexibility, ensures stable connection between the GCM and the EM, and effectively improves the liquidity of the GCM.
CM and GCM can promote the consumption of RES to a certain extent. However, at present, the operation effect of a single market is very little, and the links among the markets are weak. In order to improve the links among the markets and promote the consumption of RES, a multi-market joint transaction model of “carbon-electricity-certificate” has been built.
Through market mechanisms, the “carbon-electricity-green certificate” market influences market participants’ choices and interacts with supply-demand dynamics and power market prices. The coupling relationship is depicted as Figure 1.
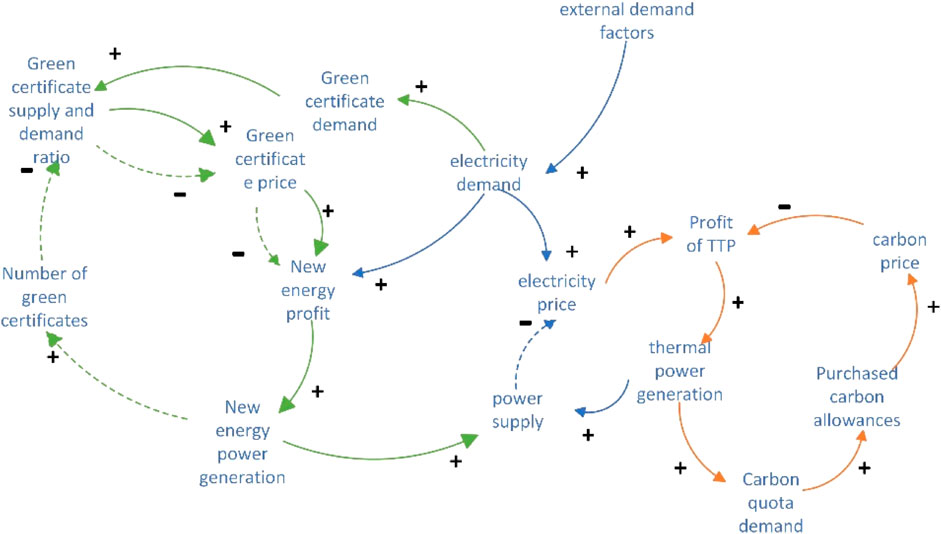
FIGURE 1. “Carbon-electricity-green certificate” market interaction.
When external demand changes and leads to an increase in electricity demand. In the CM, as the electricity price rises, the profit margin of TPPs increases, and TPPs will increase the supply of electricity, which will cause the electricity price to fall; at the same time, as the demand for carbon quotas increases, the price of carbon quotas in the market rises, thereby reducing the profit margin of TPP and causing them to abandon part of their market share to maintain dynamic stability. For the GCM, when the electricity price rises, the demand for green certificates by TPPs increases, and the price of green certificates rises. The profit margin of renewable energy power companies increases, which makes renewable energy companies increase their investment, resulting in an increase in power generation and a decrease in the supply-demand ratio of green certificates. This promotes a rebound in electricity prices and a reduction in profit margins.
In CM, the size of the carbon cost varies with power generator output, influencing power generator decision-making in EM. Because of the carbon quota system’s implementation, when TPP reach a certain share, the carbon cost will gradually increase with the amount of power generation, so TPP can only obtain the best market returns by giving up a portion of the power generation share. At this moment, renewable power generation company can occupy the part of power generation given up by TPP, enhance the proportion of green electricity, and promote the increase in the proportion of renewable energy in the grid to a certain extent.
In GCM, power generators buy or sell green certificates based on their electricity output in order to cover the cost of green certificates or obtain revenue from them. Due to the existence of RPS, all thermal power generators are required to consume a certain quota percentage K of green electricity. Traditional TPP can meet the requirements of RPS by purchasing a specified number of green certificates. Therefore, in the GCM, green power producer s act as sellers and can adjust green certificate prices by controlling the quantity of certificates; TPPs, as purchasers, can adjust their output according to the price of green certificates to achieve the best possible profit. To encourage the use of green power, a portion of the profits is passed to green power suppliers. The Cournot model (Hobbs and Pang, 2007) is used in the power market to compete for market output by generators. Because TPP have lower unit power generation costs, thermal power has a considerable advantage in the EM consumption process.
Because each power generation company’s final contribution affects its income and costs in the CM, GCM, and EM all at the same time, the three markets are linked for decision-making so that the power generation company’s income can be optimized. Figure 2 depicts the participation of power generation companies in various market transactions.
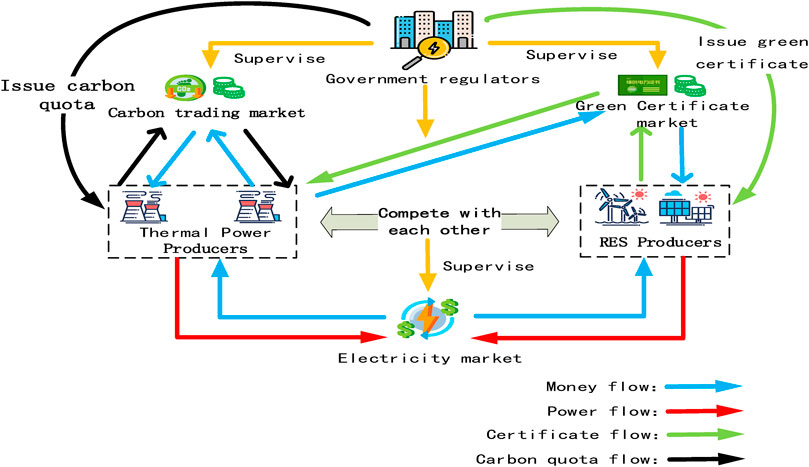
FIGURE 2. Trading block diagram of the “carbon-electricity-certificate” markets.
In the electricity wholesale market, TPPs and green power producers declare their power outputs to determine the electricity market price. TPPs must pay a set amount of carbon cost and green certificate cost under the limits of the carbon quota system and the RPS, and the size of the carbon cost and green certificate cost is decided by the quantity of their own output. When TPPs cut their output in EM, green power producers raise their output to occupy this part of the market share. At the same time, green power producers will also control the number of green certificates to affect the price of green certificates in the GCM, thereby affecting TPP decision-making in EM. It can be observed that power generators’ decisions in the carbon and GCM will influence their decisions in the EM, demonstrating that the three markets are inextricably linked and affect each other. The government departments supervise and oversee the market transactions in the electricity wholesale market. The government will also play a role in the CM by granting free quotas. Before the transaction, it will issue free quotas to various power generators according to different policies and will also approve the current basic carbon price according to the market transaction situation and policy requirements. Meanwhile, supervise all power generators to complete the task of carbon quotas and punish power generators that fail to fulfill the target. In GEM, the government department plays a similar role in issuing green certificates to renewable energy generators, supervising all power generators to fulfill their quota obligations, and penalizing those who fail to meet their targets.
Under the call of carbon emission reduction, the government forced high-carbon enterprises to reduce emissions by issuing free carbon emission quotas. In the power industry, the main carbon source of carbon emissions come from TPP. Therefore, TPP can sell or purchase certain carbon emission rights according to the carbon emissions generated by their own power generation. For TPP with good emission reduction effects, they can obtain profits by selling excess carbon emission rights in the carbon trading market. In order to simplify the analysis, this paper uses the reference line method (Li and Wang, 2019) to determine the free carbon emission quota of power producers.
a) The total amount of carbon emission quotas for TTP.
where
In the spot market, the total power generation days of TTP
Where
b) When designing and developing the total carbon emission model of electric power enterprises, in order to better integrate the carbon-electricity market, the fixed unit carbon emission system model (Duan et al., 2021) (that is, the number of rows is linearly related to electricity), and the two Sub-function form (Yang et al., 2022), that is, more and more power generation, the total carbon emissions are getting higher and higher.
where
c) Transaction cost model of carbon emission rights.
In order to better stimulate the participation of fire and electricity companies in emission reduction, this paper adopts a ladder-type carbon trading mechanism (Guo et al., 2023). The model is shown in Eq. 4.
where
Due to the existence of the RPS policy, green power producers can sell excess green power in the form of “certificate-electricity separation” on the green certificate trading market to obtain additional income. To meet the requirements of the RPS, TPPs must purchase the specified number of green certificates. Assuming that 1 unit of green certificate represents the production of 1 MW h of green electricity, this paper considers only wind and photovoltaic power as green electricity based on the actual development of renewable energy in China, without considering the differences in the exchange of green certificates for different green energy technologies. Therefore, the cost for thermal power generation enterprises to purchase green certificates in the green certificate market is shown in Formula (5).
where
The revenue from green certificate sales by green power producers in GCM
where
In GCM, the income of green power producers is determined by the price and quantity of green certificates, while the price of green certificates is determined by the number of green certificates, and the number of green certificates is determined by the power generation of green power producers. The income in the GCM is completely determined by the contribution of green power producers. If the green power producer increases its output in the EM, its green certificate price in the GCM will decrease, which in turn will reduce the cost of TPP in the GCM and stimulate them to increase their output. As coal power companies have lower marginal costs in the electricity market, they will be the first to be dispatched. When coal power companies increase their output, they will compete with green power companies in the certificate market, which reduces the revenue of green power companies in the electricity market and leads to a reduction in their output. This then causes the price of green certificates to increase in the certificate market, increasing the revenue of green power companies. However, the increase in the price of green certificates will also reduce the revenue of coal power companies, which would then have to reduce their output to minimize their losses, ultimately reaching a dynamic equilibrium.
Therefore, when the TPPs’ marginal cost in the GCM equals its marginal revenue in the EM, the TPPs’ decision-making in the GCM and the EM is optimal, and profit is maximized. Since green electricity suppliers will benefit in both markets, and only receive profits without costs in the GCM, the green power generators can achieve the optimal decision and maximize their profits in both markets only when the marginal cost of their electricity generation equals the sum of the marginal revenue in the green certificate market and the electricity market. The market equilibrium model is as follows.
The GCM constraints are as follows.
When the demand for green certificates exceeds the supply of green certificates, in order to punish TPPs for excess power generation, the excess demand for green certificates of TPPs is calculated at the highest price of green certificates. It is shown in Formula (9).
where
In the electricity wholesale market, all power producers participate in the market competition in the form of Cournot model, and the market price is the inverse demand function of the market demand, which is shown in (10).
where
When each power producer only trades in EM, its income is the income from selling electricity minus the cost of generating electricity. The TPP
where
Although renewable energy power generation has no cost of fuel consumption, it requires more operation and maintenance costs due to the instability of power generation. According to (An et al., 2019), renewable energy generator also has the following quadratic cost function.
where
In EM, the income of each power producer is as follows.
It can be seen from the above formula that when the power generator only participates in the power market competition, its income is the power sales income of the power generator minus the cost of power generation. Among them, the electricity price will change with the change of the total output. Since the unit power generation cost of the TPP is relatively small, in the face of market competition, it has the right to have priority. The green power business needs to adjust its output according to market demand and the cost of power generation. When it is equal to the marginal income, the power generation company achieves optimal decision-making in the market and maximizes the income. The power supply and demand balance constraint in the power market is in (15).
The output constraints of each power producer are follows.
where
Considering the costs and benefits of CM transactions, GCM transactions and EM transactions, the profits of each power generation company are as follows.
a) The profit of the TPP is the income from electricity sales minus the cost of power generation, carbon cost and the cost of purchasing green certificates in the GCM. The profit function is shown in Formula (22).
b) Similarly, the profit of green electricity suppliers is the income from selling electricity in the electricity wholesale market plus the income from selling green certificates in the GCM, and then subtracting the cost of power generation. Since green electricity does not generate carbon emissions, green electricity manufacturers do not participate in CM transactions, that is, there is no carbon emission cost and no carbon income, then its profit function is shown in Formula (23).
In order to rationally allocate the power generation resources in the region, take the maximization of the total revenue of the power generation companies as the objective function to solve the optimal output of each power generation company, then the objective function of the optimal decision-making model of the power generation companies considering the “carbon-electricity-certificates” multi-market transaction is as follows.
Among them, the constraint of the objective function is the decision constraint of power generation companies in various markets.
Studying the combined effects of multiple components on various types of power grid overloads is key to the long-term stable operation of the power grid. The following takes into account the contract or transaction’s line or section limit violation, as well as other variables. For instance, the following line
where
According to the sensitivity analysis matrix (power transfer distribution factor matrix), the contribution of all contracts/transactions
where
This paper adopts GJO to solve the model. GJO was proposed by two scholars, Nitish Chopra and Muhammad Mohsin Ansari (Nitish and Muhammad, 2022) in 2022. The algorithm simulates the behavior characteristics of male jackal leading and female jackal following when the golden jackal is hunting, making the algorithm more rapid and efficient. GJO consists of two stages: survey and siege of prey. The survey stage is to lock the best prey position. The siege stage is to capture prey. When the algorithm is running, the male jackal and the female jackal hunt together, which can capture prey more stably and quickly, that is, can obtain the optimal solution faster and more accurately. The procedure flow is shown in Figure 3.
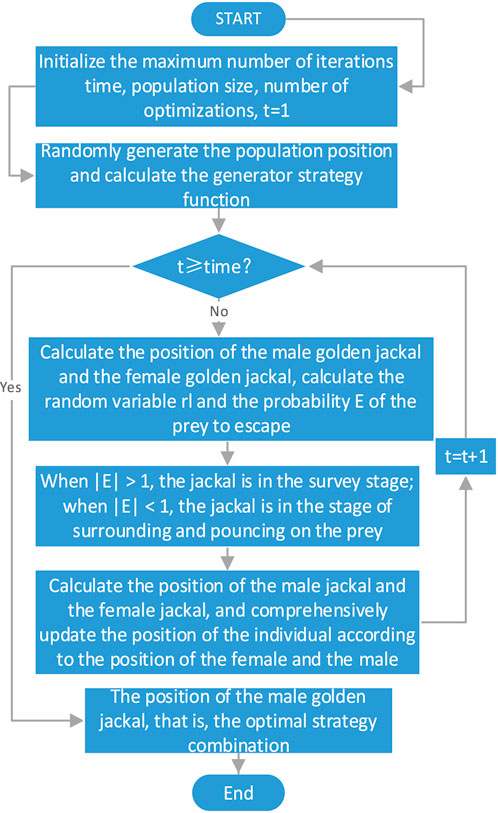
FIGURE 3. Flow chart of golden jackal optimization algorithm.
The algorithm steps are as follows.
a) Initialize population size and maximum number of iterations
b) Randomly generate the positions (
c) Calculate
d) Update the prey’s escape energy
e) When |E|>1, the jackal is in the survey stage, use
f) Repeat steps 3 to 5 until the maximum number of iterations is reached.
g) Output the position of the golden jackal, that is, the optimal strategy combination of the generator.
The simulation in this paper considers the standard IEEE 30-bus system, as shown in Figure 4.
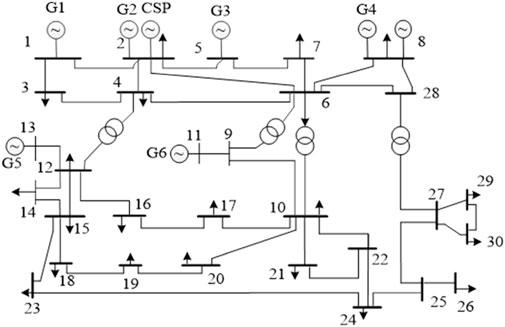
FIGURE 4. IEEE 30-bus system.
This paper assumes that there are 6 power producers participating in the market competition, including 4 TPP (G1, G2, G3, G4) and 2 RES producers (G5, G6). The parameters of each generator are shown in Appendix A1, and other data are shown in Appendix A2 and Appendix A3. Set the number of GJO population to 100, and the maximum number of iterations to 100.
This section simulates the decision of power producers when the quota ratio K = 0.2 and the carbon price. The output of each power producer in the optimization process is shown in Figure 5, and the income of each power producer is shown in Figure 6. It can be seen from the data in Figure 5 and Figure 6 that G1 (204MW, 8451$) TPP have a smaller output cost coefficient, so G1 can have more share of electricity sales in EM; However, G2 (154MW, 5735$), G3 (72MW, 2700$) and G4 (53MW, 1857$) TPP, due to cost constraints, are unable to have too much share of electricity sales, with less output and income; Although the output cost of RES producers G5 (118MW, 4144$) and G6 (89MW, 3357$) is higher than that of all TPP, because there is no cost of carbon emissions, and they have the income from selling green certificates, the share and income of RES producers will exceed that of G3 and G4, but under the current quota ratio and carbon price, the output of G1 and G2 power producers will still account for more.
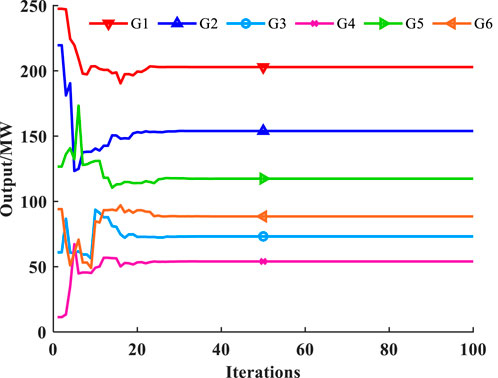
FIGURE 5. The output of each power producer in the optimization process when K = 0.2 and
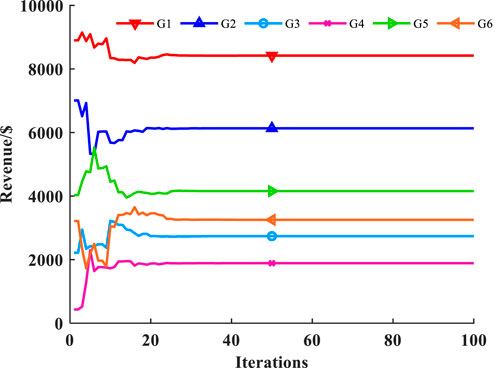
FIGURE 6. The revenue of each power producer in the optimization process when K = 0.2 and
In order to explore the impact of CM and GCM on the decisions of power producers in EM, four different scenarios are set up for comparative analysis. Scenario 1 does not consider the carbon cost and green certificate cost, Scenario 2 only considers the carbon cost, Scenario 3 only considers the green certificate cost and Scenario 4 only considers the carbon price is 20, and the quota ratio is 0.2. Output and income of all power producers. The data is shown in Table 1.
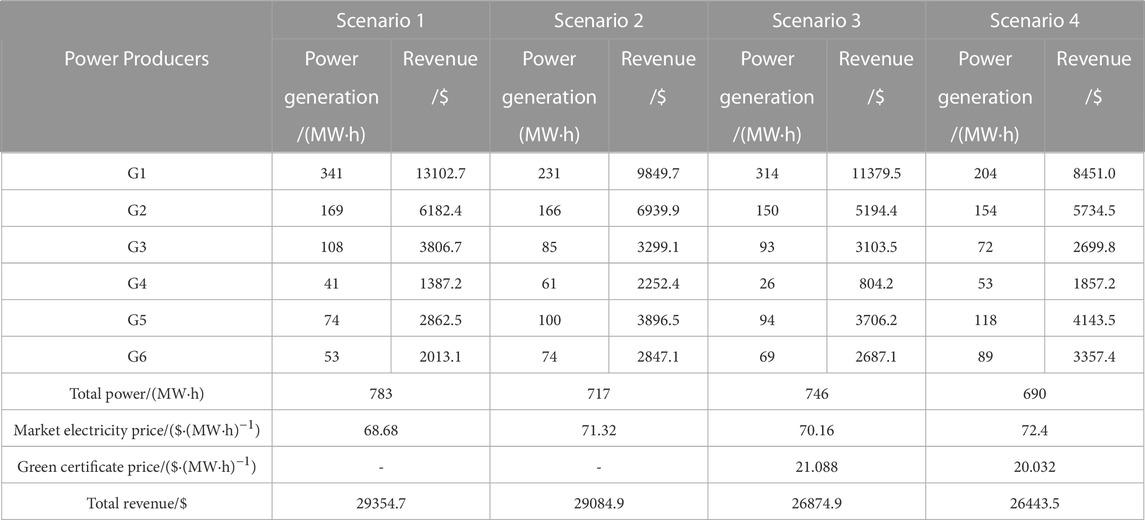
TABLE 1. Output and revenue of each power producer under different scenarios.
The results show that the interaction of the three markets has reduced the revenue of TPP, forced some of the revenue to be transferred to RES producers, thus promoting the consumption and development of RES, and promoting the market to attract more and more RES producers, gradually increasing the proportion of RES, and promoting the construction of new power systems.
Therefore, under the interaction of the three markets, the implementation of carbon trading and RPS enables green power to occupy more market share in the electricity wholesale market more quickly, thus achieving the goal of promoting the consumption of RES. In the new power system in the future, the access of a high proportion of RES to the grid will increase the RES quota ratio, which limits the output of TPP in the power market. Therefore, increasing the quota ratio and strengthening the construction of GCM can more promote the consumption of a high proportion of RES in the new power system.
In order to further explore the carbon price in the CM and the degree of influence of the renewable energy quota ratio in the GCM on the market, this section discusses the impact of different carbon prices and quota ratios on the electricity market when the carbon price is between 10 and 40 USD/ton, and the renewable energy quota ratio is between 0.1 and 0.4. Power generation companies G1 and G5 are selected as representatives to analyze their output and revenue under different scenarios.
Figure 7 demonstrates that the larger the quota ratio, the greater the impact on the power generation companies. With an increase in the quota ratio, the output of G1 TPP decreases while the output of G5 green power producers increases. This indicates that in the case of a high quota ratio, TPP would be required to buy more green certificates in GCM, which would reduce their revenue and force them to reduce its output to reduce the cost of green certificates; On the contrary, as the quota ratio increases, although the amount of green certificates that can be sold by the green power generation company decreases, due to the reduction in the output of TPP, the market share of the EM will be correspondingly be given up, allowing the green power companies to occupy this part of the market, increase their own output and the amount of green certificates that can be sold, and obtain more benefits.
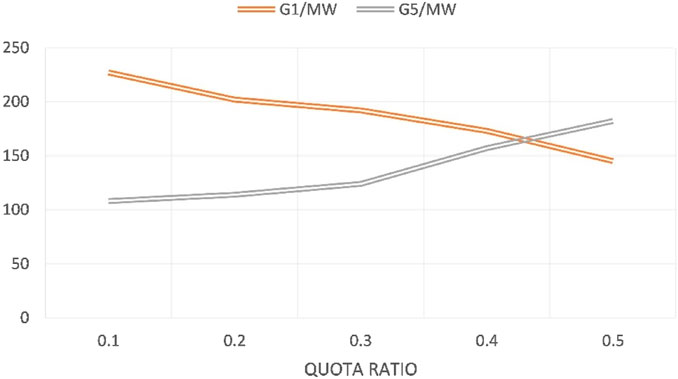
FIGURE 7. The output of each power producer in the optimization process when K = 0.2 and
Based on the analysis in Figure 7, it can be concluded that an increase in carbon prices will cause TPP to reduce their output to repay the increase in carbon costs. However, because carbon costs have no effect on green e-commerce, when the total output of the CM declines, it will correspondingly increase its output to obtain more profits.
Therefore, under the interaction of the three markets, with the increase of quota ratio and carbon price, green power can occupy more market share in the electricity wholesale market more quickly, thereby promoting the consumption of renewable energy. In the new power system in the future, the high proportion of renewable energy entering the grid will increase the quota ratio of renewable energy, which will limit the contribution of TPP in the power market. Therefore, increasing the quota ratio and strengthening the construction of the GCM will be more. It can promote the consumption of a high proportion of renewable energy in the new power system.
To validate the superiority of the golden jackal optimization technique utilized in this paper, the market equilibrium model is solved using the standard Particle Swarm Optimization (PSO) and the improved Particle Swarm Optimization algorithm. Based on the principle of controlling variables, the population size of the three algorithms is set to 20, and the maximum number of iterations is 50 generations. The optimal convergence circumstances are compared after executing the above three algorithms numerous times, as illustrated in Figure 8. The improved Particle Swarm Optimization algorithm hopes to advance the global search, so that the search area quickly approaches a small range, and then uses local search to obtain a higher precision solution, so the weight factor w is proposed, and the inertia weight w is set to a linear decreasing form, in the early stage of search, w is higher, improve the global search ability of particles, with the increase of the number of searches, w gradually decreases, and the local search ability increases, which can avoid falling into local convergence and improve convergence speed; The learning factors c1 and c2 indicate that the next action comes from its own experience and the weight of other particle experience, respectively, pushing the particle to the optimal position of the individual and the optimal position of the group. Adaptive improvement of c1 and c2 obtains adaptive acceleration coefficient:
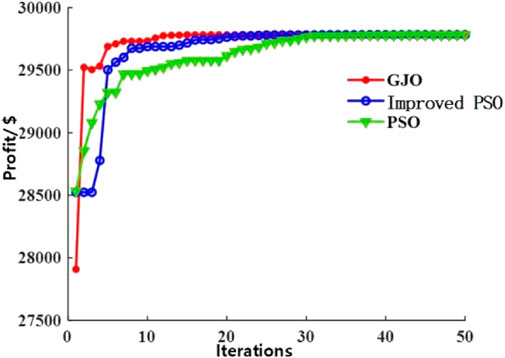
FIGURE 8. Comparison of the advantages and disadvantages of different algorithms.
According to the data in Figure 8, the three algorithms have equivalent accuracy and can converge to a stable value in terms of algorithm accuracy; in terms of optimization times, GJO demonstrates its rapid and efficient benefits. Convergence has already begun in the tenth generation, while the standard PSO requires completion in the 30th generation. The improved PSO algorithm’s convergence speed is expedited due to improvements in the adaptive learning factor and the algorithm’s weight factor, but it still takes roughly 20th generations to converge, which is slower than the convergence pace of GJO. In addition, Particle Swarm Optimization and improved Particle Swarm Optimization have relatively high requirements for the initial value, and once the initial value changes randomly, the convergence result of multiple times may not be the same optimal solution, and an invalid solution may also be obtained. As a result of the above study, it can be concluded that the GJO algorithm used in this paper can not only be well adapted to the equilibrium solution of the electrical market, but also be faster and more efficient while maintaining the same accuracy.
In order to speed up the construction of new energy-based power system, China has successively built a carbon market and a green certificate market nationwide. However, from the current trading situation, the development of the carbon market and the green certificate market is not satisfactory. Therefore, it is urgent to build a carbon-electricity-certificate market. In this paper, the market framework of carbon-electricity-certificate is designed, and the optimal decision of e-commerce under multi-market integration and network constraints is analyzed and simulated by GJO algorithm, which contributes to the discussion and related research of multi-market integration in the future. (Chen and Jiang, 2023). adopted a fixed carbon price, which limited the research scope. (Xue et al., 2018). did not introduce the coupling and interaction in the three markets in detail. Our research analyzes the independent operation mode of the three markets, provides a clear coupling relationship in the integrated market and builds a trading model of the three markets based on the ladder carbon price. A key discovery is that with the increase of quota ratio and carbon price, green electricity companies will occupy more and more market share (Figures 7, 9), so as to promote the consumption of renewable energy and promote the integration and development of multiple markets. This result shows that increasing the carbon price and enterprise quota ratio in the future market will become one of the means for the government to promote the development of new energy, and power producers and green e-commerce companies should also be prepared for this. In addition, this study confirms the rapidity and efficiency of GJO algorithm in solving the electricity market equilibrium, and provides a new way for related research and market participants to solve the market equilibrium model. It should be pointed out that this paper does not consider the decision-making of power companies in the integrated market. However, the role of user companies in the electricity market cannot be ignored.
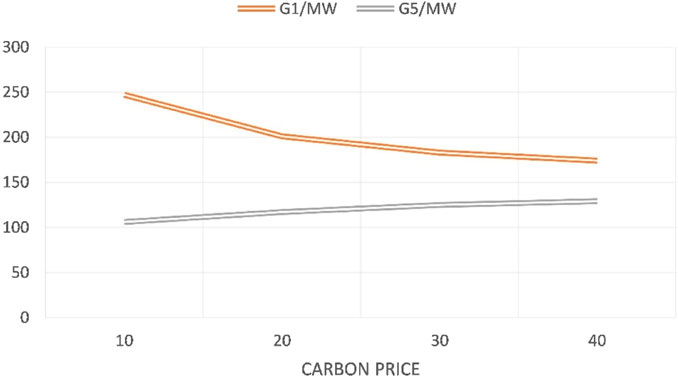
FIGURE 9. The output of power producers G1 and G5 at different carbon price when K = 0.2.
In this paper, when discussing and studying the interaction relationship and information interaction between CM, GCM and EM, this paper mainly adopts the analytical method, mainly using formulas to show the interaction relationship between the three markets, such as the coordination between TPP and green e-commerce in the EM on the impact of electricity prices. In the integrated multi-market system we designed, the combination of the three markets will be closer and have more information interaction processes, and the requirements for communication technology and model building will become higher in this process. More and more new information and communication technologies have emerged to assist the design and operation of future smart energy systems (Zhao et al., 2023), including artificial intelligence, quantum computing, blockchain and other technologies that are developing rapidly. At the same time, new model-building methods (Górski, 2023), such as integration flows modeling, will also play an important role in helping the development and advancement of future power systems. Therefore, we believe that research on new information and communication technologies and messaging flows models will be more important in related research.
This article constructs an optimal decision-making model for power generation companies considering the integrated trading of “carbon-electricity-certificates” in multiple markets. It can be used to analyze the changes in power generation and revenue of power generation companies under different combinations of carbon prices and quota ratios in the interaction of the three markets. Through numerical simulation analysis of the model on the IEEE 30 system nodes, the findings of this article are as follows.
1) In CM, GCM, and EM, compared to single or dual trading markets, green power generators have higher profits and are better able to promote the consumption of renewable energy electricity under the integration of three trading markets.
2) This article sets a carbon price level higher than the current level of the national unified CM, which can better predict the impact on the electricity wholesale market in the future when the carbon price increases as the CM develops.
3) Raising the carbon price level and quota ratio will force thermal power generators to give up a portion of their market share and profits to renewable energy generators, while the profits of renewable energy generators will increase with the increase of carbon price and quota ratio.
4) With the development of renewable, the increase of carbon price level and the rise of quota ratio, more and more RES producers have entered the market and occupied the share of EM, so as to promote the consumption of high proportion of RES in the new power system.
5) This paper applies the golden jackal optimization algorithm to the equilibrium solution of the EM. The results demonstrate that the golden jackal optimization algorithm is fast and efficient, and it also demonstrate that the golden jackal optimization technique may be used to solve the power market’s equilibrium problem.
More consumption of renewable energy power will become increasingly significant in the future power systems, and enhancing the connection between the three trading markets will be critical to encouraging green power consumption. It should be noted that this article does not consider the decision-making of electricity consumers participating in the CM and the GCM. However, in the EM, CM, and GCM, the participation of electricity consumers will play an important role; thus, the consumes’ decision-making in the three markets will be the future research.
The original contributions presented in the study are included in the article/Supplementary material, further inquiries can be directed to the corresponding author.
JQ, JL, YL, and YY design and perform the research. ML, YS, and YL collect the data. JQ, JL, and YL were responsible for writing and result. All authors contributed to the article and approved the submitted version.
This research is supported by the Science and Technology Project managed by State Grid Corporation Headquarters of China (Named Quantitative Analysis of the Electricity Spot Market Clearing Results Causes and the Technology of Tracing the Constraints Effectiveness Grant No. 5108-202326039A-1-1-ZN).
ML, YL, and YS were employed by the State Grid Sichuan Electric Power Company.
The remaining authors declare that the research was conducted in the absence of any commercial or financial relationships that could be construed as a potential conflict of interest.
All claims expressed in this article are solely those of the authors and do not necessarily represent those of their affiliated organizations, or those of the publisher, the editors and the reviewers. Any product that may be evaluated in this article, or claim that may be made by its manufacturer, is not guaranteed or endorsed by the publisher.
An, X., Zhang, S., Li, X., and Du, D. (2019). Two-stage joint equilibrium model of electricity market with tradable green certificates. Trans. Inst. Meas. Control41 (6), 1615–1626. doi:10.1177/0142331217718619
Chen, W., and Jiang, Y. (2023). Trading optimization of carbon-green certificate-electricity market coupling. Power Syst. Technol.47 (6), 2273–2287. doi:10.13335/j.1000-3673.pst.2022.1793
Ding, T., Lu, R., Xu, Y., Yang, Q., Zhou, Y., Zhang, Y., et al. (2020). Joint electricity and carbon market for Northeast Asia energy interconnection. Glob. Energy Interconnect.3 (2), 99–110. doi:10.1016/j.gloei.2020.05.002
Duan, S., Chen, H., Xiao, D., Huang, J., Zheng, X., and Deng, S. (2021). Analysis of electricity market equilibrium considering carbon emission mechanism. Int. Conf. Power Syst. Technol. (POWERCON), 625–629. doi:10.1109/POWERCON53785.2021.9697475
Górski, T. (2023). Integration flows modeling in the context of architectural views. IEEE Access11, 35220–35231. doi:10.1109/ACCESS.2023.3265210
Guo, W., Wang, Q., Liu, H., and Atchike, D. W. (2023). Multi-energy collaborative optimization of park integrated energy system considering carbon emission and demand response. Energy Rep.9, 3683–3694. doi:10.1016/J.EGYR.2023.02.051
Hobbs, B. F., and Pang, J. S. (2007). Nash-cournot equilibria in electric power markets with piecewise linear demand functions and joint constraints. Operations Res.55 (1), 113–127. doi:10.1287/opre.1060.0342
Ju, L., Tan, Z., Li, H., Tan, Q., Zhang, X., and Zhang, W. (2016). The optimization model for interregional power system planning considering carbon emissions trading and renewable energy quota mechanism. Discrete Dyn. Nat. Soc.2016 (3), 1–15. doi:10.1155/2016/8784624
Li, M., and Wang, P. (2019). Research on carbon emission quota allocation in power industry. IOP Conf. Ser. Earth Environ. Sci.300 (4), 042069. doi:10.1088/1755-1315/300/4/042069
Liu, X., Chen, X., Jin, T., Liu, Z., Liu, Y., Su, M., et al. (2023). Network-Constrained Peer-to-Peer energy trading for multiple microgrids considering zoning pricing. Int. J. Electr. power energy Syst.147, 108837. doi:10.1016/J.IJEPES.2022.108837
Liu, X., and Jin, Z. (2020). An analysis of the interactions between electricity, fossil fuel and carbon market prices in Guangdong, China. Energy Sustain. Dev.55, 82–94. doi:10.1016/j.esd.2020.01.008
Nitish, C., and Muhammad, M. A. (2022). Golden jackal optimization: A novel nature-inspired optimizer for engineering applications. Expert Syst. Appl.198, 116924. doi:10.1016/j.eswa.2022.116924
Radpour, S., Gemechu, E., Ahiduzzaman, M., and Kumar, A. (2021). Developing a framework to assess the long-term adoption of renewable energy technologies in the electric power sector: The effects of carbon price and economic incentives. Renew. Sustain. energy Rev.152, 111663. doi:10.1016/j.rser.2021.111663
Schusser, S., and Jaraitė, J. (2018). Explaining the interplay of three markets: Green certificates, carbon emissions and electricity. Energy Econ.71, 1–13. doi:10.1016/j.eneco.2018.01.012
Song, X-H., Han, J-J., Zhang, L., Zhao, C-P., Wang, P., Liu, X-Y., et al. (2021). Impacts of renewable portfolio standards on multi-market coupling trading of renewable energy in China: A scenario-based system dynamics model. Energy Policy159, 112647. doi:10.1016/j.enpol.2021.112647
Sun, J., Zhou, P., and Wen, W. (2022). Assessing the regional adaptive capacity to renewable portfolio standard policy in China. Energy Policy162, 112798. doi:10.1016/j.enpol.2022.112798
Sun, P., and Nie, P-Y. (2015). A comparative study of feed-in tariff and renewable portfolio standard policy in renewable energy industry. Renew. energy74, 255–262. doi:10.1016/j.renene.2014.08.027
Wang, L., Dong, H., Lin, J., and Zeng, M. (2022). Multi-objective optimal scheduling model with IGDT method of integrated energy system considering ladder-type carbon trading mechanism. Int. J. Electr. power energy Syst.143, 108386. doi:10.1016/j.ijepes.2022.108386
Wang, T., Gong, Y., and Jiang, C. (2014). A review on promoting share of renewable energy by green-trading mechanisms in power system. Renew. Sustain. energy Rev.40, 923–929. doi:10.1016/j.rser.2014.08.011
Xin-Gang, Z., Lei, X., and Ying, Z. (2022). How to promote the effective implementation of China's Renewable Portfolio Standards considering non-neutral technology?Energy238 (1), 121748. doi:10.1016/j.energy.2021.121748
Xue, Y., Zhao, S., Zhang, X., Chen, J., and Liu, S. (2018). TXNIP mediated the oxidative stress response in glomerular mesangial cells partially through AMPK pathway. J. taiyuan Univ. techology49 (5), 785–792. doi:10.1016/j.biopha.2018.08.067
Yang, B., Li, X., Su, Y., Liu, C., and Xue, F. (2020). Carbon quota allocation at the provincial level in China under principles of equity and efficiency. Carbon Manag.11 (1), 11–23. doi:10.1080/17583004.2019.1682755
Yang, J., Liu, C., Mi, Y., Zhang, H., and Terzija, V. (2021). Optimization operation model of electricity market considering renewable energy accommodation and flexibility requirement. Glob. Energy Interconnect.4 (3), 227–238. doi:10.1016/j.gloei.2021.07.007
Yang, Y., Liu, J., Xu, X., Xie, K., Lai, Z., Xue, Y., et al. (2022). Cooperative trading strategy of carbon emitting power generation units participating in carbon and electricity markets. Front. Energy Res.10. doi:10.3389/FENRG.2022.977509
Zhao, N., Zhang, H., Yang, X., Yan, J., and You, F. (2023). Emerging information and communication technologies for smart energy systems and renewable transition. Adv. Appl. Energy9, 100125. doi:10.1016/j.adapen.2023.100125
Zhao, X-G., Zhou, Y,, Zuo, Y., Meng, J., and Zhang, Y-Z. (2019). Research on optimal benchmark price of tradable green certificate based on system dynamics: A China perspective. J. Clean. Prod.230 (1), 241–252. doi:10.1016/j.jclepro.2019.04.408
Zhu, Q. (2017). A perspective of evolution for carbon emissions trading market: The dilemma between market scale and government regulation. Discrete Dyn. Nat. Soc.2017 (1), 1–7. doi:10.1155/2017/1432052
Zun, G., Li, G., Zhou, M., and Feng, W. (2019). Two-stage robust optimal scheduling of regional integrated energy system considering network constraints and uncertainties in source and load. Power Syst. Technol.43 (9), 3090–3100. doi:10.13335/j.1000-3673.pst.2019.1113
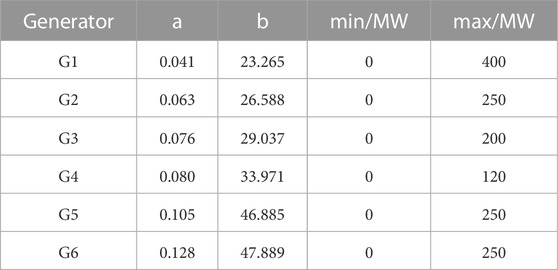
TABLE A1. Parameters of power producers in the market.
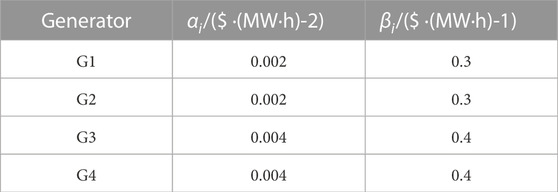
TABLE A2. The coefficient of carbon emission of thermal generating units.

TABLE A3. Other parameters of the model.
Keywords: electricity market, carbon market, green certificate market, multi-market integration, golden jackal optimization algorithm
Citation: Qiao J, Li M, Liu J, Lu Y, Sun Y, Liu Y and Yang Y (2023) Research on decision-making behavior of power suppliers considering multi-market integration and network security. Front. Energy Res. 11:1220751. doi: 10.3389/fenrg.2023.1220751
Received: 11 May 2023; Accepted: 29 June 2023;
Published: 20 July 2023.
Edited by:
Rui Wang, Northeastern University, ChinaCopyright © 2023 Qiao, Li, Liu, Lu, Sun, Liu and Yang. This is an open-access article distributed under the terms of the Creative Commons Attribution License (CC BY). The use, distribution or reproduction in other forums is permitted, provided the original author(s) and the copyright owner(s) are credited and that the original publication in this journal is cited, in accordance with accepted academic practice. No use, distribution or reproduction is permitted which does not comply with these terms.
*Correspondence: Jichun Liu, amljaHVubGl1QHNjdS5lZHUuY24=
Disclaimer: All claims expressed in this article are solely those of the authors and do not necessarily represent those of their affiliated organizations, or those of the publisher, the editors and the reviewers. Any product that may be evaluated in this article or claim that may be made by its manufacturer is not guaranteed or endorsed by the publisher.
Research integrity at Frontiers
Learn more about the work of our research integrity team to safeguard the quality of each article we publish.