 Zhaoxi Tang
 Liping Chen
95% of researchers rate our articles as excellent or good
Learn more about the work of our research integrity team to safeguard the quality of each article we publish.
Find out more
ORIGINAL RESEARCH article
Front. Energy Res. , 28 July 2023
Sec. Sustainable Energy Systems
Volume 11 - 2023 | https://doi.org/10.3389/fenrg.2023.1220207
This article is part of the Research Topic Sustainable Transition for Urban Housing and Community View all 6 articles
Household energy consumption is one of the important indicators reflecting the economic development and living standard across countries. Using China’s classified household energy consumption and daily expenditure data from 2011 to 2019, this paper first calculated the overall direct and indirect household energy consumption in China in recent years by means of energy classification and consumer lifestyle analysis (CLA), and then analyzed the characteristics and changes of household energy consumption structure, and the different trends between urban and rural areas in China. We found that 1) Coal consumption occupied the first place in indirect energy consumption, followed by electricity. In terms of the overall trends, whether direct or indirect energy consumption, the proportion of coal was declining while those of electricity and natural gas were increasing year by year. 2) Indirect energy consumption accounted for the majority of the total, and the largest share of that was about housing consumption both in urban and rural areas. The changes in the indirect energy consumption structure of the urban and the rural were quite different. Compared with the indirect energy consumption of the rural, that of the urban showed both a faster growth rate and a larger share in the total indirect consumption, which reflected the inequality trend at present in energy consumption intensity and structure between urban and rural areas in China.
Household energy consumption is one of the important indicators reflecting the economic development and living standard across countries (Lin et al., 2013). Since the reform and opening up, China’s economic output and urbanization level have been significantly improved, but there is still an imbalance between the supply and demand of energy consumption. How to solve the problem of energy shortage remains an essential issue for China at the present stage. According to the BP Statistical Review of World Energy released by British Petroleum Corporation (BP), China has become the world’s largest energy consumer in 2010, accounting for 20.3% of the global total, and this amount accounted for 26.1% of the global total by 2020. According to data from the National Bureau of Statistics of China, among the six main energy consumption sectors in China, primary energy consumption related to households accounted for an average of 12.7% of whole energy consumption from 2000 to 2019, making it the second largest energy consumption sector only after the industry sector. At present, most of the studies on China’s energy consumption have focused on industrial energy use, and there were just a few on household energy consumption. Therefore, the purpose of this paper is to conduct a more comprehensive study on household energy consumption in China.
Household energy consumption mainly includes direct energy consumption and indirect energy consumption (Wei et al., 2007). Our study, on one hand, attempted to investigate the main types of China’s household direct energy consumption and the changes in its consumption structure in recent years, as well as the changing trend of China’s household direct energy consumption per unit of GDP (energy intensity). On the other hand, indirect household energy consumption, as the energy consumed in the production process of non-energy goods and services and closely related to the main types of household consumption expenditure, was further studied. Therefore, we also tried to investigate some issues such as, which of the eight major consumption expenditures of Chinese households accounted for the greater indirect energy consumption, whether there were some changes in the total amount and structure of indirect energy consumption in recent years and the possible reasons for those variations, as well as the differences in indirect energy consumption trends between urban and rural areas in China, and those possible causes or connections with the progress of urbanization.
In recent years, some literature has employed different methods from different aspects to measure and analyze household energy consumption in China. Wang and Zhang (2015) adopted the consumer lifestyle analysis method (CLA) to study the indirect energy consumption of rural households in China and showed that the indirect energy consumption of rural residents in China gradually decreased from 1998 to 2011. Wang and Jiang (2017) conducted a field survey and statistics on 6,000 rural households in 30 rural counties in 25 provinces of China, and suggested that the key to improving China’s rural energy consumption structure was to improve rural residents’ income level and increase investment in energy infrastructure. Liu et al. (2018) investigated the total and per capita natural gas consumption of urban residents in 30 provinces of China by using the feasible generalized least square method, and made scenario prediction and analysis on influencing factors. Guo et al. (2018) adopted a questionnaire similar to the Residential Energy Consumption Survey (RECS) of the EIA, covering multiple end-uses of household energy consumption, to explore the energy-saving technology and economic potential of residential buildings in Xiamen city. Niu et al. (2019) estimated the consumption of biogas and solar energy by Chinese farmers and calculated the effective energy consumption, revealing the main characteristics and trends of the energy structure change. Ma et al. (2021) estimated village-level energy consumption and analyzed the corresponding inequality based on the data from 1010 households in 100 villages in China. Combining monthly household consumption survey and meteorological data, Hou et al. (2022) explored a U-shaped overall temperature-response function of household electricity consumption in China, and predicted future electricity demand under different climate scenarios. Han et al. (2022) analyzed the provincial panel data of China’s rural civilian bulk coal (RCBC), investigated the time effect and spatial spillover effect of RCBC consumption, and discussed the problems of governance. Shen et al. (2022) found that in the 10 years since 2012, the consumption of coal and biofuels still dominated the energy sector of rural residents in China, while the consumption of electricity accounted for 20%, and the consumption of natural gas increased significantly. Wu and Lin, (2022) used the CLA method to measure the energy consumption of Chinese residents, and discussed that the impact of China’s urbanization on household indirect energy consumption could be divided into stages and showed a U-shaped relationship. Wang et al. (2022) analyzed and evaluated the changes and differences in urban household electricity consumption in each province based on an extended STIRPAT model, using China’s provincial panel data from 2005 to 2020.
There are also a number of literature from different perspectives and methods to analyze the various factors affecting China’s household energy consumption. Based on the input-output models, Ding et al. (2017) studied the direct and indirect influencing factors of Chinese household consumption from the perspective of consumers’ lifestyles. Zhang and Peng, (2017) used the panel threshold model to study the direct rebound effects on household electricity consumption in China from 2000 to 2013 and its main influencing factors. Meng et al. (2018) with provincial household electricity consumption and population data from 2001 to 2014, employed a three-dimensional decomposition and mixed trend extrapolation model to explore the driving factors for the growth of household electricity consumption in China. Using the structural decomposition method, Zhang and Lahr (2018) studied how changes in technology, economic structure, urbanization, lifestyle and inter-regional trade caused the differences in direct and indirect household energy consumption in different regions of China. Wu et al. (2022), based on the data from China General Social Survey in 2015 and 2018, established a regression model including internal and external factors to study the driving factors. Some literature discussed the impacts on household energy consumption from economic, social or natural dimensions, such as poverty threshold (He and Reiner, 2016), environmental ideas (Sun et al., 2018), energy transition (Han and Wu, 2018), consumption patterns (Liu et al., 2021), housing ways (Long et al., 2022), digital literacy (Zhao et al., 2022), natural disasters (Yin et al., 2022), respectively.
To sum up, in previous literature the measurement of China’s household energy consumption was basically based on a certain type or for a certain region in China, and also many of them have used microdata from individual surveys, especially for farmers in rural areas, while the overall measurement and systematic macro analysis on the scope across China are still few. The purpose of this paper is to measure the direct and indirect household energy consumption in China through energy classification and CLA method, and make a more systematic analysis of the characteristics and trends of consumption amount and structure, the difference between urban and rural areas and the possible causes and connections. The rest of this paper is arranged as follows: the second part is the measurement of China’s direct and indirect household energy consumption; the third part is the analysis of characteristics and trends of direct household energy consumption; the fourth part is the analysis of the indirect household energy consumption; the fifth part concludes.
Household direct energy consumption (DE) refers to the direct purchase and consumption of energy products in residential daily life. It mainly involves the energy directly consumed by residents in their daily life such as the fuels consumed by lighting, cooking, electrical appliances (including heating, cooling and cleaning), transportation, and so on. Since the statistical data available in China do not distinguish energy consumption in terms of residential activities, but only different types of energy consumption, the direct energy consumption here is mainly measured according to the type of energy, and the calculation formula is as follows:
Where,
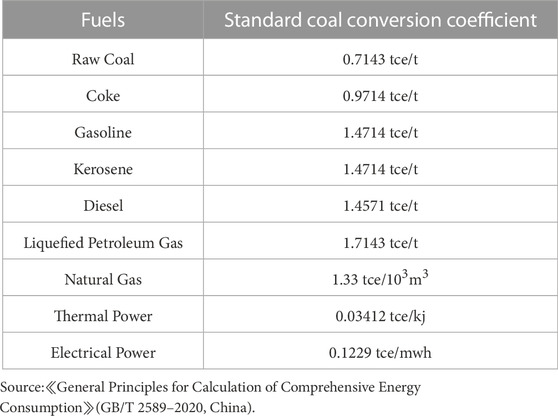
TABLE 1. Standard coal conversion coefficient for fuels.
Household indirect energy consumption (IE) refers to the energy consumption indirectly generated by the consumption of non-energy goods and services other than energy products. The production of any kind of goods or services requires energy use, so indirect energy consumption refers to the sum of all the products of all sectors used in the production process of the non-energy products consumed. For example, when someone buys a piece of clothes, tools such as a cloth inspection machine, an electric knife and a sewing machine are needed to make the clothes, and the production of the cloth inspection machine, electric knife and sewing machine will also consume machinery, steel, electricity, and so on. Tracing all this way, it can be found that buying a piece of clothes indirectly consumes many times of energy, and the types of energy involved are also not limited to one.
The CLA method is a commonly used measurement method for household indirect energy consumption. It takes consumer goods of households as the basic analysis unit, calculates the energy consumption intensity of each type of consumption activity according to the data of household expenditure, estimates the energy consumption industries, directly and indirectly, related to each type of consumption activity, and finally obtains the total amount of indirect energy consumption of households. To put it simply, CLA is to consider household consumption expenditure in relation to its directly related industries. According to the standards formulated by the National Bureau of Statistics of China, in this paper all the household consumption expenditure was divided into eight major categories: food, clothing, housing, household equipment and service, transportation and communication, education and entertainment, medical care, and other goods and services. Twenty-one industries directly related to the eight major categories were classified and shown in Table 2.
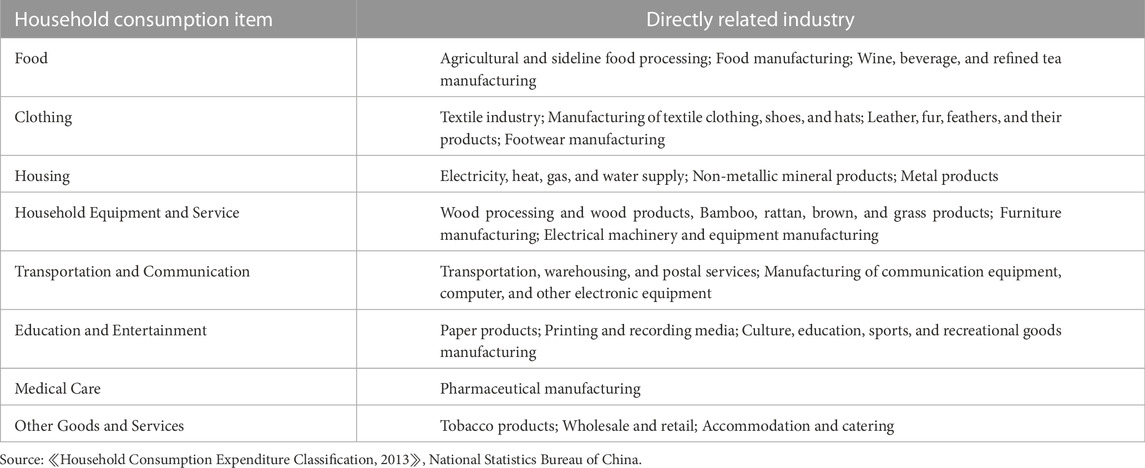
TABLE 2. The eight major household expenditures and their directly related industries.
According to the corresponding relationship between household consumption expenditure and related industries, the energy consumption intensity of eight consumer activities can be calculated. The calculation formula is as follows:
Where,
Then each calculated energy consumption intensity of eight consumption activities is multiplied by the corresponding household consumption expenditure to obtain the total indirect energy consumption amount related to all consumption expenditure activities. The calculation formula is as follows:
Xi is the per capita expenditure of households in the ith consumption sector; P is the population of consumers.
The data on household consumption expenditure and population in the period of 2000–2019 were obtained from China Statistical Yearbook, and the data on energy consumption and added value of industries from the China Energy Statistical Yearbook and China Industrial Statistical Yearbook, respectively. In addition, in order to exclude the impact of inflation factors, the household consumption expenditure and the added value of various industries from 2000 to 2019 were uniformly converted based on 2000 the base period. The CPI and PPI data of various industries used in measurement were from the WIND database.
According to Formula (1) and (3), the total amount of China’s direct and indirect household energy consumption during 2000–2019 was calculated. It could be seen from Figure 1 that since 2000, the proportion of direct household energy consumption and that of indirect one in China has always maintained an opposite trend. However, in general, the proportion of indirect energy consumption decreased gradually, from 89% in 2000 to 80% in 2019. Indirect energy consumption was still the main part of household energy consumption, which accounted for more than 80%.
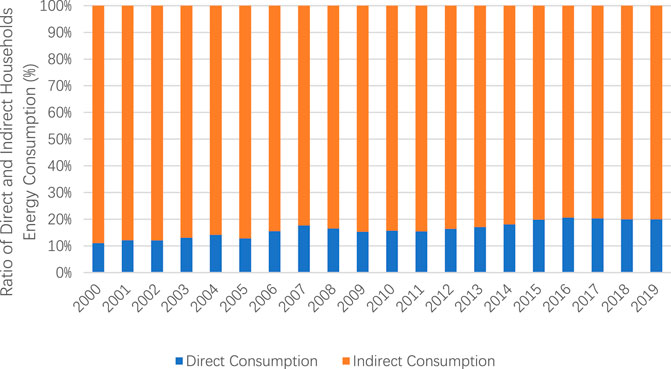
FIGURE 1. Ratio of direct and indirect households energy consumption in China (2000–2019).
The reason could be that direct energy consumption of residents was limited to lighting, cooking, household appliances, transportation, private cars, etc., which had relatively lower energy consumption and were prone to demand saturation. However, the energy consumed by various related industries involved in other non-energy consumption activities would eventually be transformed into indirect households energy consumption, which on the whole made the indirect energy consumption much higher than the direct one.
Since the beginning of the 21st century, with the acceleration of China’s economic growth and the increasing size of its population, household daily energy demand has gradually increased. Figure 2 shows the total direct energy consumption and the change trend in the household sector in China during 2000–2019. Accordingly, the annual growth rate was calculated from the data of the total household direct energy consumption from 1999 to 2019.
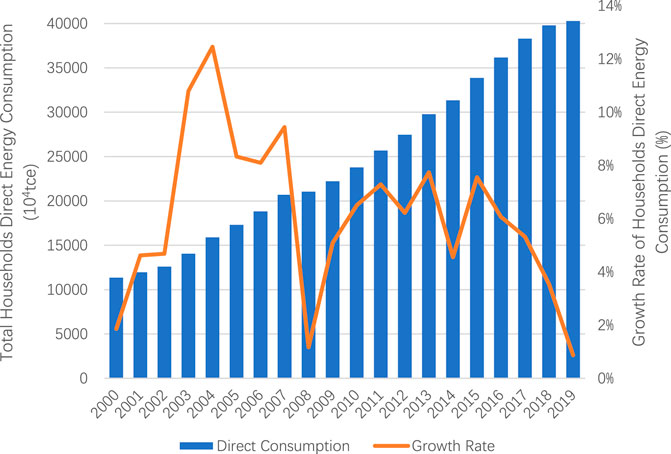
FIGURE 2. Total households direct energy consumption in China, 2000–2019.
It can be seen that in the past 20 years, the total household direct energy consumption has been on the rise in the past 20 years, but the annual growth rate fluctuated greatly. Household direct energy consumption changed rapidly in the early 21st century, and the growth rate kept rising, even reaching 12.46% in 2004, which was a peak growth rate of direct energy consumption from 2000 to 2019. However, the annual growth rate of household energy consumption gradually decreased after 2004, while the total energy consumption was relatively stable. Due to the deepening of the international financial crisis and other reasons, the national economic growth momentum slowed down, and the demand for energy dropped significantly. In 2008, the annual growth rate of household energy consumption reached a low point, partly because of the Olympics in Beijing, which raised people’s awareness of energy conservation, and partly because of the frequent natural disasters. Note that population growth would inevitably bring about an increase in total energy consumption, actually the total energy consumption of China’s household sector varied almost the same in both the per capita amount and the annual growth trend in the past two decades.
The energy consumption structure in this paper refers to the proportion of all types of energy consumption in total within a certain statistical period. Direct household energy in China mainly includes coal, coke, kerosene, diesel, gasoline, liquefied petroleum gas (LPG), natural gas, thermal power and electricity.
As can be seen from Figure 3, the household energy consumption of early times was mainly coal, which accounted for more than 50% of the total energy consumption of residents. In recent years, with the improvement of urbanization and the transformation of lifestyles, the energy consumption structure has also changed a lot. From 2010 to 2019, the direct electricity consumption of Chinese households increased significantly, and the proportion of natural gas, gasoline, LPG and thermal power also all increased, while the proportion of coal gradually decreased. By 2019 coal consumption only accounted for less than 20% of total household energy consumption. Although natural gas consumption accounted for a small proportion, the increasing trend year by year was obvious. The total thermal power consumption was also relatively small, mainly because the thermal power consumption was mainly concentrated in northern China but many of the rural areas had fewer collective heating facilities, while southern China need not have heating, so the thermal power consumption was very small. From the perspective of the ratio of each type of energy in those years, the energy consumption structure was gradually optimized, and the consumption amount gradually appeared in an equilibrium state. Direct coal use has declined in recent years largely because of the widespread use of electricity in China’s rural areas. The extensive application of electricity improved coal utilization efficiency and greatly benefit centralized emission reduction and environmental improvement. Therefore, the following four categories of household consumption of coal, gasoline, natural gas and electricity were selected for further analysis.

FIGURE 3. Structure of household direct energy consumption in China (2000–2019).
Figure 4 shows the changing trend of household direct energy consumption of coal, natural gas, gasoline and electricity in China from 2000 to 2019. Since 2000, coal has provided more than 50% of the energy demand of China’s household sector. However, with the adjustment of economic growth and energy structure by governments, the proportion of highly polluting coal consumption in total has decreased significantly. The total household coal consumption gradually declined after 2005 and maintained a relatively stable level in the following seven or 8 years. There was a slight fluctuation since 2014 and then it dropped sharply after 2017.
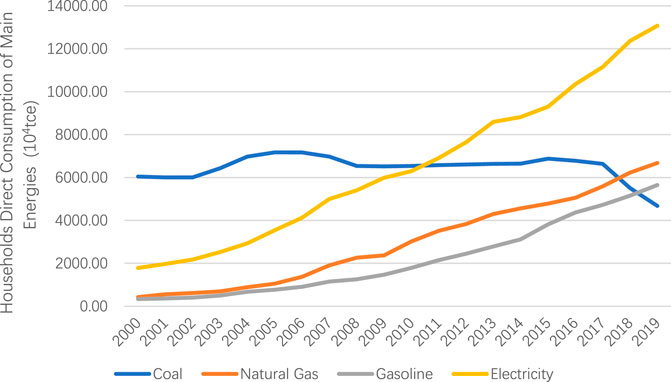
FIGURE 4. Households direct consumption of main energies in China, 2000–2019.
China nowadays has been a huge car user and gasoline consumer. According to China’s National Bureau of Statistics, car ownership numbers per 100 households in China more than doubled from 2013 to 2019. With the increase in China’s household car ownership, gasoline consumption in China’s residential daily life was growing. Household gasoline consumption increased slowly before 2006 but began to grow rapidly after 2006. By 2019, it increased more than six times compared with that at the beginning of this century. China’s household natural gas demand and consumption have continued to grow in recent years. The growth rate of household natural gas consumption was slow before 2004, while with the natural gas penetration across China after 2004 this kind of consumption began to increase rapidly. By 2019, household natural gas consumption in China has reached more than seven times that in 2000. Under the influence of the continuous promotion of energy conservation and emission reduction measures as well as the gradual improvement of energy efficiency, China’s electricity demand has increased rapidly along with economic growth, leading to the continuous growth of electricity consumption in the household sector. Household electricity consumption in China has been growing rapidly since 2000 in spite of there being a short period of slow growth rate from 2013 to 2015.
Energy consumption intensity, that is, energy consumption per unit of GDP, is an important indicator to measure energy conservation and consumption characteristics. It reflects an economy’s energy utilization level and efficiency that change together with economic growth and economic patterns. The lower the energy consumption intensity, the higher the energy utilization efficiency, and the more significant the emission reduction effect.
As can be seen from Figure 5, there was an inverse relationship between China’s direct household energy consumption and its energy consumption intensity during 2000–2019. The total energy consumption showed a gradual upward trend, while energy consumption intensity showed a downward trend, reaching the lowest level at 0.05 tce per 10000 yuan in 2019. This indicated that although China’s direct household energy consumption has been increasing in the past 20 years, the average annual growth rate of that was still lower than the growth of GDP, resulting in the annual reduction of energy consumption per unit GDP, namely the reduction of energy consumption intensity, indicating that the energy utilization efficiency in China’s household sector was gradually improving.
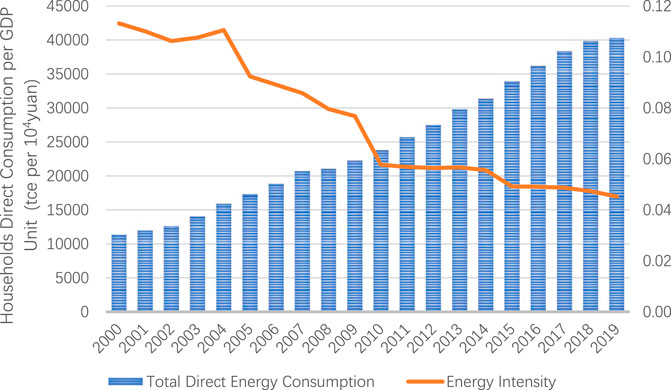
FIGURE 5. Households direct consumption per GDP unit in China, 2000–2019.
According to Eq. 2, we first calculated the household energy consumption intensity corresponding to various types (see Table 3), and then using Eq. 3 measured China’s total household indirect energy consumption related to the eight major household expenditures during 2000–2019 (see Figure 6).
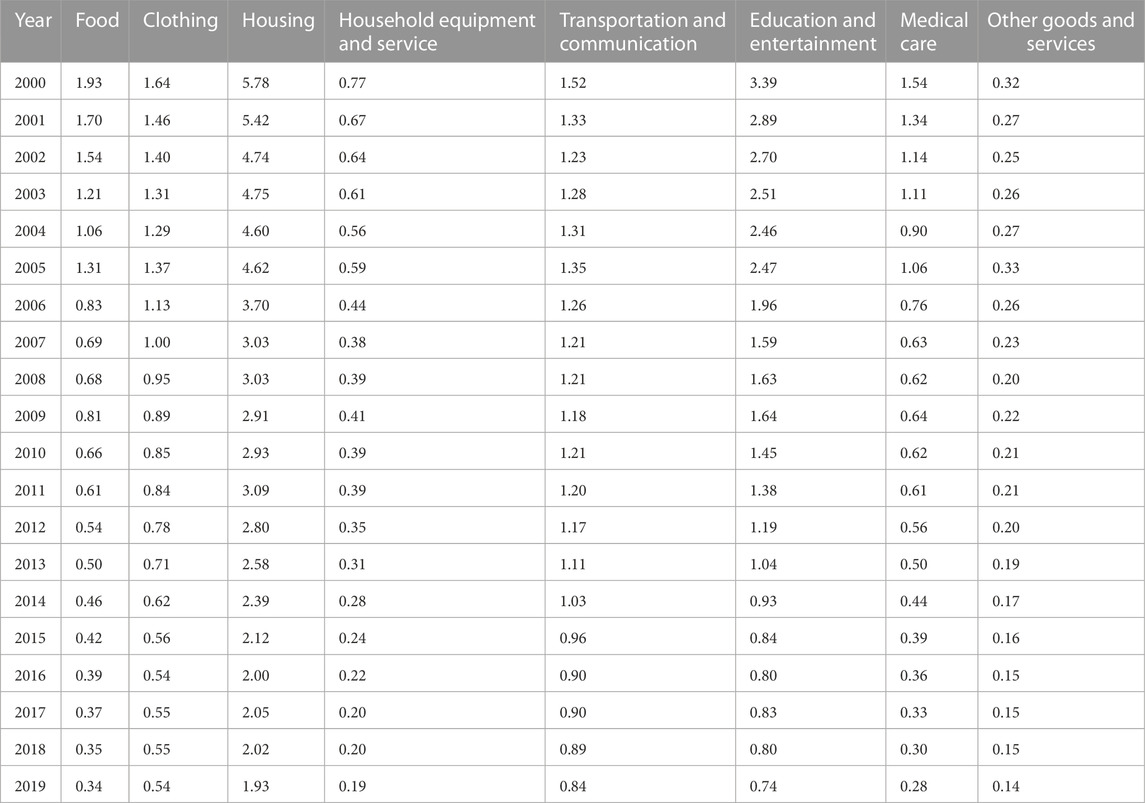
TABLE 3. Energy intensity of the eight major household expenditures in China (2000–2019).
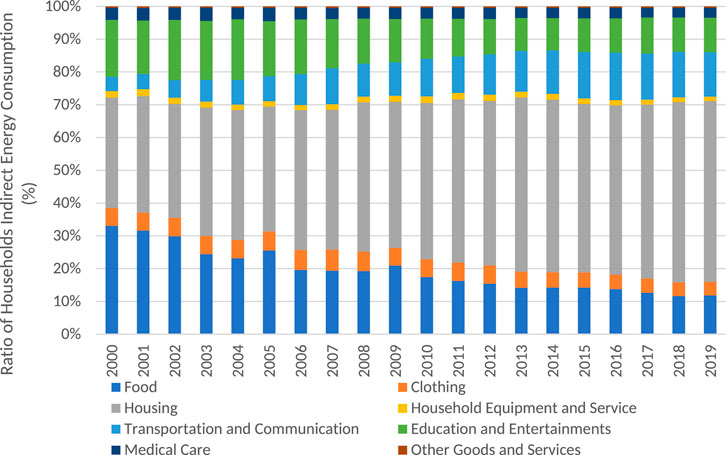
FIGURE 6. Structure of Households Indirect Energy Consumption in China (2000–2019)
As shown in Figure 6, the total amount of indirect energy consumed by households in food, housing, education and entertainment accounted for a large proportion. The main reasons were as follows:
First of all, from the energy intensity of consumption expenditure activities (Table 3), it could be seen that the energy intensities of housing, education and entertainment were at a relatively high level because most of these expenditures were directly related to higher energy consuming industries. The nature of these industries led to the total indirect energy consumption becoming higher than that of other industries under the premise of similar consumption expenditure.
Secondly, food expenditure was the most basic consumption activity of residents’ life, which was an important index to measure people’s living standards. China’s households spent more on food items than others every year. In 2000, the Engel coefficient of Chinese residents was 42.2%. With the rapid growth of economic output, China has historically solved the problem of absolute poverty, and the Engel coefficient has gradually decreased. However, food expenditure still ranked first among the eight major expenditures per capita at present (see Figure 7). Therefore, although the energy intensity of food expenditure was low, the high consumption amount still led to the high indirect energy consumption of food. In 2000, indirect energy consumption for food accounted for 34% while that for education and entertainment was about 20%. Over a long period of time, indirect energy consumption in housing, transportation and communication continued to rise. By 2019, two-thirds of the indirect energy consumption of residents had been accounted for by these two sectors, which squeezed out much energy consumption of food, education and entertainment services. This phenomenon has much to do with the increasing household expenditures on housing, transportation and communication over the past 20 years. The reason for these increases could be the growth of house prices and the development of express mail and IT industries. Among them, the “ladder electricity price” system in 2012 and the “single two-child” policy in 2013 effectively promoted residents’ demand for housing consumption. In addition, around 2013 the change in the Chinese statistical caliber on household consumption expenditure also caused some impacts. On the other hand, the total proportions of indirect energy consumption of clothing, medical care, and household equipment and services remained relatively low and basically stable at 20%–30%.
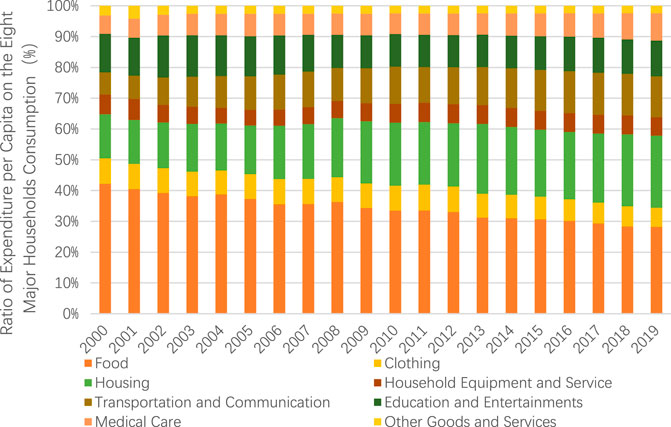
FIGURE 7. Structure of expenditure per capita on the eight major households consumption in China (2000–2019).
Finally, the proportion of other goods and services was relatively smaller and much lower than those of the other seven categories of consumption activities. The main reason was that the industries directly related to such consumption were services or businesses, which had high output but low energy consumption, and therefore low energy intensity. So reducing household indirect energy consumption also could start by boosting business and service industries.
According to the trends of China’s indirect energy consumption of urban and rural households in Figure 8, the overall household indirect energy consumption shows a fluctuating and rising trend from 2000 to 2019, which indicates that it was likely affected by a variety of factors.
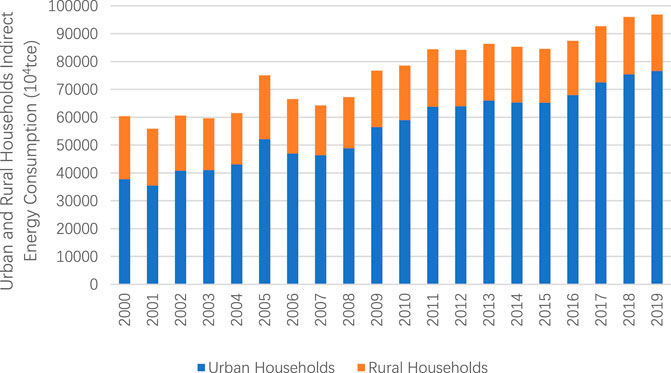
FIGURE 8. Urban and rural households indirect energy consumption in China, 2000–2019.
Firstly, indirect household energy consumption always increased due to the increase in daily consumption expenditure and decreased due to improvements in technology and energy efficiency, while direct energy efficiency of residents also was becoming higher and higher and interacted with the indirect one. As a result, indirect household energy consumption was always changing. Secondly, demographic factors also affected indirect household energy consumption: on one hand, China’s population was increasing, which had a negative impact on energy conservation consumption, while the population growth rate was decreasing, which had a positive impact instead. On the other hand, with the acceleration of urbanization and the increase in urban population, changes both in the size and the ratio of urban population also affected the overall level of indirect energy consumption. Some studies have shown that indirect energy consumption was affected by the structure of direct energy consumption: for example, electricity consumption gradually took up the share of coal consumption, which meant that the goods consumed by residents would use less energy for the intermediate process, so that the indirect energy consumption would be gradually reduced within the same consumption expenditure.
On the whole, the indirect energy consumption of rural residents was only one-third of that of urban residents (Figure 8). This phenomenon was mainly caused by the following aspects: First, the disposable income and purchase power of rural residents are lower than those of urban ones. Therefore, provided the same energy intensity, urban residents would inevitably consume more indirect energy. Second, Figure 6 shows that the household sector consumed more energy in housing. Generally speaking, compared with rural houses urban ones were more complex and also with a better variety of facilities, which consumed a lot of energy in use and maintenance. In addition, the demand for electricity and heating was much higher in urban areas than in rural ones. Since non-market energy sources (such as straw, firewood, and biogas) were used more frequently and in larger quantities in rural China while market energy sources (such as natural gas and gasoline) were consumed relatively less, there were more renewable energy sources as alternatives to electricity and heating supply in China’s rural areas. Due to the difference in social structure and living patterns, the energy consumption gap between China’s urban and rural households has been obviously reflected. Third, according to statistics data, the consumption level of urban residents was higher than that of rural ones, especially the expenditure in fields of clothing, household equipment and service, education and entertainment, which accounted for a larger share of the total expenditure, and moreover, the indirect energy consumption of these three activities had a relatively larger proportion in total energy consumption. So it meant that the indirect energy consumption difference between urban and rural residents would be further augmented.
The similarities and differences between China’s urban and rural indirect energy consumption structure could be more clearly seen in Figures 9, 10. The main similarities were as follows: From the perspective of the ratio, both urban and rural housing consumption in China ranked first in all household indirect energy consumption from 2000 to 2019, and the next items were food, education and entertainment. The reason could be that housing and food are still basic items for living nowadays, and education and entertainment were also needed for the sound development of society. From the perspective of trend, among the eight major consumption expenditures, the proportions of housing, education and entertainment in urban and rural areas both showed declining trends, while those for food, transportation and communication gradually increased. The other four consumption activities accounted for a relatively smaller proportion and remained relatively stable. On one hand, the increase in the proportions of food and transportation lay in the fact that the energy efficiencies of the related industries were much lower than those of the other four. On the other hand, the demand for higher quality commodities at present became more popular than before, and they were also pursuing more convenience and effectiveness in transportation and communication, reflected in the increasing popularity of private computers, car ownership and postal services in China.
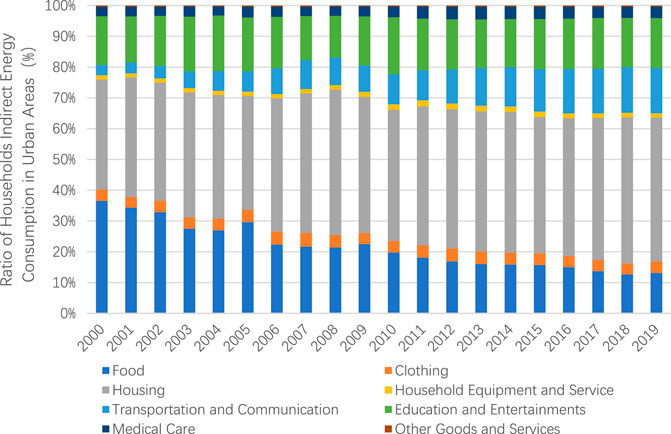
FIGURE 9. Structure of households indirect energy consumption in urban areas of China (2000–2019).
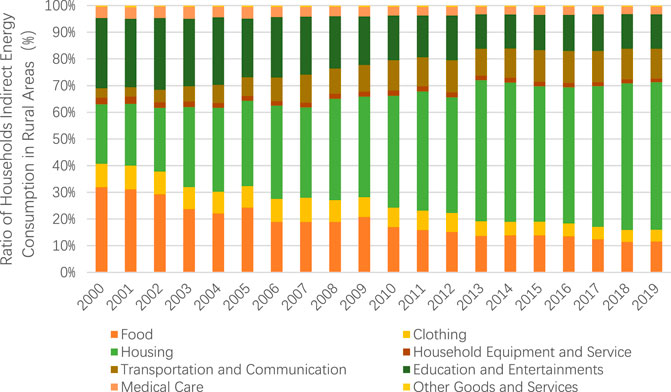
FIGURE 10. Structure of households indirect energy consumption in rural areas of China (2000–2019).
The differences in indirect energy consumption structure between urban and rural China were as follows: The proportion of indirect energy consumption of urban residents in housing has increased significantly since 2013, which even occupied 50% of the total by 2019. And the growth rate of urban housing energy consumption also accelerated significantly, while that of the rural one was almost unchanged, with a smaller proportion as well. The proportion of medical care in rural areas was slightly higher than that in urban ones. The possible reason was that China’s urban residents had stronger insurance awareness and more common medical insurance which made the proportion of medical expenditure smaller, and thus the proportion of this part was lower than that of rural residents. The above analysis to a certain extent reflected the characteristics of consumer behavior and the consumption trends of urban and rural residents nowadays, which meant consumption idea in China was gradually transforming from an emphasis on material products to both commodities and services.
According to the analysis above, the indirect energy consumption of urban and rural residents was not only different in the quantity but also in proportion or energy consumption structure. But the proportions of indirect energy consumption in various expenditures of urban and rural areas were still relatively smooth respectively and had not changed much. Though the economic pattern, resource allocation and lifestyle were different from each other, however, with the development of networks and transportation more and more demands and purchases for goods and services would be similar to those of urban residents in near future.
Figure 11 shows the proportion of China’s indirect consumption of coal, gasoline, natural gas and electricity in the sum of the four. Among different types of energies, the indirect consumption of coal by residents accounted for more than 78%, but the proportion decreased step by step from 2000 to 2019. On the whole, the proportion of indirect energy consumption of electricity has increased by and large, while that of natural gas has been rising and that of gasoline has remained stable.
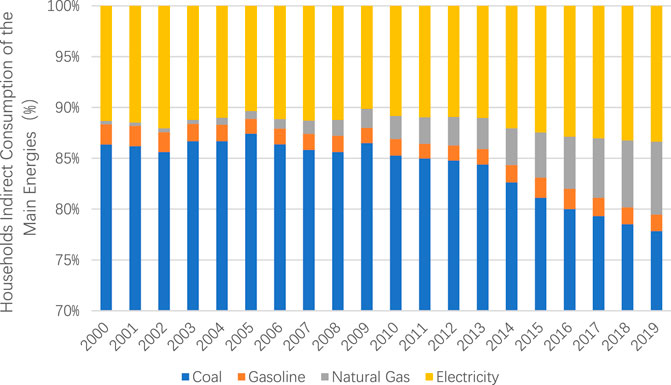
FIGURE 11. Households indirect consumption of the main energies in China (2000–2019).
A comparative analysis between Figures 3, 11 could find that proportions of direct and indirect household consumption of the four energy sources were almost the same. Although coal accounted for a large part of residential energy consumption, electricity consumption has increased significantly in recent years and become the “main force” of residential energy consumption in both direct and indirect sectors. Electricity occupied such an important position in residential energy consumption because of its advantages of higher utilization rate, less pollution, lower price and more sufficient supply. In contrast, due to the utilization rate of coal and its serious pollution, the status of coal in residential indirect energy consumption was gradually declining. With the improvement of China’s awareness of environmental protection and emphasis on energy conservation and emission reduction, natural gas has gradually become an important new resource of indirect energy consumption. However, China’s natural gas industry entered a rapid development period just around 2006, so the indirect household consumption of that was almost negligible before 2006. The main reason for the rapid increase after was that China’s urbanization and energy structure transformation have promoted the growth of urban population and the demand for natural gas since 2006. From 2013 to 2019, China’s urban natural gas usage scale continued to expand with a growth rate of 45%. China had a high dependence on foreign crude oil imports, therefore the supply and price of gasoline were not as stable as that of electricity due to the influence of international oil supply. however, China’s household consumption of gasoline was mainly concentrated in the field of transportation and the use scope was relatively narrow.
This paper first calculated the direct and indirect household energy consumption in China in recent years by means of energy classification and the CLA, and then analyzed the consumption structures and trends, the differences between urban and rural areas and their possible causes. The main research conclusions were as follows:
1) Major direct household energy consumption in China has gradually changed from coal to electricity, natural gas and gasoline in turn; Coal consumption occupied the first place in indirect energy consumption, followed by electricity. In terms of the overall trends, the proportions of coal in both direct and indirect energy consumption were declining while electricity and natural gas were increasing year by year. The proportion of direct consumption of gasoline increased while that of indirect consumption of gasoline decreased slightly. Household energy consumption showed a trend with “decarbonization” and “cleanliness”. This reflected an overall structural optimization route of China’s household energy consumption.
2) From the perspective of the eight major consumption activities of China’s households, the indirect energy consumption of urban and rural residents was mainly about housing. On the whole, the indirect consumption of housing, transportation and communication gradually increased while the indirect energy consumption of food, education and entertainment showed downward trends. The indirect energy consumption of clothing, medical care, household equipment and service, and other goods and services was relatively stable and low. But the sum of the latter four accounted for less than 20% of indirect consumption. This reflected the different characteristics of indirect energy consumption in urban and rural areas in China.
3) A comparative analysis of indirect energy consumption structure between urban and rural households showed that education and entertainment accounted for the second largest proportion of indirect energy consumption of urban residents, while food expenditure accounted for the same position in rural areas. At the same time, compared with rural residents, the indirect energy consumption of urban ones had a faster growth rate and a larger share of the total indirect consumption. In 2000, the indirect energy consumption of urban residents was 1.5 times that of rural households, but the data reached more than 3 times that of rural ones in 2019. This also reflected somehow the inequality in energy use and consumption structure between urban and rural areas in China.
The original contributions presented in the study are included in the article/supplementary material, further inquiries can be directed to the corresponding authors.
ZT conceived and designed the study. LC collected the data. ZT and LC analyzed the results and wrote the manuscript. All authors contributed to the article and approved the submitted version.
“Research on Influencing Factors Decomposition and Dynamic Paths Forecasting of Carbon Emissions from Energy Consumption in Yangtze River Delta Region”, Natural Science Foundation of Zhejiang Province (No. LY20G030017).
The authors declare that the research was conducted in the absence of any commercial or financial relationships that could be construed as a potential conflict of interest.
All claims expressed in this article are solely those of the authors and do not necessarily represent those of their affiliated organizations, or those of the publisher, the editors and the reviewers. Any product that may be evaluated in this article, or claim that may be made by its manufacturer, is not guaranteed or endorsed by the publisher.
Ding, Q., Cai, W., Wang, C., and Sanwal, M. (2017). The relationships between household consumption activities and energy consumption in China—an input-output analysis from the lifestyle perspective. Appl. energy207, 520–532. doi:10.1016/j.apenergy.2017.06.003
Guo, F., Akenji, L., Schroeder, P., and Bengtsson, M. (2018). Static analysis of technical and economic energy-saving potential in the residential sector of Xiamen city. Energy142, 373–383. doi:10.1016/j.energy.2017.10.042
Han, H., and Wu, S. (2018). Rural residential energy transition and energy consumption intensity in China. Energy Econ.74, 523–534. doi:10.1016/j.eneco.2018.04.033
Han, J., Hou, X., and Zhang, L. (2022). Policy implications of China's rural household coal governance from the perspective of the spillover effect. Energy242, 122946. doi:10.1016/j.energy.2021.122946
He, X., and Reiner, D. (2016). Electricity demand and basic needs: Empirical evidence from China's households. Energy Policy90, 212–221. doi:10.1016/j.enpol.2015.12.033
Hou, J. J., Liu, L. C., Dong, Z. Y., Wang, Z., Yu, S. W., and Zhang, J. T. (2022). Response of China’s electricity consumption to climate change using monthly household data. Environ. Sci. Pollut. Res.29, 90272–90289. doi:10.1007/s11356-022-21813-7
Lin, B., Yang, F., and Liu, X. (2013). A study of the rebound effect on China's current energy conservation and emissions reduction: Measures and policy choices. Energy58, 330–339. doi:10.1016/j.energy.2013.06.018
Liu, G., Dong, X., Jiang, Q., Dong, C., and Li, J. (2018). Natural gas consumption of urban households in China and corresponding influencing factors. Energy Policy122, 17–26. doi:10.1016/j.enpol.2018.07.016
Liu, M., Huang, X., Chen, Z., Zhang, L., Qin, Y., Liu, L., et al. (2021). The transmission mechanism of household lifestyle to energy consumption from the input-output subsystem perspective: China as an example. Ecol. Indic.122, 107234. doi:10.1016/j.ecolind.2020.107234
Long, H., Shi, S., Tang, Z., and Zhang, S. (2022). Does living alone increase the consumption of social resources?Environ. Sci. Pollut. Res.29, 71911–71922. doi:10.1007/s11356-022-20892-w
Ma, S., Xu, X., Li, C., Zhang, L., and Sun, M. (2021). Energy consumption inequality decrease with energy consumption increase: Evidence from rural China at micro scale. Energy Policy159, 112638. doi:10.1016/j.enpol.2021.112638
Meng, M., Wang, L., and Shang, W. (2018). Decomposition and forecasting analysis of China's household electricity consumption using three-dimensional decomposition and hybrid trend extrapolation models. Energy165, 143–152. doi:10.1016/j.energy.2018.09.090
Niu, S., Li, Z., Qiu, X., Dai, R., Wang, X., Qiang, W., et al. (2019). Measurement of effective energy consumption in China's rural household sector and policy implication. Energy policy128, 553–564. doi:10.1016/j.enpol.2019.01.016
Shen, G., Xiong, R., Tian, Y., Luo, Z., Jiangtulu, B., Meng, W., et al. (2022). Substantial transition to clean household energy mix in rural China. Natl. Sci. Rev.9 (7), nwac050. doi:10.1093/nsr/nwac050
Sun, W., Zhang, X., Li, H., Wu, J., and Zheng, S. (2018). Environmental ideology and household energy conservation in Beijing. J. Clean. Prod.195, 1600–1608. doi:10.1016/j.jclepro.2017.07.065
Wang, R., and Jiang, Z. (2017). Energy consumption in China's rural areas: A study based on the village energy survey. J. Clean. Prod.143, 452–461. doi:10.1016/j.jclepro.2016.12.090
Wang, W., and Zhang, M. (2015). Direct and indirect energy consumption of rural households in China. Nat. Hazards79 (3), 1693–1705. doi:10.1007/s11069-015-1921-5
Wang, Y., Cai, W., Hou, L., Zhou, Z., and Bian, J. (2022). Examining the provincial-level difference and impact factors of urban household electricity consumption in China—based on the extended STIRPAT model. Sustainability14 (16), 9960. doi:10.3390/su14169960
Wei, Y. M., Liu, L. C., Fan, Y., and Wu, G. (2007). The impact of lifestyle on energy use and CO2 emission: An empirical analysis of China's residents. Energy policy35 (1), 247–257. doi:10.1016/j.enpol.2005.11.020
Wu, D., Geng, Y., Zhang, Y., and Wei, W. (2022). Features and drivers of China's urban-rural household electricity consumption: Evidence from residential survey. J. Clean. Prod.365, 132837. doi:10.1016/j.jclepro.2022.132837
Wu, W., and Lin, Y. (2022). The impact of rapid urbanization on residential energy consumption in China. PLoS One17 (7), e0270226. doi:10.1371/journal.pone.0270226
Yin, Z., Yan, Y., Chen, X., and Liu, T. (2022). Earthquake and household energy consumption–Evidence from the Wenchuan earthquake in China. Energy Econ.111, 106061. doi:10.1016/j.eneco.2022.106061
Zhang, H., and Lahr, M. L. (2018). Households’ energy consumption change in China: A multi-regional perspective. Sustainability10 (7), 2486. doi:10.3390/su10072486
Zhang, Y. J., and Peng, H. R. (2017). Exploring the direct rebound effect of residential electricity consumption: An empirical study in China. Appl. energy196, 132–141. doi:10.1016/j.apenergy.2016.12.087
Keywords: energy, household, direct consumption, indirect consumption, China
Citation: Tang Z and Chen L (2023) Measurement and analysis of direct and indirect household energy consumption: a case study of China. Front. Energy Res. 11:1220207. doi: 10.3389/fenrg.2023.1220207
Received: 10 May 2023; Accepted: 13 July 2023;
Published: 28 July 2023.
Edited by:
Zhengxuan Liu, Delft University of Technology, NetherlandsReviewed by:
Ying Sun, Qingdao University of Technology, ChinaCopyright © 2023 Tang and Chen. This is an open-access article distributed under the terms of the Creative Commons Attribution License (CC BY). The use, distribution or reproduction in other forums is permitted, provided the original author(s) and the copyright owner(s) are credited and that the original publication in this journal is cited, in accordance with accepted academic practice. No use, distribution or reproduction is permitted which does not comply with these terms.
*Correspondence: Zhaoxi Tang, emhhb3hpdGFuZ0B6dWZlLmVkdS5jbg==; Liping Chen, bGlwaW5nY2hlbjMwMEAxNjMuY29t
Disclaimer: All claims expressed in this article are solely those of the authors and do not necessarily represent those of their affiliated organizations, or those of the publisher, the editors and the reviewers. Any product that may be evaluated in this article or claim that may be made by its manufacturer is not guaranteed or endorsed by the publisher.
Research integrity at Frontiers
Learn more about the work of our research integrity team to safeguard the quality of each article we publish.