
94% of researchers rate our articles as excellent or good
Learn more about the work of our research integrity team to safeguard the quality of each article we publish.
Find out more
ORIGINAL RESEARCH article
Front. Energy Res. , 09 August 2023
Sec. Energy Storage
Volume 11 - 2023 | https://doi.org/10.3389/fenrg.2023.1205165
This article is part of the Research Topic Full Lifecycle Management of Battery Energy Storage Systems View all 6 articles
 Wentao Wang1
 Gaoyuan Yang1Muxi Li2Zuoyi Yan1Lisheng Zhang1
 Hanqing Yu1
 Kaiyi Yang1
 Pengchang Jiang3Wei Hua3Yong Zhang4Bosong Zou5*
 Kai Yang6
With the increasing demands for battery safety management, data-driven method becomes a promising solution for highly accurate battery state of health (SOH) estimation. However, the data-driven method faces problems of poor interpretability and high dependence on input features. This paper proposes a SOH estimation method that integrates data-driven model and signal analysis method. Specifically, the differential thermal voltammetry (DTV) analysis method is used to analyze aging characteristics to obtain features strongly related to battery aging and solve the problem of poor interpretability of data-driven methods. The use of local linear embedding method (LLE) for feature extraction has improved model efficiency. A data-driven model is constructed with the Bi-directional long short-term memory (Bi-LSTM) as the core, and the attention mechanism (AM) is added to focus on important parts of the sequence to further improve the accuracy of the model. The proposed method is validated based on the Oxford battery degradation dataset, and the results show that the proposed method achieves high accuracy and strong robustness in SOH estimation with a root mean square error (RMSE) maintained at about 0.4%. This method has the potential to be employed on cloud platforms or end-cloud collaboration systems for online implementation.
As the development of clean energy becomes a research hotspot due to the issue of sustainable development, lithium-ion batteries have gradually become the core energy storage devices widely used in various industries, such as smartphones, electric vehicles (EVs) and spacecrafts (Pang et al., 2021; Zhang L. et al., 2022). Lithium-ion batteries have advantages such as high energy density, low self-discharge rate and long cycle life (Hua et al., 2021; Lin et al., 2021; Mou et al., 2022; You et al., 2022). However, with the use of batteries and the passage of time, the degradation of lithium-ion batteries will happen and the performance will deteriorate, while the rated capacity will also decrease. The accurate battery SOH estimation is crucial for the safe use and timely replacement of lithium-ion batteries (Gao et al., 2021; Liu et al., 2022; Zhou et al., 2022). Currently, SOH estimation methods of lithium-ion batteries can be divided into direct measurement methods, model-based methods, and data-driven methods (Xiong et al., 2023).
Direct measurement methods use the coulomb counting method to calculate battery capacity or measure battery impedance to estimate the SOH of the battery. However, this method requires the battery to rest, and the coulomb counting method requires a complete battery charging and discharging process. Therefore, this method is usually not applicable in practical applications and is only suitable for use in laboratories.
Model-based methods estimate the SOH of batteries by constructing battery models such as empirical models, equivalent circuit models (ECM), and electrochemical models. The empirical model-based method constructs a function relationship between easily measured macroscopic signals such as SOH and battery cycle number, and maps the battery SOH by obtaining the numerical value of the macroscopic signal in practical applications. The equivalent circuit model-based method simulates the battery’s working process with circuit elements such as resistance and capacitance, and identifies model parameters such as resistance through model parameter identification algorithms to estimate the SOH of the battery. The electrochemical model-based method builds the battery’s electrochemical model based on the battery’s internal reaction electrochemical mechanism to estimate the SOH of the battery. Hosseininasab et al. (Hosseininasab et al., 2022) realized the estimation of battery resistance and capacity simultaneously based on the pseudo 2D (P2D) model and observer method, and an iterative approximation method was used to improve the accuracy. Li et al. (Li et al., 2022) proposed a multi-ECM-based SOH estimation method, using electrochemical impedance spectroscopy (EIS) data and the least squares method to identify ECM parameters, achieving high-accuracy SOH estimation considering the effect of environmental temperature. Zhang et al. (Zhang et al., 2021) further improved the estimation accuracy based on a dual-exponential empirical model combined with an extended Kalman particle filter and an autoregressive model. Although model-based methods can obtain high-accuracy SOH estimation results, they tend to face the challenge of model universality, and high-accuracy estimation model is often only applicable to specific batteries under specific operating conditions. Moreover, constructing a high-accuracy battery model is usually difficult and requires a lot of complex electrochemical knowledge. Additionally, the accuracy of the battery model is directly related to its complexity, and high-complexity models are difficult to be implemented for online calculation in on-board BMS with limited computing power.
In recent years, with the development of hardware, computing power has made significant leaps, and various databases have emerged with the development of data acquisition technology (Ma et al., 2022a; 2023). Data-driven methods have become significantly popular. The core of data-driven methods mainly includes two parts: the first part is to extract high-quality features from macroscopic signals that are highly correlated with battery degradation, and the second part is to construct a data-driven model to learn and capture the mapping relationship between features and battery degradation (Ma et al., 2022b).
In terms of feature extraction, it can be divided into direct features and indirect features. Direct features directly use signals such as current, voltage, or temperature as features, or extract some key information from them as features. Gou et al. (Gou et al., 2021) achieved high-accuracy SOH estimation by using extreme learning machine (ELM) and equidistant charging time intervals as features. Lin et al. (Lin et al., 2023) divided the charging voltage range into 25 equal sections and used the charging time of each section as a feature, and realized the SOH estimation of lithium-ion batteries based on Gaussian process regression (GPR). Wang et al. (Wang et al., 2021a) used local tangent space alignment (LTSA) technology for dimensionality reduction and feature extraction of current data, and achieved high-accuracy SOH estimation based on LSTM with an adaptive sliding window. Deng et al. (Deng et al., 2022a) extracted a random capacity increment sequence as a feature based on the random partial charging process and conducted SOH estimation based on the sparse Gaussian regression process, considering real-world applications. Indirect features usually use signal analysis methods as auxiliary means to extract high-quality features. Common methods include incremental capacity analysis (ICA) and DTV. Li et al. (Li et al., 2020) used the ICA method to extract peaks and valleys from the ICA curve as features and further constructed features to propose a multi-time scale framework for the battery SOH estimation. The phase transition inside a battery is often accompanied by a change in energy, which can be further reflected as a change in heat. Compared to other signal analysis methods, DTV analysis method fully utilizes temperature information and can more fully reflect micro phase transitions through macroscopic signals. Wang et al. (Wang et al., 2021b) used the DTV analysis method based on this framework and achieved high-accuracy estimation of SOH based on the GPR algorithm.
For model construction, many machine learning methods have been widely used for SOH estimation of batteries. Jin et al. (Jin et al., 2023) proposed an evolutionary framework-based GPR model that can automatically adjust the kernel function to obtain higher-accuracy SOH estimation. Lin et al. (Lin et al., 2022) used the random forest algorithm to fuse three machine learning algorithms including support vector machine (SVM), multiple linear regression (MLR) and GPR, and further improved the estimation accuracy and robustness through multi-model fusion. Wang et al. (Wang J. et al., 2023) improved feature engineering in machine learning by developing a feature engineering framework that achieves high-precision and robust SOH estimation based on three classic machine learning methods: Support Vector Regression (SVR), Gaussian Process Regression (GPR), and Elastic Net Regression (ENR). Zhao et al. (Zhao et al., 2023) used parameter optimization technology on the traditional machine learning algorithm, optimized the extreme learning machine (ELM) through particle swarm optimization (PSO), and realized the high-precision estimation of the SOH of the vehicle battery pack in the real world. In recent years, with the rapid development of deep learning models, many deep learning methods have also been used to estimate the SOH of batteries. Eddahech et al. (Eddahech et al., 2012) used recurrent neural network (RNN), which is good at solving time series problems, to estimate the SOH of lithium batteries. For the problem of long-term dependence, RNN has the problems of gradient disappearance and explosion. Tong et al. (Tong et al., 2021) used LSTM, a variant of RNN, and introduced dropout technology and Bayesian optimization technology to estimate the SOH of lithium-ion batteries. Shen et al. (Shen et al., 2020) based on deep convolutional neural networks and introduced transfer learning and ensemble learning methods to achieve more accurate and stable SOH estimation with a small amount of data. Many variants of deep learning models have also been proposed to address some of the difficulties in battery state estimation. Deng et al. (Deng et al., 2022b) further improved the estimation accuracy by identifying degradation patterns based on early battery aging data and applying Transfer learning with LSTM network. Wang et al. (Wang et al., 2022) proposed an improved feedforward LSTM to achieve high-precision full life cycle battery SOC prediction by considering changes in input features. Wang et al. (Wang S. et al., 2023) proposed an improved anti-noise ada-ptive LSTM that achieves high-precision RUL prediction by considering changes in multiple influencing factors, combined with multi feature collaboration and adaptive feedback correction methods. Gao et al. (Gao et al., 2023) proposed a Hierarchical Feature Coupled Module LSTM to solve the problem of insufficient utilization of information in the data. Data-driven methods are completely based on data and can establish a mapping relationship between measurable macro signals and battery degradation to achieve nonlinear dynamic modeling while avoiding complex electrochemical mechanism knowledge, which is easier to achieve high-accuracy SOH estimation. Although data-driven methods have many advantages, there are also many problems. The estimation results of data-driven methods are highly dependent on data quality, and the correlation between the extracted features and battery degradation directly determines the estimation accuracy of data-driven methods. Although signal analysis methods can assist in extracting features strongly correlated with SOH, it often requires very cumbersome data preprocessing to obtain high-quality features. At the same time, there are various choices for features. Too many features may contain more detailed information but increase the training cost of the model, while too few features may result in missing information. At the same time, it is also crucial to construct a data-driven model that can more effectively mine the time-series information contained in the features. For the time-series problem of battery degradation, the importance of the information contained in different sequences often varies, and data-driven models usually have the problem of attention dispersion, which leads to a decrease in estimation accuracy.
In response to the aforementioned problems, this paper proposes a SOH estimation method that combines signal analysis methods with data-driven methods. The input features of the deep learning model are extracted through DTV analysis method. DTV analysis can establish the relationship between micro and macro levels during battery degradation process. Feature extraction using DTV analysis can obtain features strongly related to battery aging, and the extracted features have interpretability, thereby improving the accuracy of deep learning models. The LLE method is used to further reduce the number of features and improve feature quality, thus enhancing model efficiency. The LLE method is an unsupervised dimensionality reduction method that is specifically designed for nonlinear data. It can more effectively extract potential features embedded in the data compared to traditional linear dimensionality reduction methods such as principal components analysis (PCA). The data-driven model is built on the Bi-LSTM model, which can capture time-series features in long-term dependency problems better than other models used to solve time-series problems such as RNN and LSTM. The Dropout technique is added to the model to prevent overfitting, and model hyperparameters are automatically optimized using Bayesian optimization techniques. At the same time, AM is added to the model to assign weights, enabling the model to focus on the important parts of the sequence, further improving estimation accuracy. Finally, the proposed method is validated and error analysis is performed using the Oxford University battery degradation dataset. The method proposed in this article can achieve high accuracy and strong robustness in SOH estimation, with a more concise data processing flow and higher model efficiency. In the cyber hierarchy and interactional network (CHAIN) framework, it has the potential for online application in practical scenarios based on a cloud platform (Yang et al., 2020; 2021; Zhang L. S. et al., 2022).
The remaining sections of this article are arranged as follows:
Section 2 describes the battery degradation dataset and feature extraction process.
Section 3 describes the principles and framework of the model and algorithm used in this article.
Section 4 validates and performs error analysis on the proposed method.
Section 5 summarizes the main conclusions of this article.
The battery degradation dataset from Oxford university is used in this paper (Birkl, 2017a; Birkl, 2017b). There are eight batteries which are labeled from #1 to #8. Battery #2, #5 and #6 have problems such as a sudden drop in battery voltage, and these three batteries are finally discarded. Therefore, batteries #1, #3, #4, #7 and #8 are selected for our research. The specific battery test experiment and material information are listed in Table 1 and Figure 1.
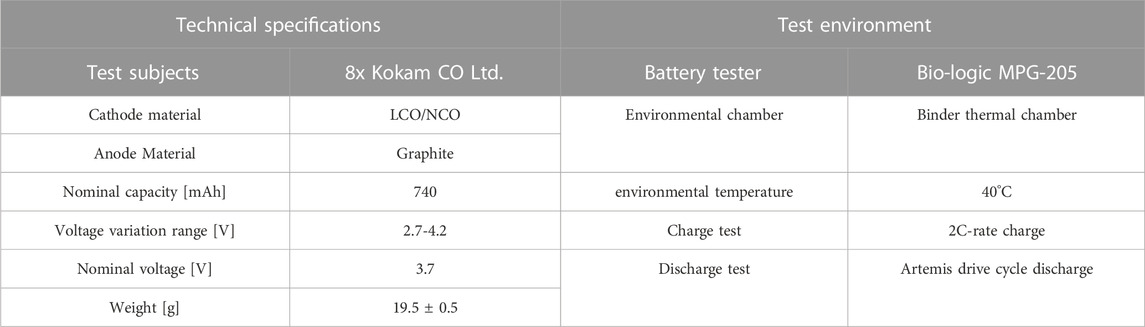
TABLE 1. Test environment and technical specifications of the tested battery.
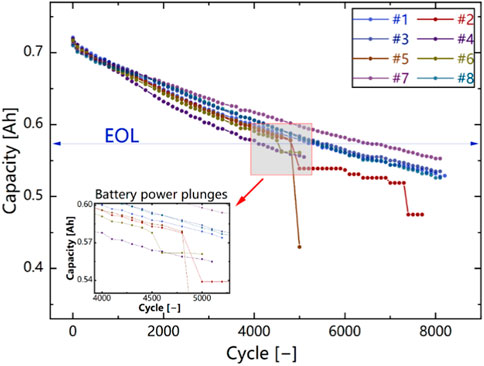
FIGURE 1. Capacity degradation curve and characterization of 8 batteries.
DTV is a signal analysis technology that can mine information related to battery degradation through the change of entropy (Wu et al., 2015; Merla et al., 2016b; Merla et al., 2016a). It is used to judge the battery condition by calculating the differential value of temperature and voltage. It is used to judge the battery condition by calculating the differential value of temperature and voltage. The voltage signal corresponds to the phase transition type. The temperature signal corresponds to the magnitude of energy change, which can reflect the degree of phase transition. The DTV can be calculated as follows:
Where
When collecting signals such as voltage and temperature, noise occurs inevitably. Therefore, data preprocessing is performed first, including fixed sampling intervals and filtering. The sampling interval is selected as the 20 s, while the filter selected is an Savitzky-Golay (SG) filter, which is good at capturing peaks and valleys in the curve and is suitable for application in DTV analysis.
The SG filter can be described as follows:
Where
Figure 2A shows the original DTV curve and the DTV curve after data preprocessing. It can be seen that after resampling, the DTV curve has undergone significant denoising. However, there is still some noise in the curve, which can cause interference during feature extraction. After filtering with SG filter, a smooth DTV curve was obtained, which can ensure the accuracy of feature extraction. Figure 2B shows the trend of the DTV curve as the battery ages. It can be seen that there are two obvious peaks and one valley in the DTV curve, which are closely related to the microscopic phase transition during battery degradation. As the battery ages, the peak value of the DTV curve gradually decreases and the peak position gradually shifts towards high potential. The valley value gradually increases, and the valley level gradually shifts towards low potential. It can be seen that there is a significant correlation between the evolution of the curve and battery degradation. Therefore, based on DTV analysis methods, features strongly related to battery degradation can be extracted.
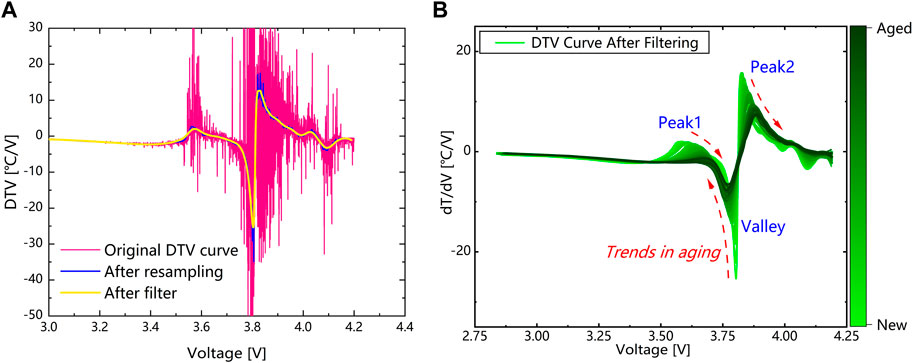
FIGURE 2. DTV curve (A) Data processing process. (B) Degradation evolution characteristics of DTV curve.
In this section, different features are extracted based on DTV analysis, and the feature extraction are described in detail below. The correlation analysis method can test whether there is a significant correlation between the variables, thus helping to select the features. The Pearson correlation analysis can be described as follows:
where x and y are the variables.
The peaks and valleys in the DTV curve are closely related to the microscopic phase transitions in the battery reaction, and there will be significant shifts as the battery ages. In DTV analysis, the usual choice is to focus on the information of peaks and valleys, and often feature the values of peaks and peak positions. We extracted the information of two peaks and one valley in the DTV curve as features and extracted a total of six features. The correlation analysis results are shown in Table 2.
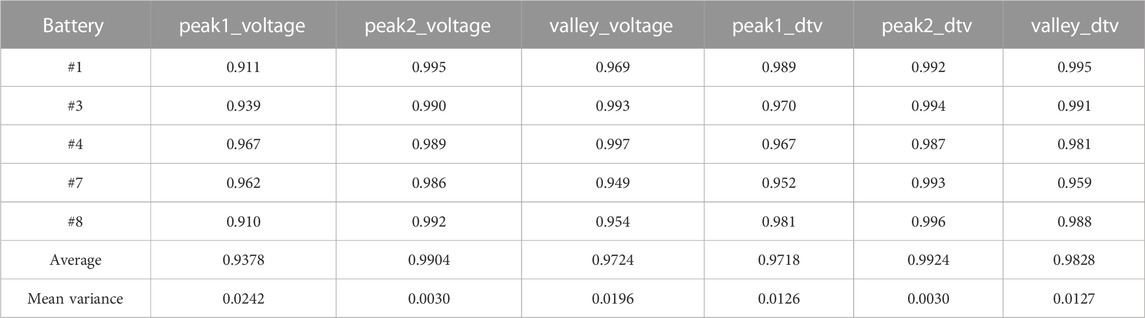
TABLE 2. Absolute Pearson correlation coefficient between peak-valley feature values and SOH.
It can be seen that the correlation between the features extracted from the peak and valley of DTV and SOH is very high. Considering the average value of variance and correlation coefficient, peak2_voltage, peak2_dtv and valley_dtv are selected as peak-valley features.
Although the features extracted from DTV peaks and valleys can establish a good relationship with battery degradation and combining them with data-driven methods has the potential to achieve high-accuracy estimation, the extraction of peak-valley features requires a large amount of data preprocessing and multiple filtering to obtain high-quality features, which leads to overly cumbersome and complex data processing processes. At the same time, the number of extracted features is large, and selecting a small number of features from them can lead to the loss of information, while multiple features can significantly increase the training cost of the model, resulting in reduced model efficiency. Therefore, this paper proposes a method for extracting features using LLE technology, which can obtain high-quality features containing important information through simple data preprocessing, while also reducing the number of features to 1, greatly improving the efficiency of the model.
LLE is a nonlinear reduction method that maps high-dimensional data into low-dimensional space while preserving local structural information of the data. And even if the data is linear, LLE can better capture the structure of the data by preserving the local relationships between the data, thus achieving better dimensionality reduction. The process schematics of the LLE method is shown in Figure 3.
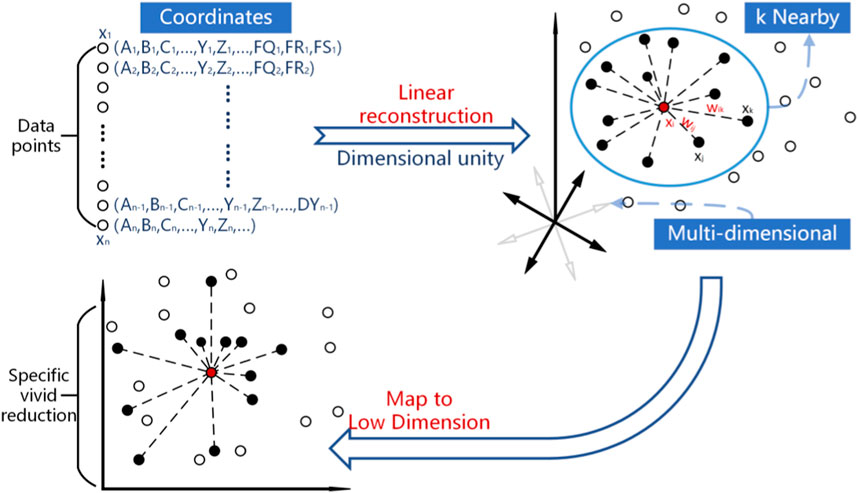
FIGURE 3. Process schematics of the locally linear embedding method.
The specific calculation process of LLE is as follows:
expression 5-9 is the process of solving the weight matrix:
Corresponding to the second to m + 1 smallest eigenvalues of M, the eigenvector
where
In LLE, the number of nearest neighbors k is an important parameter that determines the size of the neighborhood used in calculating local linear relationships. Choosing an appropriate value of k allows the data after dimensionality reduction to retain more information about the original data and thus better reflect the essential characteristics of the data. The empirical method often used to determine k values suggests setting k at 10%–20% of the sample size of the original data. This range generally avoids over-fitting while preserving data information. Alternatively, visualization methods are a commonly used method for determining k values. Correlation analysis can be used to observe the effect of data dimensionality reduction at different k values and select the most appropriate k value. The process is shown in Figure 4.
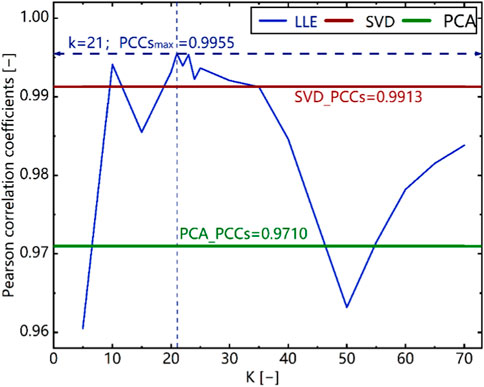
FIGURE 4. Results of correlation visualization of different dimension reduction methods.
PCA and singular value decomposition (SVD) are two commonly used data dimensionality reduction and feature extraction techniques. PCA is often based on eigenvalue decomposition, and is a linear data dimensionality reduction technique. SVD is a matrix decomposition technique based on singular value decomposition, which can effectively extract features containing a large amount of information, remove unwanted noise, and greatly reduce the number of features. Section 4.2 compares the effect of feature extraction using LLE with that using PCA and SVD techniques.
Figure 5 shows the feature extraction process. First, screen out the Outlier in the DTV data, and complete the data by interpolation to make the DTV data of each cycle have the same length. Then, the DTV data of each cycle is used as input for feature extraction using data dimensionality reduction methods. The data dimensionality reduction methods used LLE, SVD and PCA methods, respectively. Finally, through LLE and SVD methods, a unique feature can be extracted from the data in each cycle, that is, the information in each cycle is compressed to a single value. The PCA method requires obtaining three features to ensure correlation. In Section 4, a comparison will be made between the estimation results using features extracted through data dimensionality reduction methods and the estimation results using peak valley information as features.
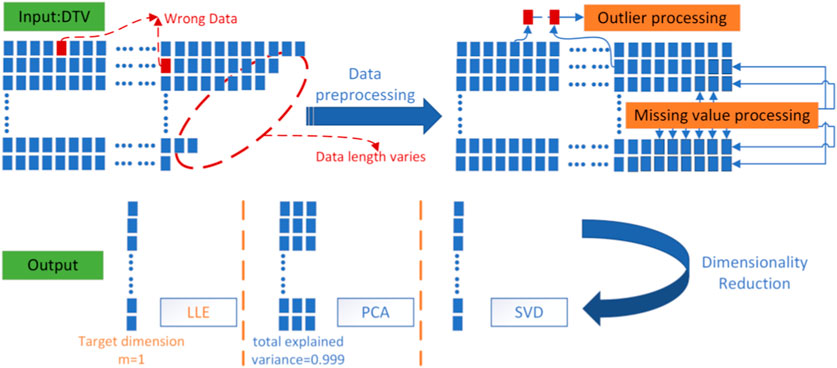
FIGURE 5. Pre-processing and down-dimensional flowchart of high-dimensional data.
Bi-LSTM is an improvement of the traditional LSTM. LSTM belongs to the category of recurrent neural networks, which are capable of processing sequential data and capturing sequential long-term dependencies. LSTM has a memory unit as its core, which contains input gates, forgetting gates, and output gates that control the flow of information. Bi-LSTM is composed of forward LSTM and backward LSTM which can consider both past and future information of the input sequence. The forward LSTM processes the input sequence in forward time order and the backward LSTM processes the input sequence in backward time order. At each time step, both the forward LSTM and the backward LSTM output a vector, and these two vectors are concatenated as the output of the Bi-LSTM.
The structure of the LSTM and Bi-LSTM are shown in Figure 6.
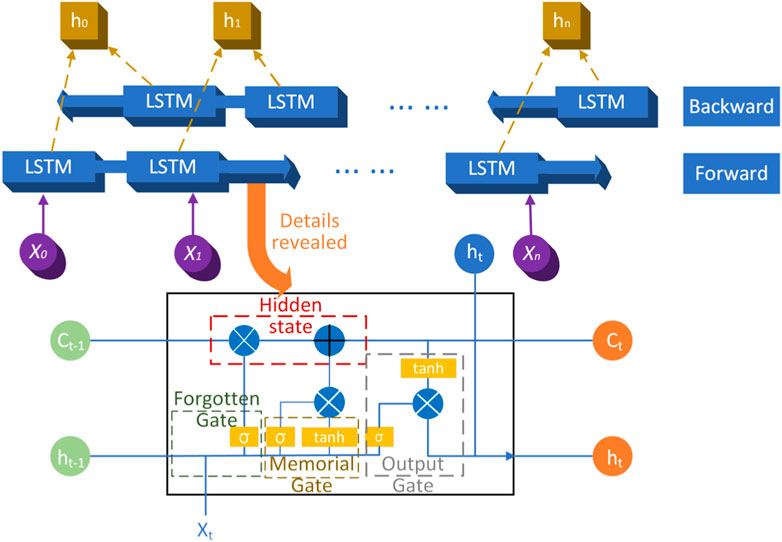
FIGURE 6. BiLSTM overall framework and specific LSTM cell structure.
The weights and biases of the BiLSTM are the forward LSTM, the backward LSTM, and the bias of the output layer, respectively. The final output vector is computed as the weight of the hidden states. Specifically, let the input sequence be
where
The importance of features at different locations in the feature sequence on the results varies. AM distinguishes the importance of different positions in the sequence by assigning weights, and learns and integrates the attention levels corresponding to different sequences during model training. The diagram of AM is shown in Figure 7. The expression for calculating AM is given by:
where
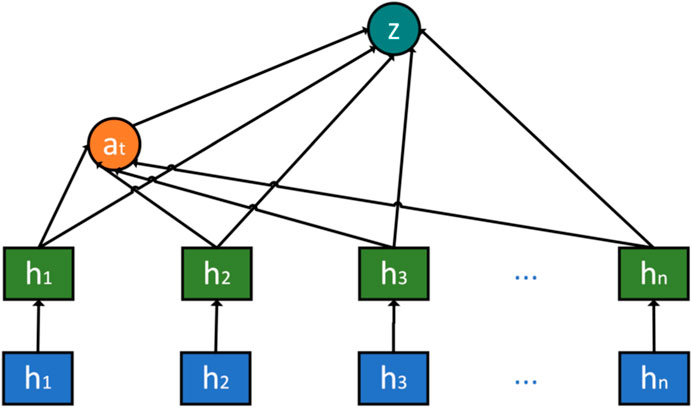
FIGURE 7. Attention mechanism diagram.
The structure of the SOH estimation model is shown in Figure 8. The model mainly consists of input layer, Bi-LSTM layer, dropout layer, Bi-LSTM layer, dropout layer, attention layer and output layer. The data is first constructed into a time series format. Firstly, construct the input data into a two-dimensional matrix based on a certain time series length L, and then construct M two-dimensional matrices into a three-dimensional tensor, where M is the batch size. The constructed three-dimensional tensor is a time series. The time series is input through the input layer, and then is extracted through a two-layer Bi-LSTM for temporal features. Dropout technology is added to prevent overfitting. Dropout technology deletes nodes in the network and their connections with other nodes with a certain probability, so as to avoid excessive weight of a node and prevent overfitting. Then, attention levels at different sequence positions in the feature are learned through the attention layer. Finally, the final estimation result is output through the output layer. The output layer is composed of a dense layer, and the sigmoid is added as an activation function. During the training process, the RMSprop algorithm is used to train the model to accelerate convergence speed and estimation accuracy and the bayesian optimization technique is used to automatically optimize model hyperparameters. Bayesian optimization technology is a commonly used hyperparameter automatic optimization technology. The objective of Bayesian optimization technology is to find the extreme point of the objective function. Each time a new hyperparameter is tried, it will refer to the results of the previous time. Compared with grid method, it can greatly improve the training efficiency of the model and the performance of the model. The optimized hyperparameter include the number of nodes of the BiLSTM layer, learning rate and drop out rate. In practical applications, the model is first trained through a large amount of data, and the training is done offline. The trained model can be applied online, and the collected signals can be used for online estimation. At the same time, this model can also be combined with the deployment of end cloud collaborative systems on the cloud side for online estimation, ensuring real-time performance.
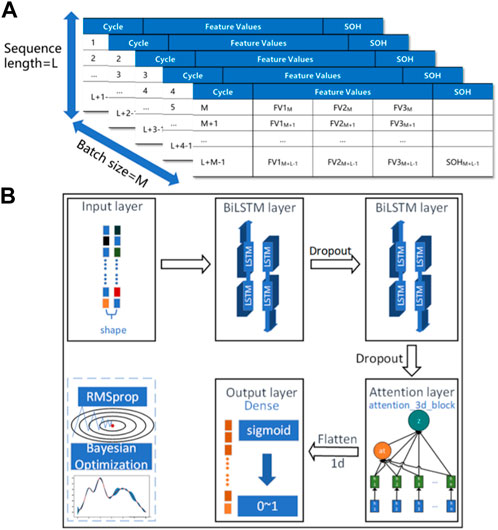
FIGURE 8. Overall architecture of the data-driven model. (A) Time series construction. (B) Structure of the data-driven model.
In this section, the accuracy and robustness of the proposed method are validated and error analysis is performed. The dataset is split into 50% for training and the remaining 50% for testing. Firstly, the proposed model is compared with other models that are good at handling time series problems. Then, the LLE method used for feature extraction in this study is compared with the peak-valley feature method and other feature extraction methods. Finally, the proposed method is validated on all batteries and the robustness of the method is tested by setting different start cycles. The mean absolute error (MAE) and RMSE are used as the evaluating indicator.
In this subsection, the proposed model is compared with other models that are good at handling time series problems, including RNN, LSTM, gate recurrent unit (GRU) and 1D-convolutional neural network (1d-CNN). The features used are the peak-valley information in DTV. Figure 9 shows the comparison between the estimated results and the true values, where the scatter plot represents the true SOH values and the line plot represents the estimateed results. Table 3 summarizes the estimation errors. The RMSE of all models’ estimations is below 0.5%, and the MAE is below 0.4%, indicating that the DTV analysis method can effectively reflect the micro-phase change in the battery degradation process on a macroscopic scale and has a strong correlation with battery degradation. RNN has the worst accuracy, with RMSE and MAE of 0.5% and 0.39%, respectively. This is because RNN has certain flaws in dealing with long sequence problems, which can lead to gradient vanishing and explosion problems. LSTM and 1D-CNN have similar estimation results, with RMSE and MAE of about 0.28% and 0.22%, respectively, which is about 44% better than the error of ordinary RNN. LSTM, as a variant of RNN, has a huge advantage in dealing with long sequence problems compared to ordinary RNN. GRU is a simplification of LSTM, sacrificing some accuracy but improving the training efficiency of the model. Bi-LSTM is a further optimization based on LSTM, with stronger ability to mine time series features. The Bi-LSTM model performs better than other models, with RMSE and MAE of 0.27% and 0.21%, respectively. The addition of AM can further improve the accuracy, with RMSE and MAE of 0.25% and 0.19%, respectively, and error improvement of 7.4% and 9.5%, respectively. This indicates that the addition of AM can focus the model on the more important parts of the sequence and better mine the information related to battery degradation contained in the features.
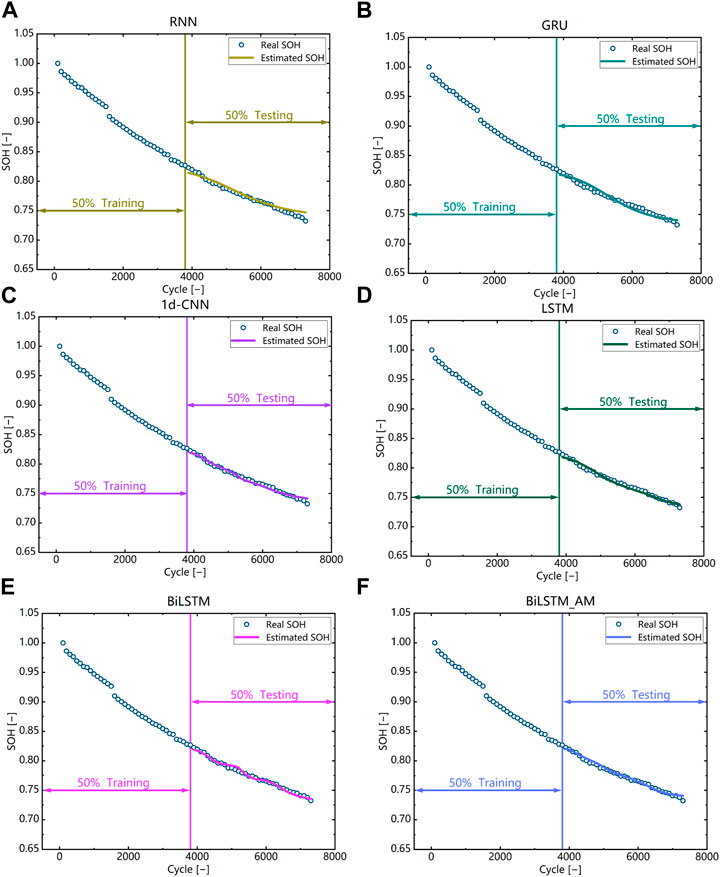
FIGURE 9. Comparison with different deep learning models based on battery #1. (A) RNN (B) GRU (C) 1d-CNN (D) LSTM (E) Bi-LSTM (F) Bi-LSTM-AM.
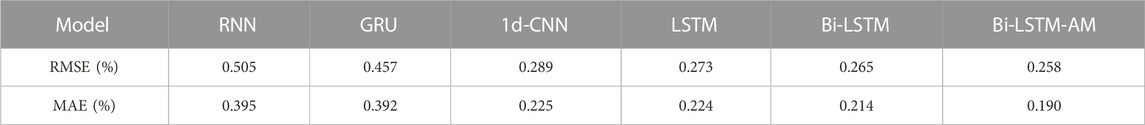
TABLE 3. RMSEs and MAEs of SOH estimation results for different deep learning models.
In this subsection, the feature extraction method proposed in this paper is compared with other feature extraction methods. Figure 10 shows the comparison results of different feature extraction methods and the SOH estimation model selected Bi-LSTM-AM with the best performance proved in Section 4.1. It can be seen that using the LLE method for feature extraction has significantly higher accuracy compared to the PCA and SVD methods. The estimation errors of using PCA and SVD are both over 0.5%, while the RMSE and MAE of using LLE are 0.3% and 0.24%, respectively. This indicates that LLE, as a nonlinear dimensionality reduction method, can more effectively capture key information in the data, and compared to the other two methods, LLE can maximize the preservation of local structure information. It is also noted that the estimation accuracy of using LLE to extract features is slightly inferior to that of using peak-valley information as features. This is because LLE is directly used for feature extraction of the raw DTV signal without data preprocessing, while peak-valley feature extraction involves more data preprocessing. However, the RMSE and MAE of the two methods only differ by 0.05% and 0.06%, respectively, which is a very small difference. If LLE is applied to DTV data that has undergone the same tedious data preprocessing as peak-valley feature extraction, the difference would be reduced to only 0.003%. This indicates that although there is inevitable information loss in using the LLE method for feature extraction, the difference in accuracy is minimal, and it can significantly reduce the number of features and simplify the data preprocessing process, thereby greatly improving the efficiency of the entire model.
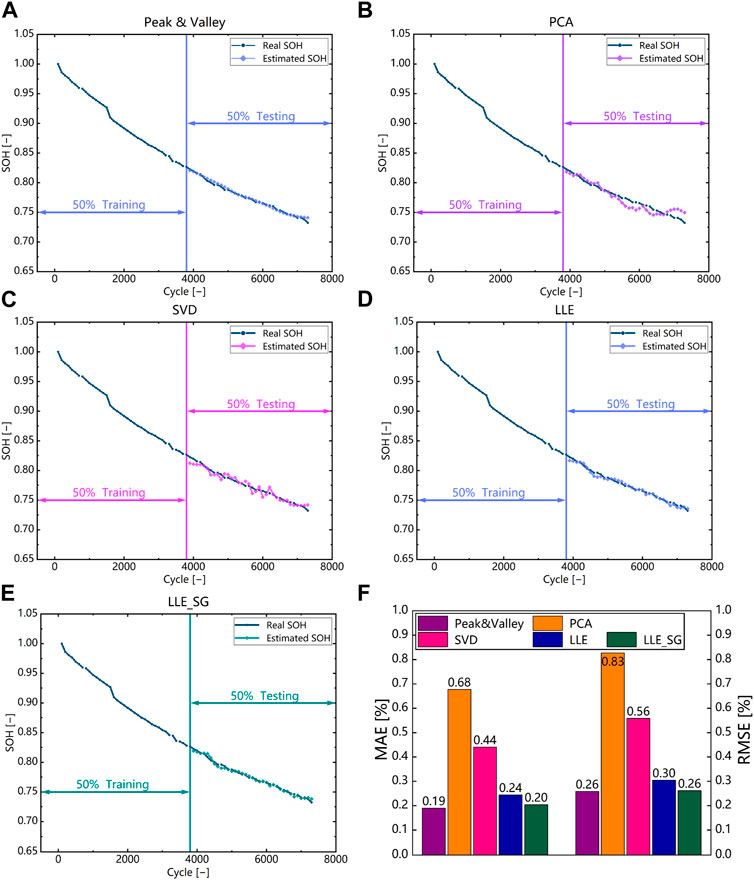
FIGURE 10. Comparison with different feature extraction methods based on battery #1. (A) Peak-valley (B) PCA (C) SVD (D) LLE (E) LLE on preprocessed data (F) Histogram of RMSE and MAE results for different feature extraction methods.
In this subsection, the proposed method is validated on all batteries and the robustness of the method is tested on all batteries. Robustness refers to the ability of a model to maintain its performance stability under abnormal conditions. In actual application, complete battery data may not be available, and some data may be missing. The robustness experiment in this paper uses different starting points to estimate SOH throughout the entire lifespan, in order to simulate the deviation of actual input and training feature distributions, and thus verify the robustness. The specific approach is to artificially remove the first 20% of the data to simulate different startup cycles. Figure 11 shows the verification results of the proposed method on other batteries and the RMSE and MAE are shown in Table 4. It can be seen that the proposed method achieved high estimation accuracy on all batteries, with RMSE and MAE of around 0.4%. Note that the estimation error of Battery #3 is relatively large compared to other batteries, which is caused by the inconsistency of the battery. Figure 12 shows the results of the robustness verification. It can be seen that the proposed method has stable and reliable performance under different start cycles, with RMSE and MAE of around 0.3% and 0.2%, respectively. Compared with the situation of 0 start cycles, the estimation error of RMSE and MAE is only about 0.05%, which indicates that the proposed method has stable and reliable performance under different battery start cycles.
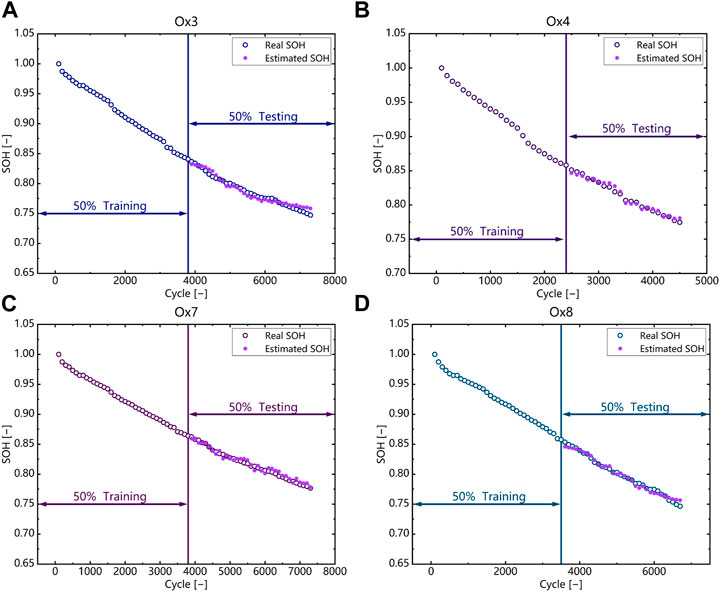
FIGURE 11. Validation results of SOH estimation on other batteries. (A) Battery #3 (B) Battery #4 (C) Battery #7 (D) Battery #8.

TABLE 4. RMSEs and MAEs of SOH estimation results for different batteries.

FIGURE 12. Validation of robustness. (A) Estimation result for battery #1. (B) Estimation result for battery #3. (C) Estimation result for battery #4. (D) Estimation result for battery #7. (E) Estimation result for battery #8. (F) Histogram analysis of RMSE and MAE for five batteries.
Overall, the proposed method can achieve high-accuracy SOH estimation on the basis of greatly reducing the number of features and simplifying the data preprocessing process, while having strong robustness, excellent estimation accuracy and higher efficiency.
In this subsection, the proposed method is validated using the battery aging dataset from MIT–Stanford–Toyota Research Center. The battery material system used in this data set is Lithium iron phosphate system, which is different from the ternary system used in the Oxford University battery aging data set, and can better verify the generalization performance of the method proposed in this paper. Batteries with battery numbers # 22, # 36, and # 44 were selected for validation. # 36 and # 44 batteries have the same aging life, while # 22 has different aging life. Figure 13 shows the estimated results. It can be seen that the method proposed in this paper still achieves high estimation accuracy on the battery of Lithium iron phosphate material system, and the RMSE and MAE of the prediction results are within 0.8% and 0.7% respectively. Specifically, for battery 36, the predicted RMSE and MAE are both within 0.3%, the estimation accuracy is significantly higher than that on the other two batteries, which is due to inconsistency between the batteries. In this subsection, the calculation time of the algorithm proposed in this article is also summarized. Based on A100-PCIE-40GB GPU, the Bayesian optimization time is 24,571.68634 s, the model training time is 623.9118 s, and the estimated time is 1.9719 s. The training time of the model is relatively long, and in practical applications, the training is based on offline completion. The estimated time is within 2 s, which can meet the real-time requirements of online applications.
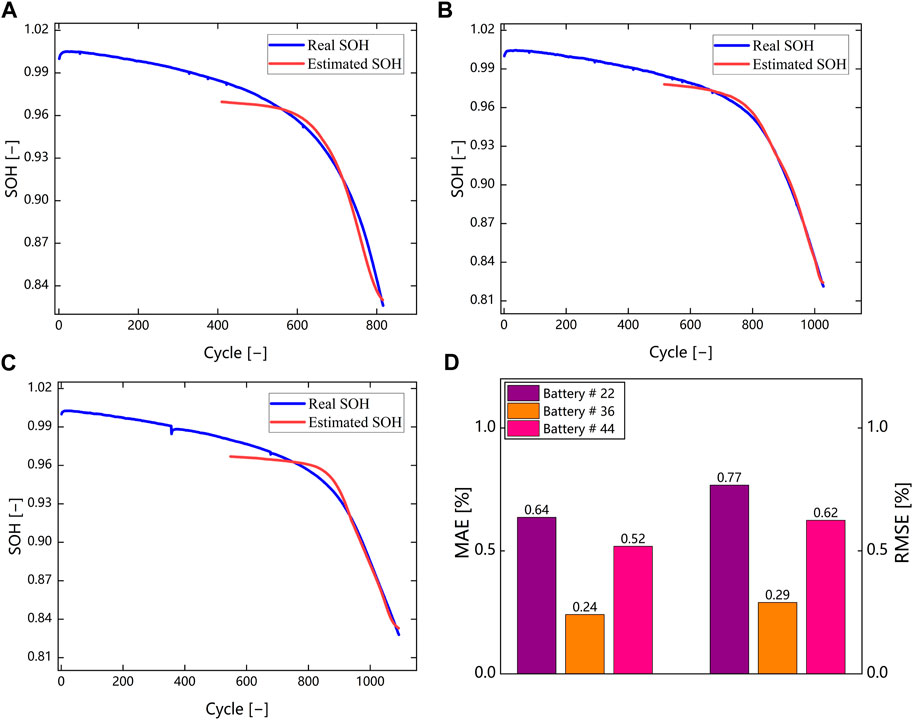
FIGURE 13. Validation of lithium iron phosphate battery. (A) Estimation result for battery #22. (B) Estimation result for battery #36. (C) Estimation result for battery #44. (D) Histogram analysis of RMSE and MAE.
Table 5 summarizes the comparison between the work in this article and other works, all of which were completed based on the Oxford University dataset. It can be seen that in most cases, the method proposed in this article has higher accuracy. Liu et al. (Liu et al., 2023) estimated SOH based on reconstructed feature series (RFS) and combined with Attention based CNN GRU (AB CNN-GRU) network. Bamati et al. (Bamati and Chaoui, 2023) further integrated the extracted features using the exponential moving average method and estimated SOH based on the non-linear autoregressive with exogenic input (NARX) network. Xu et al. (Xu et al., 2023) extracted features based on the Stacking based ensemble learning model using voltage, temperature, and IC curves. Lin et al. (Lin et al., 2022) fused three classic machine learning models, SVM, MLR, and GPR, and conducted SOH estimation based on multi feature analysis of voltage, temperature, and IC curves. The prediction results of these works have higher errors than the methods proposed in this paper. The Polak-Ribière-Polyak conjugate gradient (PRPCG) algorithm optimized broad learning system method used by Gu et al. (Gu et al., 2022) achieved better results on battery #3, but the predicted results on other batteries had much higher errors than the method proposed in this article, which was caused by the inconsistency of the batteries. Gong et al. (Gong et al., 2022) extracted features based on voltage and estimated SOH using LSTM-back propagation (BP) neural network. The accuracy of this work is higher than that of the method proposed in this paper. This is due to the work was validated through cross validation, while this article was trained using half of the data from a battery. The training data volume for this work is much higher than that used in this article. Overall, compared to other works, the method proposed in this article has higher accuracy. Meanwhile, most of the work is more complex in feature extraction and model complexity. Compared to this, the method proposed in this paper has a simpler process and higher efficiency.
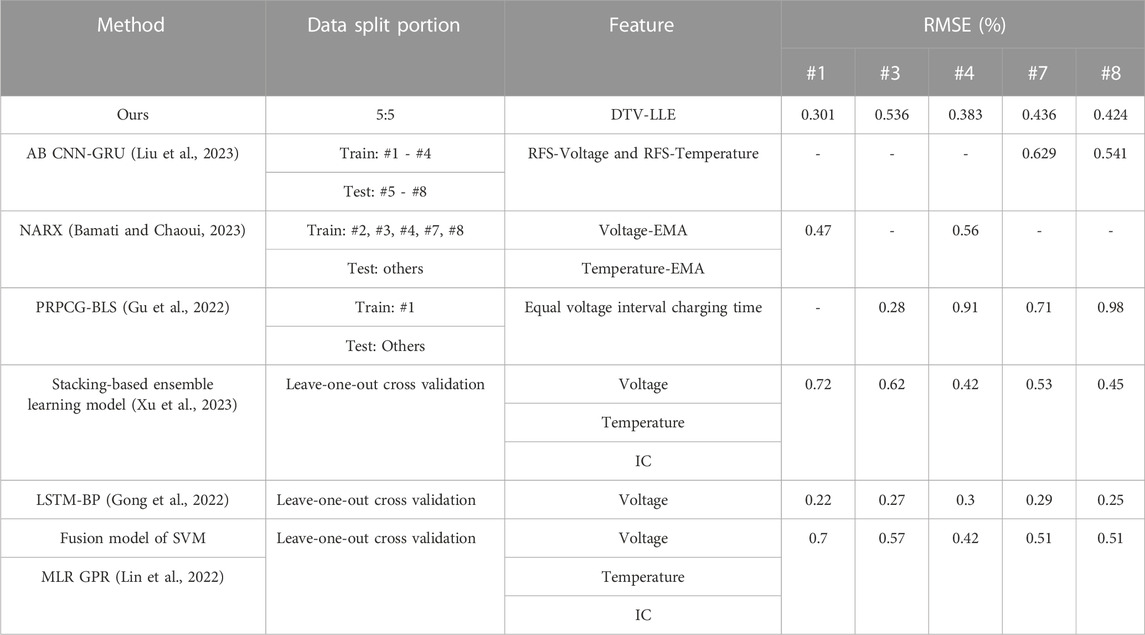
TABLE 5. RMSE of SOH estimation result.
This paper proposes a data-driven method for highly accurate SOH estimation of lithium-ion batteries. Feature extraction is conducted based on DTV analysis. After data cleaning, fixed sampling intervals, and filtering, the peak-valley information is extracted as features and then the Pearson correlation analysis is used for feature selection. The LLE method is used for feature extraction directly on the raw DTV data without any data preprocessing. The selected features are constructed in a time series format and input into a deep learning model for training. The deep learning model includes two Bi-LSTM layers and dropout technology is applied to prevent overfitting. Hyperparameters are automatically optimized through Bayesian optimization technology. AM is added to assign different weights to the sequence. Finally, the proposed method is validated and error analysis is performed based on the Oxford University dataset. The results show that the proposed method can achieve high-accuracy and strong robustness SOH estimation while simplifying the data processing flow and improving model efficiency. The RMSE and MAE of the estimation results are around 0.4%.
The main contributions of this paper are as follows: 1) The signal analysis method and the data-driven method are integrated, and high-quality features are extracted based on the signal analysis method and input into the deep learning model to achieve high-precision SOH estimation. 2) The DTV analysis method can make full use of the entropy change information accompanying the microscopic phase change inside the battery, and establish the connection between the microphase change and the macroscopic signal of battery degradation. High-quality features that are highly correlated with battery degradation can be obtained through DTV analysis. 3) The method based on DTV analysis and LLE feature extraction can extract high-quality features through simple data preprocessing while reducing the number of features and further improving model efficiency. And the attention mechanism is added to the deep learning model to assign weights to the important parts of the features. 4) The model has high accuracy and robustness, with the RMSE of estimation results within 0.5%, and has stable and reliable performance under different start cycles. The proposed method can achieve high-accuracy SOH estimation, with a simpler data processing flow and higher model efficiency.
In combination with the CHAIN framework, cloud BMS and end-cloud collaboration framework, the proposed method has the potential for further online application and achieving high-accuracy and real-time battery SOH estimation in practical applications. The Feature engineering in this paper is not fully automated, and some manual operations are not conducive to online applications. At present, the implementation platform of the entire method is a computer. In the future, algorithms will be further optimized based on practical applications, and algorithms will be ported to embedded systems for more comprehensive method validation.
The original contributions presented in the study are included in the article/Supplementary material, further inquiries can be directed to the corresponding author.
WW, BZ, and LZ contributed to the conceptualization of the study. LZ, WW, and GY contributed to the methodology of the study. WW and BZ contributed to the soft support of the study. WW, LZ, and HY contributed to the validation of the study. GY, BZ, and ML contributed to the investigation and resources of the study. GY wrote the first draft of the manuscript. WW, KY, PJ, WH, YZ, BZ, and KY contributed to the manuscript revision. BZ, ZY, and WH contributed to the supervision of the study. All authors contributed to the article and approved the submitted version.
Author ML was employed by the company China First Automobile Group Corporation.
The remaining authors declare that the research was conducted in the absence of any commercial or financial relationships that could be construed as a potential conflict of interest.
All claims expressed in this article are solely those of the authors and do not necessarily represent those of their affiliated organizations, or those of the publisher, the editors and the reviewers. Any product that may be evaluated in this article, or claim that may be made by its manufacturer, is not guaranteed or endorsed by the publisher.
Bamati, S., and Chaoui, H. (2023). Developing an online data-driven state of health estimation of lithium-ion batteries under random sensor measurement unavailability. IEEE Trans. Transp. Electrification 9, 1128–1141. doi:10.1109/TTE.2022.3199115
Birkl, C. (2017a). DPhil_thesis. Oxford, England: University of Oxford.Diagnosis and prognosis of degradation in lithium-ion batteries
Deng, Z., Hu, X., Li, P., Lin, X., and Bian, X. (2022a). Data-driven battery state of health estimation based on random partial charging data. IEEE Trans. Power Electron 37, 5021–5031. doi:10.1109/TPEL.2021.3134701
Deng, Z., Lin, X., Cai, J., and Hu, X. (2022b). Battery health estimation with degradation pattern recognition and transfer learning. J. Power Sources 525, 231027. doi:10.1016/j.jpowsour.2022.231027
Eddahech, A., Briat, O., Bertrand, N., Delétage, J. Y., and Vinassa, J. M. (2012). Behavior and state-of-health monitoring of Li-ion batteries using impedance spectroscopy and recurrent neural networks. Int. J. Electr. Power Energy Syst. 42, 487–494. doi:10.1016/j.ijepes.2012.04.050
Gao, M., Bao, Z., Zhu, C., Jiang, J., He, Z., Dong, Z., et al. (2023). HFCM-LSTM: A novel hybrid framework for state-of-health estimation of lithium-ion battery. Energy Rep. 9, 2577–2590. doi:10.1016/j.egyr.2023.01.109
Gao, X. L., Liu, X. H., Xie, W. L., Zhang, L. S., and Yang, S. C. (2021). Multiscale observation of Li plating for lithium-ion batteries. Rare Met. 40, 3038–3048. doi:10.1007/s12598-021-01730-3
Gong, Q., Wang, P., and Cheng, Z. (2022). A data-driven model framework based on deep learning for estimating the states of lithium-ion batteries. J. Electrochem Soc. 169, 030532. doi:10.1149/1945-7111/ac5bac
Gou, B., Xu, Y., and Feng, X. (2021). An ensemble learning-based data-driven method for online state-of-health estimation of lithium-ion batteries. IEEE Trans. Transp. Electrification 7, 422–436. doi:10.1109/TTE.2020.3029295
Gu, T., Wang, D., and Li, Y. (2022). A polak-ribière-polyak conjugate gradient algorithm optimized broad learning system for lithium-ion battery state of health estimation. J. Electrochem Soc. 169, 090512. doi:10.1149/1945-7111/ac8ee0
Hosseininasab, S., Lin, C., Pischinger, S., Stapelbroek, M., and Vagnoni, G. (2022). State-of-health estimation of lithium-ion batteries for electrified vehicles using a reduced-order electrochemical model. J. Energy Storage 52, 104684. doi:10.1016/j.est.2022.104684
Hua, Y., Liu, X., Zhou, S., Huang, Y., Ling, H., and Yang, S. (2021). Toward sustainable reuse of retired lithium-ion batteries from electric vehicles. Resour. Conserv. Recycl 168, 105249. doi:10.1016/j.resconrec.2020.105249
Jin, H., Cui, N., Cai, L., Meng, J., Li, J., Peng, J., et al. (2023). State-of-health estimation for lithium-ion batteries with hierarchical feature construction and auto-configurable Gaussian process regression. Energy 262, 125503. doi:10.1016/j.energy.2022.125503
Li, D., Yang, D., Li, L., Wang, L., and Wang, K. (2022). Electrochemical impedance spectroscopy based on the state of health estimation for lithium-ion batteries. Energies (Basel) 15, 6665. doi:10.3390/en15186665
Li, X., Yuan, C., and Wang, Z. (2020). Multi-time-scale framework for prognostic health condition of lithium battery using modified Gaussian process regression and nonlinear regression. J. Power Sources 467, 228358. doi:10.1016/j.jpowsour.2020.228358
Lin, J., Liu, X., Li, S., Zhang, C., and Yang, S. (2021). A review on recent progress, challenges and perspective of battery thermal management system. Int. J. Heat. Mass Transf. 167, 120834. doi:10.1016/j.ijheatmasstransfer.2020.120834
Lin, M., Wu, D., Meng, J., Wang, W., and Wu, J. (2023). Health prognosis for lithium-ion battery with multi-feature optimization. Energy 264, 126307. doi:10.1016/j.energy.2022.126307
Lin, M., Wu, D., Meng, J., Wu, J., and Wu, H. (2022). A multi-feature-based multi-model fusion method for state of health estimation of lithium-ion batteries. J. Power Sources 518, 230774. doi:10.1016/j.jpowsour.2021.230774
Liu, B., Xu, J., and Xia, W. (2023). State-of-Health estimation for lithium-ion battery based on an attention-based CNN-GRU model with reconstructed feature series. Int. J. Energy Res. 2023, 1–13. doi:10.1155/2023/8569161
Liu, X., Zhang, L., Yu, H., Wang, J., Li, J., Yang, K., et al. (2022). Bridging multiscale characterization technologies and digital modeling to evaluate lithium battery full lifecycle. Adv. Energy Mater 12, 2200889. doi:10.1002/aenm.202200889
Ma, B., Yang, S., Zhang, L., Wang, W., Chen, S., Yang, X., et al. (2022a). Remaining useful life and state of health prediction for lithium batteries based on differential thermal voltammetry and a deep-learning model. J. Power Sources 548, 232030. doi:10.1016/j.jpowsour.2022.232030
Ma, B., Zhang, L., Wang, W., Yu, H., Yang, X., Chen, S., et al. (2022b). Application of deep learning for informatics aided design of electrode materials in metal-ion batteries. Green Energy Environ., doi:10.1016/j.gee.2022.10.002
Ma, B., Zhang, L., Yu, H., Zou, B., Wang, W., Zhang, C., et al. (2023). End-cloud collaboration method enables accurate state of health and remaining useful life online estimation in lithium-ion batteries. J. Energy Chem. 82, 1–17. doi:10.1016/j.jechem.2023.02.052
Merla, Y., Wu, B., Yufit, V., Brandon, N. P., Martinez-Botas, R. F., and Offer, G. J. (2016a). Extending battery life: A low-cost practical diagnostic technique for lithium-ion batteries. J. Power Sources 331, 224–231. doi:10.1016/j.jpowsour.2016.09.008
Merla, Y., Wu, B., Yufit, V., Brandon, N. P., Martinez-Botas, R. F., and Offer, G. J. (2016b). Novel application of differential thermal voltammetry as an in-depth state-of-health diagnosis method for lithium-ion batteries. J. Power Sources 307, 308–319. doi:10.1016/j.jpowsour.2015.12.122
Mou, J., Duan, P., Gao, L., Liu, X., and Li, J. (2022). An effective hybrid collaborative algorithm for energy-efficient distributed permutation flow-shop inverse scheduling. Future Gener. Comput. Syst. 128, 521–537. doi:10.1016/j.future.2021.10.003
Pang, M. C., Yang, K., Brugge, R., Zhang, T., Liu, X., Pan, F., et al. (2021). Interactions are important: linking multi-physics mechanisms to the performance and degradation of solid-state batteries. Mater. Today 49, 145–183. doi:10.1016/j.mattod.2021.02.011
Shen, S., Sadoughi, M., Li, M., Wang, Z., and Hu, C. (2020). Deep convolutional neural networks with ensemble learning and transfer learning for capacity estimation of lithium-ion batteries. Appl. Energy 260, 114296. doi:10.1016/j.apenergy.2019.114296
Tong, Z., Miao, J., Tong, S., and Lu, Y. (2021). Early prediction of remaining useful life for Lithium-ion batteries based on a hybrid machine learning method. J. Clean. Prod. 317, 128265. doi:10.1016/j.jclepro.2021.128265
Wang, J., Zhang, C., Zhang, L., Su, X., Zhang, W., Li, X., et al. (2023a). A novel aging characteristics-based feature engineering for battery state of health estimation. Energy 273, 127169. doi:10.1016/j.energy.2023.127169
Wang, S., Fan, Y., Jin, S., Takyi-Aninakwa, P., and Fernandez, C. (2023b). Improved anti-noise adaptive long short-term memory neural network modeling for the robust remaining useful life prediction of lithium-ion batteries. Reliab Eng. Syst. Saf. 230, 108920. doi:10.1016/j.ress.2022.108920
Wang, S., Takyi-Aninakwa, P., Jin, S., Yu, C., Fernandez, C., and Stroe, D. I. (2022). An improved feedforward-long short-term memory modeling method for the whole-life-cycle state of charge prediction of lithium-ion batteries considering current-voltage-temperature variation. Energy 254, 124224. doi:10.1016/j.energy.2022.124224
Wang, Z., Liu, N., and Guo, Y. (2021a). Adaptive sliding window LSTM NN based RUL prediction for lithium-ion batteries integrating LTSA feature reconstruction. Neurocomputing 466, 178–189. doi:10.1016/j.neucom.2021.09.025
Wang, Z., Yuan, C., and Li, X. (2021b). Lithium battery state-of-health estimation via differential thermal voltammetry with Gaussian process regression. IEEE Trans. Transp. Electrification 7, 16–25. doi:10.1109/TTE.2020.3028784
Wu, B., Yufit, V., Merla, Y., Martinez-Botas, R. F., Brandon, N. P., and Offer, G. J. (2015). Differential thermal voltammetry for tracking of degradation in lithium-ion batteries. J. Power Sources 273, 495–501. doi:10.1016/j.jpowsour.2014.09.127
Xiong, R., Tian, J., Shen, W., Lu, J., and Sun, F. (2023). Semi-supervised estimation of capacity degradation for lithium ion batteries with electrochemical impedance spectroscopy. J. Energy Chem. 76, 404–413. doi:10.1016/j.jechem.2022.09.045
Xu, J., Liu, B., Zhang, G., and Zhu, J. (2023). State-of-health estimation for lithium-ion batteries based on partial charging segment and stacking model fusion. Energy Sci. Eng. 11, 383–397. doi:10.1002/ese3.1338
Yang, S., He, R., Zhang, Z., Cao, Y., Gao, X., and Liu, X. (2020). Chain: cyber hierarchy and interactional network enabling digital solution for battery full-lifespan management. Matter 3, 27–41. doi:10.1016/j.matt.2020.04.015
Yang, S., Zhang, Z., Cao, R., Wang, M., Cheng, H., Zhang, L., et al. (2021). Implementation for a cloud battery management system based on the CHAIN framework. Energy AI 5, 100088. doi:10.1016/j.egyai.2021.100088
You, H., Zhu, J., Wang, X., Jiang, B., Sun, H., Liu, X., et al. (2022). Nonlinear health evaluation for lithium-ion battery within full-lifespan. J. Energy Chem. 72, 333–341. doi:10.1016/j.jechem.2022.04.013
Zhang, L., Liu, L., Gao, X., Pan, Y., Liu, X., and Feng, X. (2022a). Modeling of Lithium plating in lithium ion batteries based on Monte Carlo method. J. Power Sources 541, 231568. doi:10.1016/j.jpowsour.2022.231568
Zhang, L. S., Gao, X. L., Liu, X. H., Zhang, Z. J., Cao, R., Cheng, H. C., et al. (2022b). Chain: unlocking informatics-aided design of Li metal anode from materials to applications. Rare Met. 41, 1477–1489. doi:10.1007/s12598-021-01925-8
Zhang, N., Xu, A., Wang, K., Han, X., Hong, W., and Hong, S. H. (2021). Remaining useful life prediction of lithium batteries based on extended kalman particle filter. IEEJ Trans. Electr. Electron. Eng. 16, 206–214. doi:10.1002/tee.23287
Zhao, X., Hu, J., Hu, G., and Qiu, H. (2023). A state of health estimation framework based on real-world electric vehicles operating data. J. Energy Storage 63, 107031. doi:10.1016/j.est.2023.107031
Keywords: state of health, deep learning, attention mechanism, differential thermal voltammetry, locally linear embedding
Citation: Wang W, Yang G, Li M, Yan Z, Zhang L, Yu H, Yang K, Jiang P, Hua W, Zhang Y, Zou B and Yang K (2023) State-of-health estimation for lithium-ion batteries based on Bi-LSTM-AM and LLE feature extraction. Front. Energy Res. 11:1205165. doi: 10.3389/fenrg.2023.1205165
Received: 13 April 2023; Accepted: 28 July 2023;
Published: 09 August 2023.
Edited by:
Asim Mumtaz, University of York, United KingdomReviewed by:
Zhongwei Deng, University of Electronic Science and Technology of China, ChinaCopyright © 2023 Wang, Yang, Li, Yan, Zhang, Yu, Yang, Jiang, Hua, Zhang, Zou and Yang. This is an open-access article distributed under the terms of the Creative Commons Attribution License (CC BY). The use, distribution or reproduction in other forums is permitted, provided the original author(s) and the copyright owner(s) are credited and that the original publication in this journal is cited, in accordance with accepted academic practice. No use, distribution or reproduction is permitted which does not comply with these terms.
*Correspondence: Bosong Zou, em91Ym9zb25nQGNzdGMub3JnLmNu
Disclaimer: All claims expressed in this article are solely those of the authors and do not necessarily represent those of their affiliated organizations, or those of the publisher, the editors and the reviewers. Any product that may be evaluated in this article or claim that may be made by its manufacturer is not guaranteed or endorsed by the publisher.
Research integrity at Frontiers
Learn more about the work of our research integrity team to safeguard the quality of each article we publish.