 Natalia Restrepo
 Jorge M. Uribe2,3
 Montserrat Guillen
- 1Department of Accounting and Finance, Universidad del Valle, Cali, Valle del Cauca, Colombia
- 2Faculty of Economics and Business, Open University of Catalonia, Barcelona, Catalonia, Spain
- 3Department of Econometrics, University of Barcelona, Barcelona, Catalonia, Spain
The global energy transition to low-carbon technologies for transportation is heavily dependent on lithium. By leveraging advances in time-series econometrics we show that lithium prices (carbonate and hydroxide) have recently experienced market explosive behaviors, particularly from 2016 to mid-2018, and in most lithium markets also from October 2021 to December 2022, thus, the global lithium markets are currently experiencing explosive dynamics. These explosive episodes are accompanied by market corrections and extreme uncertainty which, in the case of lithium, may put at risk the future continuous supply needed for manufacturing lithium-based batteries for the electric vehicle. Governments and private stakeholders could reduce uncertainty imposed by these unpredictable dynamics, for instance, by establishing public stabilization funds and setting up capital buffers that help to diversify operational and market risks induced by future price reversals. Such funds should be ideally located in portfolios, such as the global stock markets or other energy commodities, which exhibit idiosyncratic explosive dynamics unsynchronized with the episodes observed in lithium markets.
1 Introduction
Lithium is a critical mineral that serves as a cornerstone for the global energy transition towards low-carbon transportation (Greim et al., 2020; Zhao and Baker, 2022). Its extensive applications in the energy sector, particularly in lithium-ion (Li-ion) batteries for electric vehicles (EVs), as well as in consumer electronics and starting-lighting-ignition systems, have made it increasingly significant (Department of Energy, 2020; IEA, 2020; VTO, 2020; Han et al., 2022; Lima and Feijão, 2022; Zhao et al., 2022). The adoption of Li-ion batteries is set to grow in the coming decades due to the escalating need for efficient energy storage solutions in the face of intermittent wind and solar electricity generation. These energy storage solutions involve lithium-ion batteries for grid-scale energy storage applications. Additionally, the EV market is expected to experience exponential growth, especially in China, Europe, and the United States. Analysts project that by 2030, the annual demand for mobility storage will range from 1.5 to 3.0 TW-hours (TWh), approximately four times the size in 2020. In the short term, the demand for light-duty EVs is anticipated to dominate the projections (Department of Energy, 2020).
While lithium has gained significant importance in the rechargeable battery industry, the dynamics mentioned above have also contributed to the growing demand for lithium, resulting in price fluctuations. Global sales across various markets more than doubled between 2013 and 2018, and projections indicate a four-to five-fold increase by 2030 (Department of Energy, 2020; IEA, 2020).
In terms of suppliers, during the 1990s, the United States held the position of the largest lithium producer, a situation that stands in stark contrast to the current landscape. In fact, in 1995, the U.S. alone contributed to more than one-third of the global lithium production. However, this dynamic shifted in subsequent years, and Chile emerged as the primary producer, experiencing a significant surge in production from the Salar de Atacama, a renowned lithium brine deposit. This transition allowed Chile to claim the title of the leading lithium producer until 2010. Nowadays, 90% of lithium production can be attributed to just three countries: Australia, Chile and China.
In addition to production, lithium supply chain exhibits high concentration levels. For instance, China hosts 60% of the world’s lithium refining capacity for batteries. These levels of concentration in both production and refining can endanger lithium supply and influence upward price trends.
While these trends and future demand forecasts explain the overall positive trend in lithium prices, they fail to account for the remarkable price swings observed during the same period (see Figure 1), despite changes in market fundamentals.
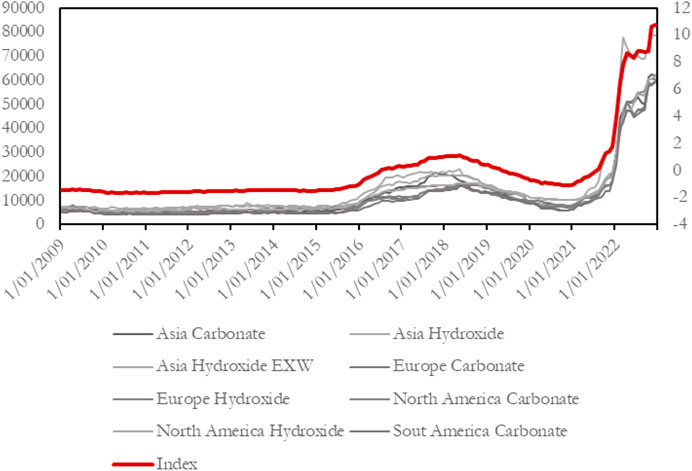
FIGURE 1. Monthly prices in eight lithium markets around the world from January 2009 to December 2022. Note: Prices of eight lithium carbonate and hydroxide in Asia, Europe, North America and South America from January 2009 to December 2022. The red line is the first principal component of the original price series. Source: Own elaboration.
This observation suggests that market prices of lithium may not be effectively conveying the expected information as prices serve as crucial signals in markets, enabling optimal decision-making regarding supply and demand. In the context of lithium, prices provide vital information for lithium producers to determine the necessary investment to ensure the future availability of this raw mineral for its diverse applications in the energy sector.
Similar to other commodities or market assets, lithium prices are susceptible to the occurrence of price “bubbles” or other volatile dynamics. A bubble arises when prices temporarily deviate from market fundamentals. During a bubble, prices become either excessively high (positive bubble) or too low (negative bubble) compared to their expected values based on the forces of supply and demand. Bubbles are often accompanied by market corrections (crashes) and create a climate of extreme uncertainty (Kindleberger and Aliber, 2005). These phenomena can pose risks to entire industries, sectors, and even the overall economy of a region or country. Certainly, the occurrence of a price bubble in a market represents a significant market failure as it results in the inefficient allocation of resources. When prices are artificially inflated, businesses and consumers make decisions based on misleading signals, resulting in possible misallocation of investments. This can result in excessive/insufficient investments in certain assets. For instance, the bursting of the mortgage market bubble in the United States in 2007 resulted in the Global Financial Crisis from 2008 to 2009, impacting the economy on a global scale.
Bubbles can emerge due to various factors, but the primary explanations for bubbles are behavioral, particularly considering recent compelling evidence that challenges the notion of “rational bubbles” (Giglio et al., 2016). Trading activity is influenced by overconfidence and the excessive extrapolation of market trends (Barberis et al., 2018; Bordalo et al., 2020). In the case of lithium, since direct investment in the commodity is not possible, investors can indirectly participate in the lithium market by investing in lithium mining companies (Będowska-Sójka and Górka, 2022). Companies exposed to lithium price fluctuations may have substantial potential for investment returns due to the bubble-like behavior observed in lithium prices. Thus, comprehending the explosive nature of lithium prices is of utmost importance.
Given the importance of closely monitoring price dynamics and understanding the occurrence of bubbles, this study aims to leverage state-of-the-art techniques from time-series econometrics to identify and date bubbles in the lithium market. Specifically, we estimate recursive supremum Dickey-Fuller statistics (Phillips and Shi, 2020) to contrast the statistical hypothesis of a stochastic trend against the alternative of explosiveness, which is characteristic of market bubbles. Our analysis reveals strong empirical evidence supporting the presence of a large bubble in the lithium market from the beginning of 2016 to the mid-2018, and another bubble that started in October 2021 and has not yet ended as of our sample (December 2022).
In addition to the analysis of lithium prices, we analyze the price behavior of representative financial assets such as international market indices and commodities that can be used to diversify risk in a portfolio that considers investments exposed to lithium dynamics. This in order to propose the establishment of a stabilization fund supported by public sources in regions like Europe, the United States, and China, which heavily rely on lithium as a vital component for the decarbonization of their economies, particularly in the transportation sector.
Our findings underscore the importance of closely monitoring price dynamics in lithium markets and highlight the need for innovative approaches to foster market coordination and emphasize the benefits of establishing capital buffers, similar to those commonly found in the financial industry, to provide support to mineral producers and consumers. Moreover, our methodology enables the identification of bubble origination dates in real time, further enhancing our understanding of market dynamics, while highlighting the importance for governments and society to support fundamental and applied research on alternatives to Li-ion batteries (the so-called post-lithium technologies, such as sodium-ion batteries) even when such alternatives might seem, at first glance, too expensive or less than efficient, given the current dominance of the already mature infrastructure of the Li-ion battery’s industry (Duffner et al., 2021).
The remaining of the document is structured as follows. Section 2 provides the theoretical background that underlies the formation of price bubbles. In Section 3, we present the methodology used to analyze the explosive dynamics in lithium prices. Section 4 outlines the data utilized in the analysis and presents the results. In Section 5, we discuss the implications of the findings and propose potential policy recommendations. Finally, in Section 6, we present concluding remarks.
2 Theoretical background
Recent theoretical contributions highlight the role of factors such as price extrapolation, overconfidence, market incompleteness and speculation for explaining market bubbles (Abreu and Brunnermeier, 2003; Shiller, 2015; Barberis et al., 2018; Greenwood et al., 2019; Jang and Kang, 2019; Bordalo et al., 2020). In particular, price extrapolation and speculation may play a major role, judging by the prominent characteristics of historical bubbles, especially those accompanied by excessively optimistic trading observed after the adoption of a new technology such as railroads or the Internet or, in our case, increasingly favorable expectations with respect to the massive adoption of the EV in the markets of Europe, United States and China. Generally, after an economically beneficial innovation is seen accompanied by a sequence of positive news related to fundamentals, traders overinflate their beliefs in the direction of the new state of the world, i.e., positive outcomes are overvalued in expectations while negative outcomes are neglected. This is followed by an increase in price growth which encourages buying which, in turn, leads to further price increments. In this way, prices reach levels substantially above fundamental values. Finally, the bubble collapses when good news becomes marginal and cannot sustain the overpricing any longer (Bordalo et al., 2020). This results in a price crash provoked by the same extrapolative dynamics that contributed to forming the bubbles in the first place, generating dangerous negative bubbles before fundamental equilibrium is reached. One model that helps to articulate the elements outlined above in a slightly different way was proposed by (Abreu and Brunnermeier, 2003) who postulate that, in a market with rational agents, bubbles can emerge as a result of the interaction between behavioral agents and rational arbitrageurs. Behavioral agents base their portfolio decisions on fashions and sentiments and show overconfidence in recent market trends. Rational arbitrageurs base their decisions only on fundamental information, but this information is noisy and, even when rational traders believe the market will eventually collapse; they also want to ride the bubble for as long as it continues to grow and generate abnormally high returns. Rational arbitrageurs would prefer to exit the market before the crash but it is difficult to determine the perfect time to do so. The dispersion in exit strategies and lack of coordination are the causes underlying the bubble origination and persistence. The bubble finally bursts when a sufficiently high number of agents exit the market.
This process is depicted in Figure 2, where t0 corresponds to a given random point at which the commodity price exceeds its fundamental value. From this point onwards, k arbitrageurs become sequentially aware that the price has surpassed its fundamentals until reaching the point t0+ηk. However, some rational arbitrageurs do not know whether they have learned of this information before or after other rational arbitrageurs. Hence, information is not perfect. They face the decision of leaving the market or continuing to ride the explosive dynamics and gain abnormal returns. In this context, a coordination problem arises: the selling pressure only bursts the bubble (stopping the explosive dynamics) when a sufficiently large number of arbitrageurs decide to exit the market. Thus, a sharp change in the price is only possible if a sufficiently high number of agents (or some with a considerable market share) leave the market. At t0+η, all market participants are aware that price dynamics are explosive. However, an exogenous event is necessary to stop the price surge, which is ended at t0+т.
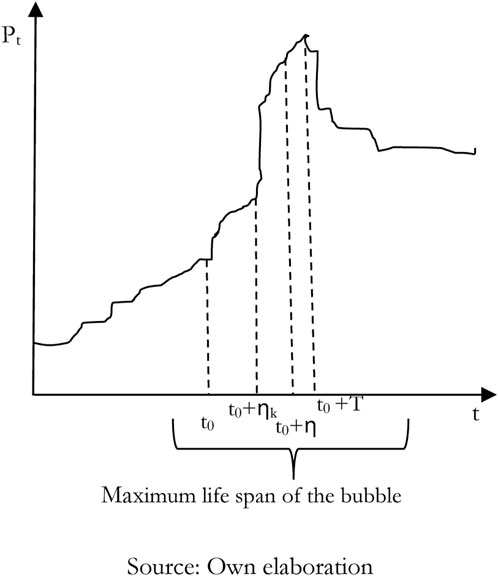
FIGURE 2. Formation and bursting of bubbles. Source: Own elaboration.
3 Methodology
3.1 Bubble detection and dating
(Phillips et al., 2015a; 2015b; Phillips and Shi, 2020) develop a Generalized Sup Augmented Dickey-Fuller (GSADF) method to test for the presence of multiple bubbles and a recursive backward regression technique to date the bubble origination and termination. GSADF tests rely on a recursive series of right-tailed ADF tests where, instead of fixing the starting point of the recursion on the first observation, the window of observations changes its sample size by changing the starting and the endpoints of the recursion on a feasible range of windows (see Figure 3).

FIGURE 3. Sample sequences and window widths of the GSADF test. Source: Own elaboration.
Let us consider the following asset pricing equation:
where
When
where
where
The model specification in Eq. 4 is usually complemented with temporary dynamics in order to test for exuberance, as in standard ADF unit root testing for stationarity. The recursive approach involves a rolling window ADF style regression. Specifically, the rolling window regression sample starts from the
The empirical regression model takes the following form:
where k is the (temporary) lag order. The sample size in the regressions is
Based on extensive simulations, ref (Phillips et al., 2015a; Phillips et al., 2015b) recommend a rule for choosing
The bubble detection test is based on a double recursive test procedure, called backward sup ADF (BSADF) test, which is designed to enhance the identification accuracy of the original statistic. Specifically, the BSADF test performs a sup ADF test on a backward expanding sequence in which the endpoint of each sample is fixed at
The bubble origination date (
Formally, the origination and the ending points of a bubble are estimated according to the following formulae:
where
3.2 Synchronization of bubbles
Novel to the literature, we propose to measure the level of synchronization between different lithium market price’ bubbles and potentially between any other pair of commodities or assets, by means of the following concordance statistic and assuming there is at least one bubble period:
For
When
4 Data and results
4.1 Data and software
We use lithium contract prices for geographic regions retrieved by Benchmark Metals Inc., available at Bloomberg. Such contracts include negotiation prices of lithium carbonate and lithium hydroxide, selected according to their current and future relevance for the electric vehicle (VE). We consider: Asian lithium carbonate, hydroxide-Cost, Insurance and Freight (CIF) Swaps- and hydroxide-Ex Works (EXW) Swap-; European lithium carbonate and lithium hydroxide CIF swaps, North American lithium carbonate and lithium hydroxide CIF swaps, and South America lithium carbonate-Free on Board (FOB) Swap-. Our sample spans January 2009 to December 2022 and consists of monthly observations of the contract prices (168 observations). Table 1 shows lithium price descriptive statistics.
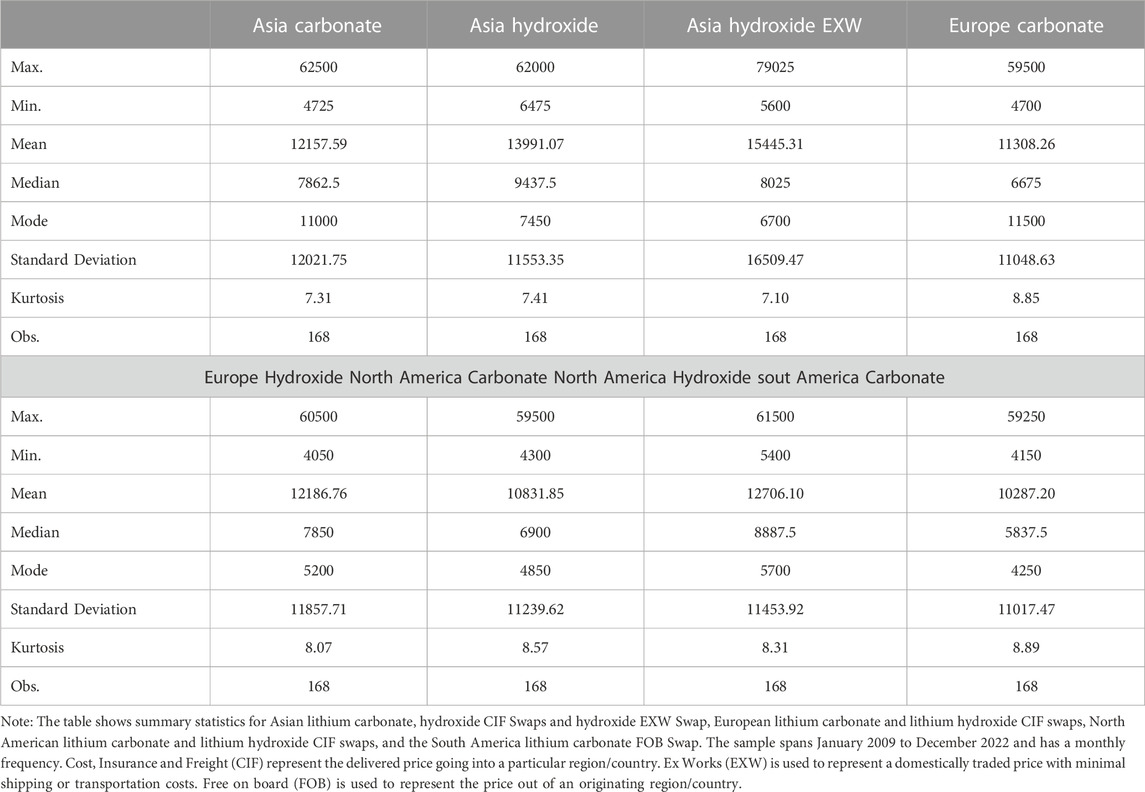
TABLE 1. Lithium swap contracts descriptive statistics (January 2009–December 2022).
All the results were obtained using statistical software R, using the psymonitor package developed by Phillips et al. (2018) and Phillips and Shi (2020).
4.2 Lithium price bubbles
Our findings indicate that the remarkable price surge witnessed in all lithium markets between 2016 and 2018 might be attributed to speculative dynamics and the presence of bubbles. These bubbles may have emerged as a result of market overreaction to fundamental factors, particularly the increased demand for lithium in China driven by the development of electric vehicles (EVs). The duration and persistence of these bubbles vary across different geographical locations and depending on whether the market focuses on hydroxide or carbonate variants of lithium (refer to Figure 3). Furthermore, our results provide clear evidence that lithium markets currently exhibit mildly explosive dynamics characteristic of bubbles.
On the left of Figure 4, the GSADF statistic estimated as in Eq. 11 is plotted. Alongside the statistic, we present the critical values at 90%, 95%, and 99% of confidence (dotted lines). Every month that the GSADF statistic exceeds the critical value, lithium is said to exhibit a price bubble, i.e., to follow mildly explosive dynamics. The right column of Figure 2 shows the lithium contract price path and grey areas correspond to bubble phases at 99% level of confidence.
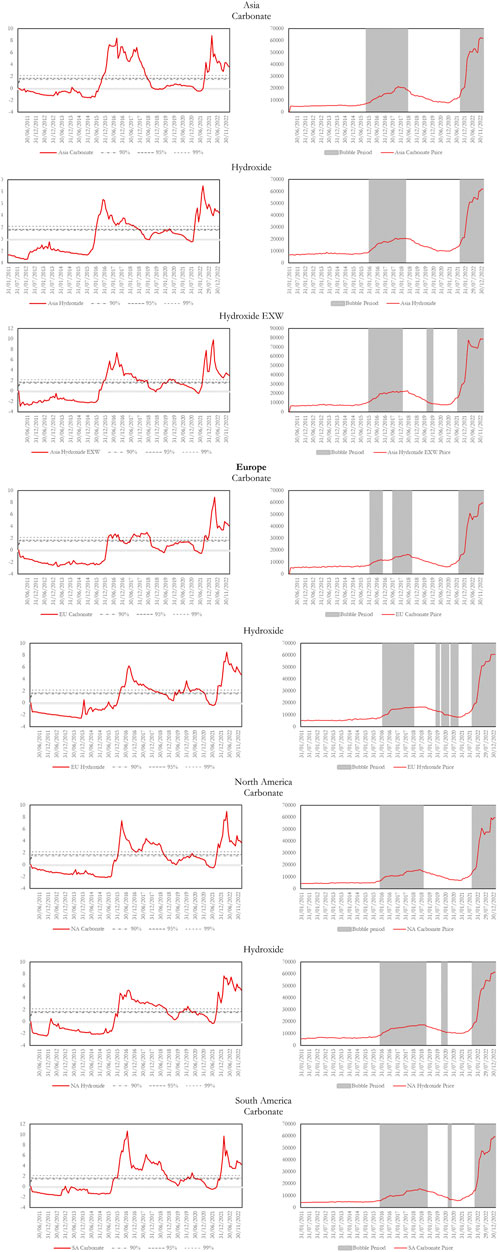
FIGURE 4. GSADF Statistics, Lithium price and explosive periods.
In the Asian market, the three contracts in our sample exhibited explosive dynamics simultaneously; such explosive dynamics are mostly concentrated between 2016 and 2018. For instance, the lithium carbonate price shows an explosive behavior from November 2015 to April 2018 with a total duration of 30 months. In the case of lithium hydroxide EXW, the explosive dynamics took place from January 2016 to December 2017, lasting 24 months. Asia lithium hydroxide exhibits explosive dynamics from February 2016 to March 2018. For all Asian lithium prices, a bubble is detected starting in September 2021 and extending to the end of the sample.
In the European lithium market, both lithium carbonate and lithium hydroxide prices exhibit explosive dynamics with similar duration, albeit in different periods. The lithium carbonate price shows an explosive path from February 2016 to July 2018 (30 months), while lithium hydroxide shows explosiveness from March 2016 to December 2017 for a total 22 months. Both markets show evidence of a bubble from December 2021 until the end of the sample.
Lithium carbonate and lithium hydroxide prices also exhibit explosive paths in the North American market. For lithium carbonate, a bubble lasting 31 months was observed between January 2016 and July 2018. The lithium hydroxide price showed explosive behavior from January 2016 to September 2018 (33 months). The two markets show bubbles starting in October 2021 and extending until the end of the sample.
With respect to the South American lithium market, we analyze the dynamics of lithium carbonate. This price exhibits two bubble periods; the first period extends from January 2016 to October 2018, lasting 34 consecutive months, and the second period of explosive price behavior starts in December 2021 and lasts until December 2022 (end of sample).
In general, lithium prices in all the markets studied exhibit a sustained explosive pattern from the beginning of 2016 (or even late 2015) until year 2018. However, the persistence of explosive dynamics varies between markets and within types of lithium. The longest duration of a lithium bubble was recorded in the South American market (34 months for lithium carbonate). All markets show evidence of a bubble at the end of the sample (almost always starting in October 2021).
Note: On the left of the figure are plotted the GSADF statistics estimated according to Eq. 11, and the test’s critical values at 90%, 95%, and 99% of confidence. When the value of the statistic is greater than the value of the associated critical value, the lithium price is said to experience a bubble phase. Right column: The line corresponds to the lithium contract prices. The grey area corresponds to the period in which, according to the GSADF statistic (left column), the lithium price presented explosive dynamics at 99% confidence level.
4.3 Synchronization of bubbles
In Table 2, we present the concordance statistic between the bubbles of the 8 lithium markets in our sample. As can be seen, the bubbles identified in all 8 markets exhibit a high level of synchronization. There are several pairs for which the concordance statistic reaches 1, meaning that the bubbles identified for the market indicated in the first column of Table 2 occurred at the same time as the bubbles identified in other markets indicated in the first row of the table. For instance, Asia hydroxide bubble coincided 100% of the time with a bubble in Asia Carbonate and in Europe Hydroxide, and 82% of the time with a bubble in Asia EXW. However, the table is not symmetric. Using the same example, we note that the Asia carbonate bubble intercepts with the Asian Hydroxide bubble 91% of the months and with Asian EXW Hydroxide 82% of the times. This occurs because the bubbles do not have the same duration. The minimum value in the table is 57% between Europe Carbonate and Europe Hydroxide, meaning that all markets exhibit a high degree of bubbles’ synchronization.
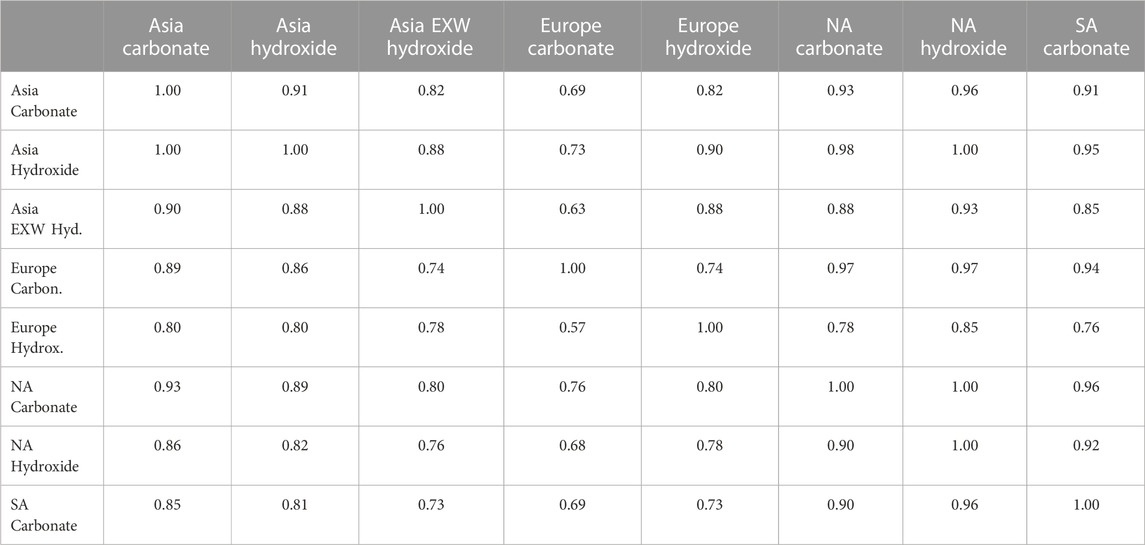
TABLE 2. Concordance statistics between the bubbles identified in the eight lithium markets.
4.4 Other markets and alternative investments for lithium stabilization funds
We test for the presence of bubbles in some global stocks and commodities markets that could serve as investment alternatives in the event that a stabilization fund for the lithium price is established. The analysis is carried out for the same sample period as before. For stock markets, we examine the price dynamics of the American, European and Asian stock markets through the following reference price indices: S&P 500 index, FTSE100 and Eurostock 50 indices, and the Asian Nikkei 225, Hong Kong Hang Seng, and TOPIX indices. In the commodity markets, we analyze exuberant price dynamics of benchmark oil prices, namely, the West Texas Intermediate (WTI) and the Brent blend. We also test for explosiveness of gold and silver spot prices under the assumption that such metals can serve as value reserve in a portfolio.
Our estimates presented in Figure 5 indicate that during the sample period the stock markets indices included in our sample did not experience bubbles, contrary to lithium price dynamics described in the previous section. In terms of commodities, we document explosive behavior for short periods, which do not coincide with explosive price dynamics in any of the lithium markets analyzed before. For instance, the BRENT oil price presents a bubble from November 2014 to January 2015, the gold spot price exhibits explosive behavior from July 2020 to August 2020, and the silver spot price in April 2011.
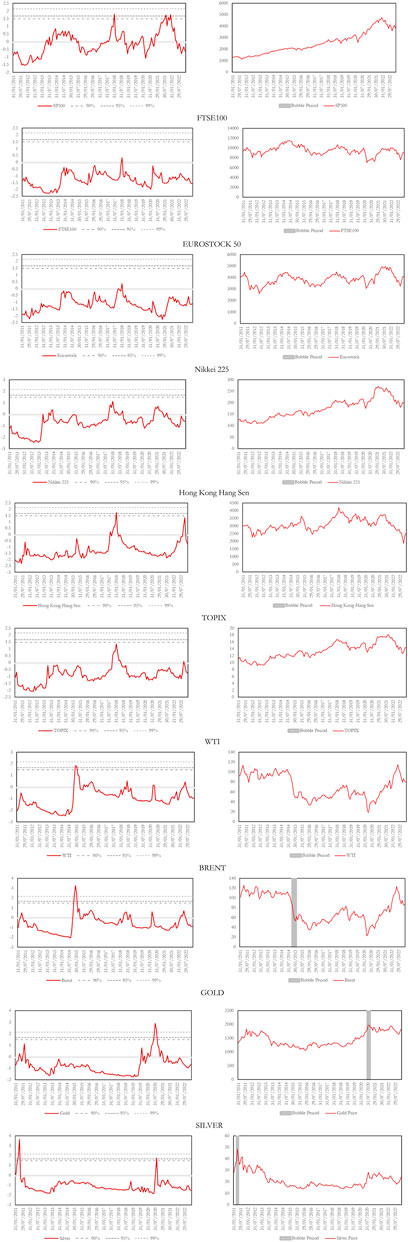
FIGURE 5. GSADF statistics, lithium price stabilization.
Only in the case of European hydroxide, which experienced an overlapping bubble with the short bubble identified in gold, was the concordance statistic different to zero (equal to 4.35%). In all other cases, the synchronization of bubbles from the perspective of lithium markets was estimated at zero.
Note: On the left of the figure are plotted the GSADF statistics estimated according to Eq. 11, and the test’s critical values at 90%, 95%, and 99% of confidence. When the value of the statistic is greater than the value of the associated critical value, the lithium price is said to experience a bubble phase. Right column: the line corresponds to the lithium contract prices. The grey area corresponds to the period in which, according to the GSADF statistic (left column), the lithium price presented explosive dynamics at 99% confidence level.
5 Discussion
Bering in mind the recent literature in which speculation and extrapolative expectations are proposed as the main factors behind bubble formation, in Section 4.1, we examine the debate in the field regarding the existence of bubbles in the market of lithium. Our results clearly favor the hypothesis of a bubble (indeed, several for some lithium prices). Finally, we close this section by offering policy advice and risk management recommendations based on the synchronization results presented at the end of Section 3.
5.1 Bubbles and lithium markets
Our contribution is related to a debate that took place a few years ago in the energy field, and which has been revived in recent years following the significant decline in lithium prices observed from 2018 onwards. Debate that has regained relevance during the second half of 2021, when the new committed political global efforts to fight climate change have been accompanied by a surge in the price of lithium (see Figure 1). On the one hand, a branch of studies attributed a lithium price surge in the mid-2010s to lithium shortages, supply-demand imbalances, and production delays. On the other hand, speculative investors and the appearance of market bubbles have also been blamed for lithium’s price booms. Within the former set of advocates, several questions have been raised about lithium reserves and availability. Such questions involve the possibility of a global lithium shortage, with a supply unable to match a growing demand. The more popular reasons claimed by analysts to explain the rapid price increase include a supply squeeze of the lithium exported to China, growing long-term demand from start-up and established EV manufacturers, and a growing market for portable electronic devices (Miedema and Moll, 2013; Narins, 2017; Sun et al., 2017; Speirs and Contestabile, 2018). In the same vein, it has also been stated that this price surge was due to a consumption–production imbalance (Martin et al., 2017), following a rapid consumption growth of lithium battery applications.
However, the possibility of a lithium shortage has been ruled out by other authors (Jaskula, 2015). According to this view, lithium is readily available on Earth and, furthermore, the world could triple its production from current levels and still have 135 years of supply available using solely known reserves. An alternative explanation suggests the reporting role of the financial press (The Economist, 2016a; The Economist, 2016b; Forbes, 2016), which named lithium as the hottest commodity and documented that its demand was rising spectacularly as well as the demand for lithium-related securities, offering higher than average returns to investors.
5.2 Policy and risk-management in the face of bubbles
Results in Section 4 show that there were bubbles in the 8 lithium prices considered here. Moreover, these bubbles were synchronized with each other, meaning that bubbles across various lithium markets tend to emerge (and burst) simultaneously. This is very inconvenient from a risk management perspective because risk is poorly diversified when simultaneous bubbles originate and collapse in multiple assets or inputs at the same time. Unfortunately, the economics profession has little to say about risk-management when dealing with market bubbles, and even less if such bubbles are highly synchronized with each other. The few advances of the discipline in this direction have focused on trading and on generating models for prediction of market corrections and crashes (Greenwood et al., 2019), but have said little about how to hedge against the risk of bubble inflation and bursting. The literature has traditionally, and consistently, relegated policy action in the face of bubbles to “wait until the market corrects itself”. This was clearly the case after the dot.com bubble of technological firms that ended in 2002 in the United States NASDAQ market. However, the Global Financial Crisis, and the dramatic bursting of the mortgage market bubble that preceded the crisis, pointed to the greater dangers of the “cleaning up the mess” approach only after a bubble has burst. Following the financial crisis, there have been some attempts to provide the means to understand and manage financial bubbles when they appear, mostly from a macroeconomic perspective. More in line with the scope of our study, one of the few studies that has examined those characteristics which make a firm more resilient in the presence of bubbles (Brunnermeier et al., 2020) focuses on financial institutions. It seems that larger banks, a stronger maturity mismatch and higher loan growth tend to make financial institutions, and hence the financial system, more vulnerable to systemic risk as a consequence of market bubbles. Unfortunately, such attributes do not extrapolate to lithium producers and consumers, who belong to a different industry which is considerably less cyclical than banking.
Our approach is different. We stress that the main issue regarding the presence of bubbles in lithium markets is related to the high degree of uncertainty that accompanies their inflation and bursting. Uncertainty is known to reduce investment (Bloom, 2014). When in an uncertain environment, firms optimally decide to delay investment until after uncertainty has passed. In the case of lithium, such a strategy is suboptimal from a societal perspective, given the large implications that a lithium shortage would have for the transition of the transportation sector to a low-carbon technology, especially in Europe, China and the United States. One way to reduce the uncertainty related to lithium prices and future cash flows of lithium producers is by setting minimum prices in advanced for buying lithium, by means of derivative contracts (e.g., options). These minimum prices should be high enough to cover investment expenditures by lithium producers, which are needed to guarantee an increasing supply of lithium in the forthcoming decades. Moreover, in countries relying on Li-ion batteries for their energy transition, stabilization funds could be established that would be used in case spot prices ended up being lower than prices projected by lithium producers. These funds could, in such an event, pay the market differential between the observed spot price at the time of delivery and the contracted price of lithium set at the time of investment in exploration and extraction.
The important question remains as to where these funds should be located. In this case, instead of resorting to a traditional portfolio optimization perspective to solve the problem of capital allocation, we explore some traditional investments, which have historically depicted low synchronization with bubbles in the lithium markets. The general idea is to reduce the presence of simultaneous bubbles in the portfolio (treating lithium as an asset), given the inherent difficulty in forecasting in real time when a bubble will end (Greenwood et al., 2019). In this case, our results highlight the lowest synchronization of bubbles in lithium markets with all traditional portfolios, including stocks, precious metals and oil. The kind of analysis conducted here does not aim to be comprehensive; indeed, other market assets may (and must) be explored. Ideally, where public funds and capital buffers are to be located depends on the specific stakeholder’s asset-liability structure. Our aim is to provide a way of conducting this crucial part of techno-economic analyses which has so far been overlooked.
6 Conclusion
Using recent advancements in time-series econometrics, this study investigates the hypothesis of explosiveness associated with the emergence and collapse of bubbles in various lithium markets over recent decades. The empirical findings provide compelling evidence of the existence of bubbles in all the markets analyzed, with varying durations observed. Specifically, our analysis reveals that the significant price surge observed in lithium markets from 2016 to 2018 can be attributed to speculative dynamics. The duration and persistence of these explosive price dynamics differ across geographical locations and lithium types, such as carbonate or hydroxide. Furthermore, our results indicate that a bubble in lithium prices emerged in October 2021 and persisted until the end of our sample period.
Additionally, a high degree of synchronization is observed in the occurrence of bubbles across different lithium markets. This finding highlights the interconnectedness and common underlying factors driving price dynamics in these markets. Building on this observation, we conduct an analysis of price dynamics for various market indices and commodities that could potentially serve as alternatives for portfolio diversification of lithium investments. Our results suggest that these alternative markets and commodities do not exhibit explosive dynamics that align with the bubbles observed in lithium markets. Therefore, they hold potential as viable options for inclusion in a stabilization fund aimed at mitigating risks associated with lithium investments.
These findings carry significant implications for governments and various private stakeholders who rely on electric vehicles as an alternative to fossil fuel-based transportation. The presence of speculative dynamics in the lithium market, as documented in this study, could hinder access to the mineral for energy developers and jeopardize the widespread adoption of electric vehicles and the advancement of electricity storability, which is crucial for the development of low-carbon societies. Consequently, our results emphasize the importance of closely monitoring lithium prices and implementing effective measures to reduce uncertainty in cash flows for lithium producers. Such measures may include the establishment of stabilization funds backed by public sources, complemented by private initiatives utilizing derivative contracts in the sector and the establishment of capital buffers to ensure the financial stability of lithium producers. Ideally, these funds should be invested in traditional assets, such as stock indexes, which typically do not experience market bubbles simultaneously with lithium, thus diversifying the risk associated with bubble bursts. Overall, findings here call for policy measures able to safeguard the global transition to low-carbon energy transportation which, currently, is heavily dependent on lithium.
While this study sheds light on the existence of bubbles in lithium markets and provides valuable insights on policy implications, there are several limitations to consider. Firstly, the analysis relies on historical price data and does not include directly all the complex factors at play in the lithium market, such as changes in production dynamics and suppliers. Secondly, the study focuses on the identification and characterization of price bubbles, without exploring the underlying causes or predicting future scenarios. Future research could address these limitations by incorporating additional factors, exploring the drivers of bubbles, and considering a more comprehensive range stakeholders, regions and more recent price dynamics. Such research would provide a more comprehensive understanding of the dynamics and risks associated with lithium investments.
Moreover, it is important to note that lithium is not the only metal critical to achieving the renewable energy transition. Other metals like copper, nickel, cobalt, and manganese may also be exposed to similar dynamics. Therefore, monitoring and tracking the prices of these critical metals hold significant importance in the context of the energy transition and present a promising avenue for future research. Bajolle et al., 2022, de Blas et al., 2020, Shi et al., 2023.
Data availability statement
The data analyzed in this study is subject to the following licenses/restrictions: Data were obtained at Bloomberg. The data and programs are available from the authors. Requests to access these datasets should be directed to JU anVyaWJlZ0B1b2MuZWR1.
Author contributions
NR, JU, and MG contributed to conception and design of the study. NR organized the database. NR and JU performed the statistical analysis. NR, JU, and MG wrote the first draft of the manuscript. All authors contributed to the article and approved the submitted version.
Funding
This research was funded the Spanish Ministry of Science and Innovation, FEDER grant PID 2019-105986GB-C21 and NextGenerationEU, grant numbers TED 2021-130187B-I00. MG gratefully received financial support from ICREA under the ICREA Academia Program.
Conflict of interest
The authors declare that the research was conducted in the absence of any commercial or financial relationships that could be construed as a potential conflict of interest.
Publisher’s note
All claims expressed in this article are solely those of the authors and do not necessarily represent those of their affiliated organizations, or those of the publisher, the editors and the reviewers. Any product that may be evaluated in this article, or claim that may be made by its manufacturer, is not guaranteed or endorsed by the publisher.
References
Abreu, D., and Brunnermeier, M. K. (2003). Bubbles and crashes. Econometrica 71, 173–204. doi:10.1111/1468-0262.00393
Bajolle, H., Lagadic, M., and Louvet, N. (2022). The future of lithium-ion batteries: Exploring expert conceptions, market trends, and price scenarios. Energy Res. Soc. Sci. 93, 102850. doi:10.1016/j.erss.2022.102850
Barberis, N., Greenwood, R., Jin, L., and Shleifer, A. (2018). Extrapolation and bubbles. J. Financ. Econ. 129, 203–227. doi:10.1016/j.jfineco.2018.04.007
Będowska-Sójka, B., and Górka, J. (2022). The lithium and oil markets – dependencies and volatility spillovers. Resour. Policy 78, 102901. doi:10.1016/j.resourpol.2022.102901
Bloom, N. (2014). Fluctuations in uncertainty. J. Econ. Perspect. 28, 153–176. doi:10.1257/jep.28.2.153
Bordalo, P., Gennaioli, N., Kwon, S. Y., and Shleifer, A. (2020). Diagnostic bubbles. J. Financ. Econ. 141, 1060–1077. doi:10.1016/j.jfineco.2020.06.019
Brunnermeier, M., Rother, S., and Schnabel, I. (2020). Asset price bubbles and systemic risk. Rev. Financial Stud. 33, 4272–4317. doi:10.1093/rfs/hhaa011
de Blas, I., Mediavilla, M., Capellán-Pérez, I., and Duce, C. (2020). The limits of transport decarbonization under the current growth paradigm. Energy Strategy Rev. 32, 100543. doi:10.1016/j.esr.2020.100543
Department of Energy (2020). Energy storage grand challenge: Energy storage market report. NREL/TP-5400-78461. Golden, CO, United States: National Renewable Energy Lab. doi:10.2172/1908714
Duffner, F., Kronemeyer, N., Tübke, J., Leker, J., Winter, M., and Schmuch, R. (2021). Post-lithium-ion battery cell production and its compatibility with lithium-ion cell production infrastructure. Nat. Energy 6, 123–134. doi:10.1038/s41560-020-00748-8
Forbes, (2016). The Tesla effect: Investors and speculators have a growing interest in lithium. Jersey City, New Jersey, USA: Forbes.
Giglio, S., Maggiori, M., and Stroebel, J. (2016). No-bubble condition: Model-free tests in housing markets. Econometrica 84, 1047–1091. doi:10.3982/ecta13447
Greenwood, R., Shleifer, A., and You, Y. (2019). Bubbles for fama. J. Financ. Econ. 131, 20–43. doi:10.1016/j.jfineco.2018.09.002
Greim, P., Solomon, A. A., and Breyer, C. (2020). Assessment of lithium criticality in the global energy transition and addressing policy gaps in transportation. Nat. Commun. 11, 4570. doi:10.1038/s41467-020-18402-y
Han, X., Garrison, J., and Hug, G. (2022). Techno-economic analysis of PV-battery systems in Switzerland. Renew. Sustain. Energy Rev. 158, 112028. doi:10.1016/j.rser.2021.112028
Jang, J., and Kang, J. (2019). Probability of price crashes, rational speculative bubbles, and the cross-section of stock returns. J. Financ. Econ. 132, 222–247. doi:10.1016/j.jfineco.2018.10.005
Jaskula, B. W. (2015). Minerals yearbooks: Lithium. Reston, Virginia, USA: United States Geological Survey.
Kindleberger, C. P., and Aliber, R. Z. (2005). Manias, panics, and crashes: A history of financial crises. London, UK: Palgrave Macmillan UK.
Lima, D. A., and Feijão, V. R. (2022). Stochastic approach for economic viability of photovoltaic systems with battery storage for big electricity consumers in the regulated market in Brazil. Electr. Power Syst. Res. 205, 107744. doi:10.1016/j.epsr.2021.107744
Martin, G., Rentsch, L., Höck, M., and Bertau, M. (2017). Lithium market research – global supply, future demand and price development. Energy Storage Mater 6, 171–179. doi:10.1016/j.ensm.2016.11.004
Miedema, J. H., and Moll, H. C. (2013). Lithium availability in the EU27 for battery-driven vehicles: The impact of recycling and substitution on the confrontation between supply and demand until2050. Resour. Policy 38, 204–211. doi:10.1016/j.resourpol.2013.01.001
Narins, T. P. (2017). The battery business: Lithium availability and the growth of the global electric car industry. Extr. Industries Soc. 4, 321–328. doi:10.1016/j.exis.2017.01.013
Phillips, P. C. B., Shi, S., and Haven, N. (2018). Real time monitoring of asset markets: Bubbles. New Haven, CT, USA: Cowles Foundation Discussion Paper.
Phillips, P. C. B., and Shi, S. (2020). “Real time monitoring of asset markets: Bubbles and crises,” in Handbook of statistics. Editors Hrishikesh D. Vinod, and C. R. Rao (Amsterdam, Netherlands: Elsevier B.V.), 61–80. doi:10.1016/bs.host.2018.12.002
Phillips, P. C. B., Shi, S., and Yu, J. (2014). Specification sensitivity in right-tailed unit root testing for explosive behaviour. Oxf Bull. Econ. Stat. 76, 315–333. doi:10.1111/obes.12026
Phillips, P. C. B., Shi, S., and Yu, J. (2015a). Testing for multiple bubbles: Historical episodes of exuberance and collapse in the s&p 500: Testing for multiple bubbles. Int. Econ. Rev. Phila. 56, 1043–1078. doi:10.1111/iere.12132
Phillips, P. C. B., Shi, S., and Yu, J. (2015b). Testing for multiple bubbles: Limit theory of real-time detectors. Int. Econ. Rev. Phila. 56, 1079–1134. doi:10.1111/iere.12131
Shi, Y., Feng, Y., Zhang, Q., Shuai, J., and Niu, J. (2023). Does China’s new energy vehicles supply chain stock market have risk spillovers? Evidence from raw material price effect on lithium batteries. Energy 262, 125420. doi:10.1016/j.energy.2022.125420
Speirs, J., and Contestabile, M. (2018). The future of lithium availability for electric vehicle batteries. Green Energy Technol. 35, 35–57. doi:10.1007/978-3-319-69950-9_2
Sun, X., Hao, H., Zhao, F., and Liu, Z. (2017). Tracing global lithium flow: A trade-linked material flow analysis. Resour. Conserv. Recycl 124, 50–61. doi:10.1016/j.resconrec.2017.04.012
The Economist (2016b). Clean Energy - an increasingly precious metal. London, United Kingdom: The Economist. Available at: https://www.economist.com/business/2016/01/14/an-increasingly-precious-metal.
The Economist (2016a). The battery era: A plug for the battery. London, United Kingdom: The Economist. Available at: https://www.economist.com/leaders/2016/01/16/a-plug-for-the-battery.
Vto, (2020). Annual merit review, batteries R&D. Lower Hutt, New Zealand: Vehicle Technologies Office.
Zhao, D., Jafari, M., Botterud, A., and Sakti, A. (2022). Strategic energy storage investments: A case study of the caiso electricity market. Appl. Energy 325, 119909. doi:10.1016/j.apenergy.2022.119909
Keywords: speculative processes, electric vehicle, Li-ion batteries, energy transition, risk analysis
Citation: Restrepo N, Uribe JM and Guillen M (2023) Price bubbles in lithium markets around the world. Front. Energy Res. 11:1204179. doi: 10.3389/fenrg.2023.1204179
Received: 11 April 2023; Accepted: 14 June 2023;
Published: 22 June 2023.
Edited by:
Syed Ahsan Ali Shah, University of Salamanca, SpainReviewed by:
John Graham, Indiana University Bloomington, United StatesSharafat Ali, Nanjing University of Aeronautics and Astronautics, China
Copyright © 2023 Restrepo, Uribe and Guillen. This is an open-access article distributed under the terms of the Creative Commons Attribution License (CC BY). The use, distribution or reproduction in other forums is permitted, provided the original author(s) and the copyright owner(s) are credited and that the original publication in this journal is cited, in accordance with accepted academic practice. No use, distribution or reproduction is permitted which does not comply with these terms.
*Correspondence: Montserrat Guillen, bWd1aWxsZW5AdWIuZWR1