 Zanyu Jin1
 Qing Guan
- 1School of Economics and Management, China University of Geosciences, Beijing, China
- 2School of Information Engineering, China University of Geosciences, Beijing, China
In recent years, international energy investment and energy trade activities have developed rapidly. Because energy has commodity and financial product attributes, there is often a correlation between international energy trade and investment. This correlation has regional specificity due to the uneven geographical distribution of energy production and consumption. The existing literature mainly studies the correlation between the international energy “investment–trade” systems from a macroscopic or microscopic perspective. However, the relationship between them among countries from a mesoscopic perspective has not been fully demonstrated. With the development of economic globalization, we need to pay attention to whether the energy trade model of countries can reflect their preference for choosing investment partners and whether the energy investment model can reflect energy trade cooperation. In this paper, by taking the frontier approach of network motifs, we analyzed the correlation between international energy trade and investment from more than 200 economies worldwide from the macroscopic perspective, microscopic perspective, and local structure from a mesoscopic perspective. Meanwhile, we compared the results of the study in 2018 with those in 2022 to obtain the impact of international events on the international energy “investment–trade” networks. We found that 1) the structures of energy trade and investment networks are similar from a macroscopic perspective, which is the basis for exploring the correlation between energy trade and investment. 2) Bilateral cooperation and transaction transmission are important local structures of energy trade and energy investment activities. 3) The formation of an equal and close local structure among economies in energy trade is more likely to be preferred for investment cooperation, and forming a representative local structure with statistical significance among economies in energy investment is more likely to obtain energy trade cooperation. This work innovatively adopts motifs to study the correlation between energy investment and trade, which can help energy investors predict the direction of investment and provide guidance to governments in formulating energy trade policies.
1 Introduction
Energy is a strategic commodity with financial properties and uneven regional distribution characteristics (Guan et al., 2016). These characteristics trigger international trade and attract transnational investment (Li et al., 2017). The strategic attribute of energy also requires countries to predict their import and export trade volume and investment scale. With the development of economic globalization, energy commodities and energy finance markets are bringing countries closer together. Some countries have become a strong community of shared interests relying on energy trade and transnational investment (Chen et al., 2021). Finding the correlation between energy trade and investment is becoming increasingly crucial for understanding international financial and economic patterns. On reviewing the literature, they were found to be correlated; for example, foreign direct investment in energy would promote import trade (Zhang, 2018). There was a positive correlation between China’s oil industry’s foreign direct investment and oil import and export trade (Mao, 2018), and the motivation for energy investment in some countries was to seek possible energy trade (Xu et al., 2017). Previous studies have revealed the correlation between foreign direct investment and an economy’s energy trade from a single country’s perspective. However, the correlation between the direct and indirect interaction among economies from the holistic perspective needs more research.
Complex networks are used to research trade and economic relationships from a macroscopic perspective. As a critical theory and method for complexity science, it has been successfully applied to the pattern evolution of the world investment and trade networks (Ding et al., 2018), the cascading failure of the international financial and trade networks (Guo et al., 2018), and the relationship between international trade and capital flows (Zhang et al., 2016). Meanwhile, complex networks are also widely used in the energy field. In the field of energy trade, existing studies have focused on the trade cooperation preference of fossil energy (Guan and An, 2017), the pattern of international energy trade (Zhong et al., 2016), and its evolution characteristics (Gao et al., 2015). In the field of energy investment, existing research has focused on the portfolio strategy of the energy futures market (Yin et al., 2020), the investment structure of the energy stock market (Guan et al., 2016), and so on. The existing literature studies the interactions between countries through international trade and cross-border investment, focusing less on the local structural evolution from the mesoscopic perspective. Because the local structure can reflect the individual interaction characteristics at the microscopic perspective and the statistical characteristics of representative local structures from the macroscopic perspective, the mesoscopic perspective can better measure the correlation between energy investment and trade among local subjects in terms of characteristics.
Existing research has focused on the mesoscopic perspective in the energy investment field. Network subgraphs can define local association structures. Network motifs are small-scale isomorphic subgraphs that recur in the network and are statistically significant (Milo et al., 2002). They can explore the typical local structure in the network and attend to the proportion of different forms of the local structure in the network. The three-node subgraph is the most stable structure in the network and plays an essential role in network evolution (Barabasi and Oltvai, 2004). Motifs can study the operation of trade mechanisms (Guan and An, 2019) and the evolution of trade patterns (Guan et al., 2020), the interactive characteristics and the driving forces of carbon emissions between countries (Ma et al., 2019), and differences in information links between multiple investors (Guan et al., 2017). Existing research studies mainly focus on the mechanism of the motifs and the interaction among the economies constituting the motifs, with less research on the correlation among the motifs in different systems. However, as there is a systematic correlation in mesoscopic perspective group evolution, the correlation is also reflected in the mesoscopic perspective network structure. The network motifs can be used to measure the correlation between group evolution.
This paper aims to study the correlation between international energy trade and investment in local structures, with coal, oil, and natural gas as representatives of fossil energy sources. Based on complex network and motif approaches, we analyze the correlation between energy trade and investment from the macroscopic, microscopic, and mesoscopic perspectives. We research the correlation between energy trade and investment from various perspectives, including investment–trade relations and multilateral investment–trade structures.
The remainder of this paper is organized as follows. Section 2 introduces the data source, network modeling, motif detection, and indicators used for correlation testing. Section 3 analyzes the results. Section 4 offers a discussion and conclusion.
2 Data and method
2.1 Data
The data used in this paper come from the United Nations Commodity Trade Statistics (UN Comtrade). We selected data from 2018 to 2022. Because the BvD Osiris database discloses the previous year’s investments at the beginning of each year and is updated annually, the only data we can currently download is that updated to 2022. COVID-19 and the Russo-Ukrainian War have affected international energy markets, so the data from 2018 to 2022 will reflect the change in the international energy “investment–trade” networks. The fossil energy data chosen are from coal, oil, and natural gas, and their HS codes are 2701, 2709, and 2711, respectively. Therefore, three data units were obtained for the article. Each data cell includes the exporting country, importing country, trade type, and trade volume. In order to make overlapping calculations between different energy categories and form a comprehensive fossil energy trade network, this paper uses the U.S. dollar as the unit of measurement for trade volume. When cleaning the data, the data published by the party with an enormous value is selected as the trade volume of the two parties in case the import and export volume of the two parties varies.
The investment data used in the article were collected from one of the most famous worldwide listed company databases—ORISE PUBLICLY LISTED COMPANIES WORLDWIDE, owned by the BvD company. The data of globally listed energy companies in 2018 are selected. The data include the company name, company code, the company’s economics, the name of the shareholder, the BvD ID of the shareholder, and the shareholder’s economies. This paper considers all the shareholding relationships disclosed in the database. According to data processing requirements, duplicate items are excluded. The shareholder’s shareholding relationship with the company is converted into an investment relationship between the shareholder’s economy and the company’s economy.
In 2018, we studied 228 economies, with 121 economies involved in energy investment, 224 economies involved in energy trade, and 117 economies common in the international energy “investment–trade” networks. In 2022, we studied 211 economies, of which 101 are involved in energy investment, 205 in energy trade, and 95 are common in the international energy “investment–trade” networks. A total of 210 economies were involved in the international energy “investment–trade” networks in 2018 and 2022.
As there can be both energy trade transactions and energy investment relationships between a country and another country and there may be some correlation between the two, this paper analyzes the correlation between energy trade and energy investment. This paper uses a two-character abbreviation for each country to ensure consistency in country codes when constructing the network; for example, FR stands for France, and CA for Canada.
2.2 Methods
2.2.1 Complex networks of the international energy “investment–trade” networks
This paper uses complex networks to model trade and investment patterns to explore the correlation between international energy trade and investment.
We define international investment networks as
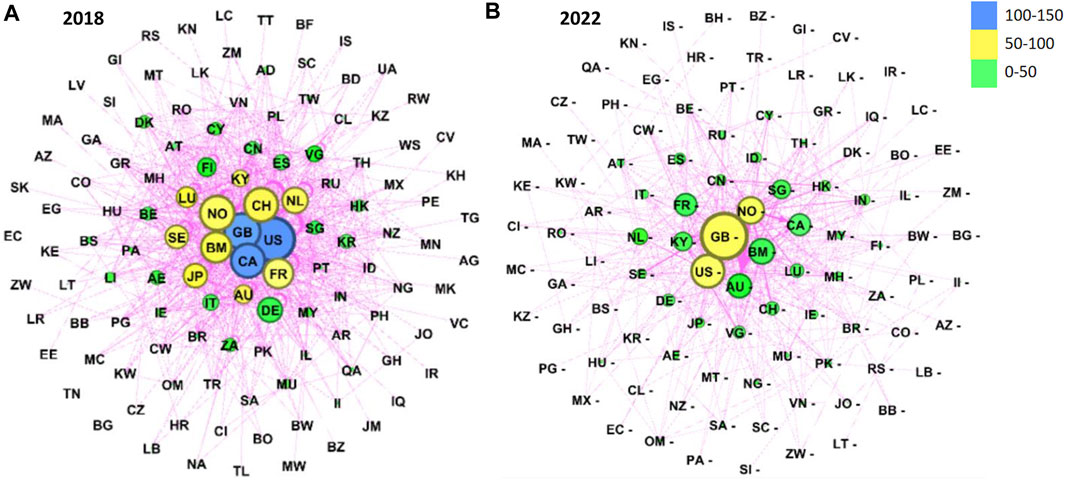
FIGURE 1. International energy investment network. (A) International energy investment network in 2018. The size and color of the dots are used to distinguish the scale of the degree, while the color of the lines is used to distinguish the investment network from the trade network. (B) International energy investment network in 2022.
We define international trade networks as
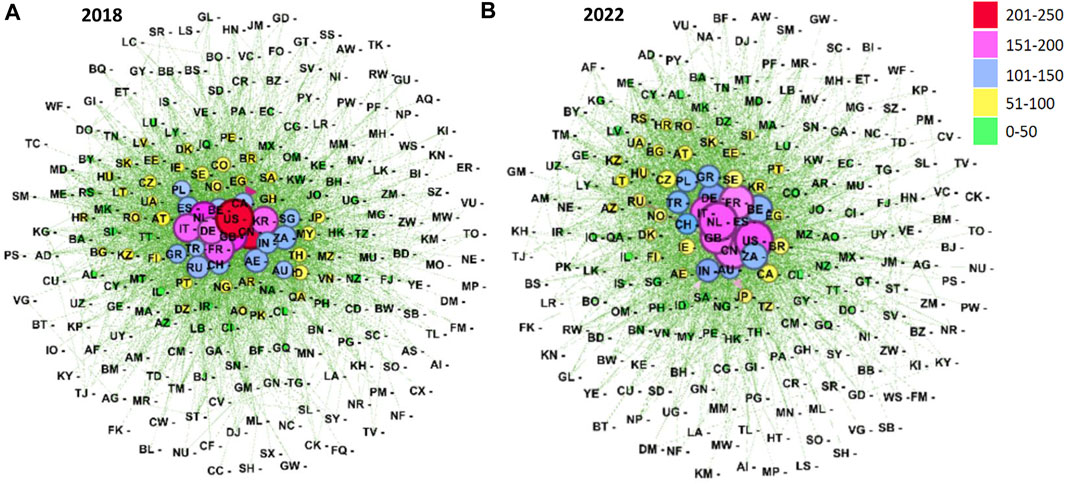
FIGURE 2. International energy trade network. (A) International energy trade network in 2018. The size and color of the dots are used to distinguish the scale of the degree, while the color of the lines is used to distinguish the trade network from the investment network. (B) International energy trade network in 2022.
2.2.2 Network indicators
Complex networks have some fundamental indicators that can measure the network attributes from the global perspective. In this article, two indicators, network distance and network graph density, are selected.
The network distance refers to the maximum value of the shortest distance between any two nodes in the network. If the distance of the network diameter is small, the economies have closer investment or trade relations with each other. It can be defined (Wasserman et al., 1994) as follows:
where
Network graph density is the ratio of the actual number of connected edges to the number of possible connected edges in a network, which can reflect the closeness of the connection between nodes in the network. It can be defined (Watts and Strogatz, 1998) as follows:
where
In this paper, the topological characteristics of trade and investment networks are measured using four centrality indicators, considering the network node level, to characterize the position of each economy in the network and to find those economies that occupy a unique role in both networks. The first indicator is the degree centrality of a node. The degree centrality of a node measures the number of other nodes that are directly connected to it. The higher the degree centrality of a node, the more central the node is in the network and the more power it has. It can be defined (Freeman, 1978) as follows:
where
The second indicator is the betweenness centrality of a node. The betweenness centrality of a node measures the ratio of the shortest paths through the node to all the shortest paths, indicating the number of shortest paths held by the node. It measures the degree of control a node has over the network’s resources and reflects the importance of an economy as a “bridge” in an investment or trade network (Wasserman et al., 1994). It can be defined as follows:
where
The third indicator is the closeness centrality of nodes. The closeness centrality of a node measures the node’s “distance” from all other nodes in the network. It is the ability of a node not to be controlled by other nodes (Freeman, 1978). It can be defined as
where
The fourth indicator is the eigenvector centrality of a node. The eigenvector centrality of a node measures the node’s importance in the network, which increases as the node becomes more closely related to other important nodes. It measures a node’s influence across the network (Freeman, 1978; Watts and Strogatz, 1998) and can be defined as
where
2.2.3 Network motifs
Network motifs reflect the local structural characteristics of the network in a modular way. In portraying the functional qualities of the network and identifying the structural evolution in the network, local structural features can play a better role than global structural features by focusing on the statistically significant connections among nodes in the network and the evolution patterns of the connections from the microscopic association patterns of the network (Shen-Orr et al., 2002).
Three-node motifs are the most basic subgraphs in networks. Existing studies show that the motifs of four or more nodes can be formed by the superposition and combination of three-node motifs through different forms (Shen-Orr et al., 2002). Therefore, identifying three-node motifs can satisfy the mining of local features of international investment and trade networks. The main characteristics of the three-node motifs are that the connected edges between nodes are directional and the connected edges do not consider weights. There are 13 possible connecting ways, as shown in Figure 3.
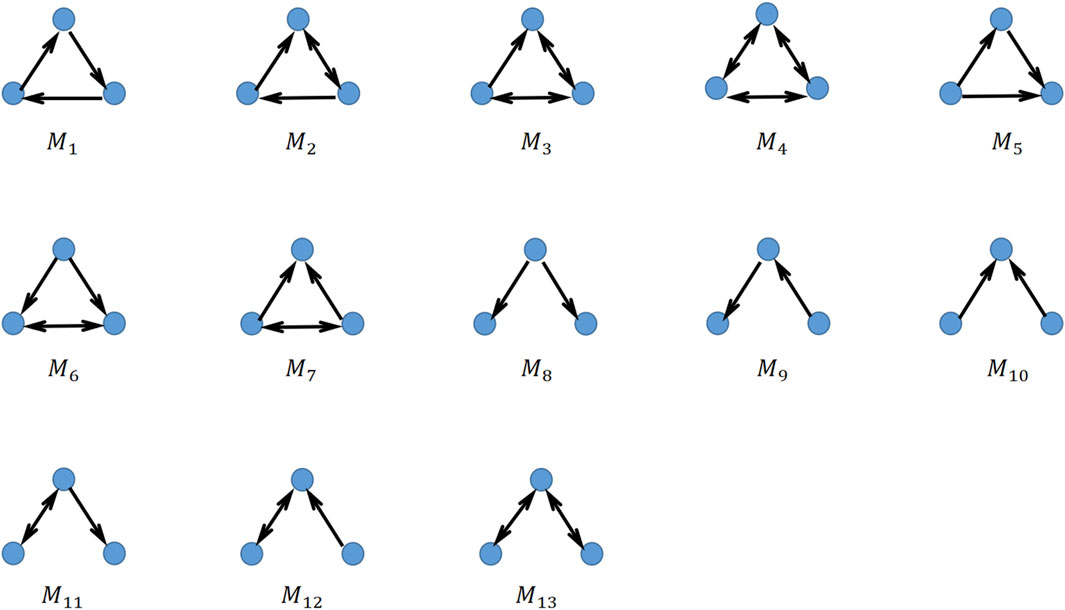
FIGURE 3. 13 types of three-node motifs.
Motif
P-value is the number of subgraph
The smaller the p-value, the more statistically significant the motifs are in the actual network.
Z-score is also used to measure the statistical significance of network motifs in real networks compared with those in random networks. Z-score can be defined as
where
2.2.4 Probabilistic correlation of motifs and edges
If there is a correlation between the international energy investment network and the international energy trade network, it can be reflected through the structure that the country nodes that form the significant motifs in one network have a stronger tendency to connect edges in the other network. This paper uses the conditional probability method to measure this tendency (Gneiting and Katzfuss, 2014). If nodes A and B represent two positions in motif
where
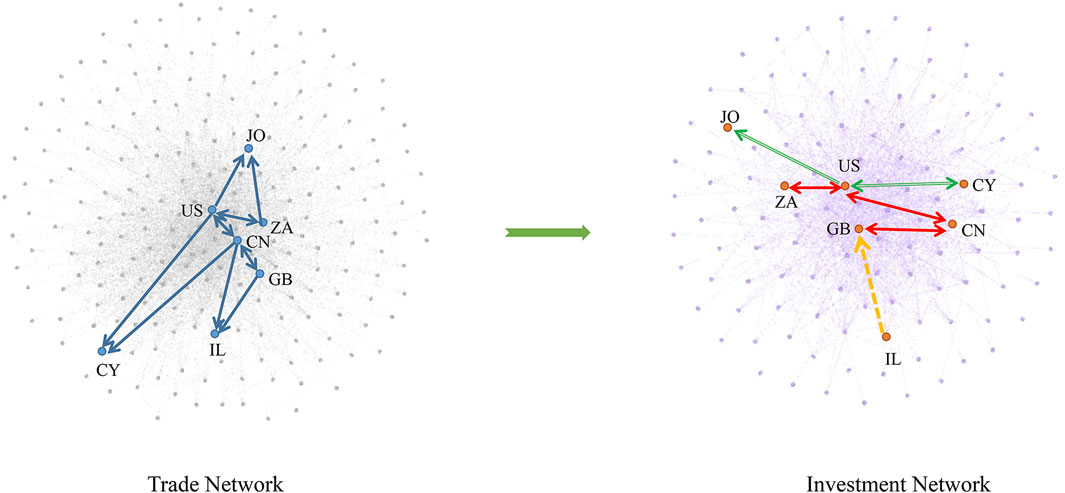
FIGURE 4. Edge correlation of motifs in trade networks with the same economies in investment networks.
The probability of producing a continuous edge at points B and C is given by
where
The probability of producing a continuous edge at points B and C is given by
where
The probability that a motif in one network has edges between three identical economies of another can be expressed as
In order to explain these formulas more clearly, we show the example of the significant motifs in the trade network in Figure 4. As shown in Figure 4, the three groups of economies that involve
2.2.5 Probabilistic correlation between motifs
After finding the probabilistic correlation between motifs-to-edges in the investment and trade networks, we further explore the probabilistic correlation between motifs-to-motifs in the two networks, namely, finding the probability that the three countries that constitute the significant motif
where
The probability that a motif
where
In order to explain these formulas more clearly, the example of the significant motifs in the trade network is shown in Figure 5. As shown in Figure 5, the three groups of economies that involve
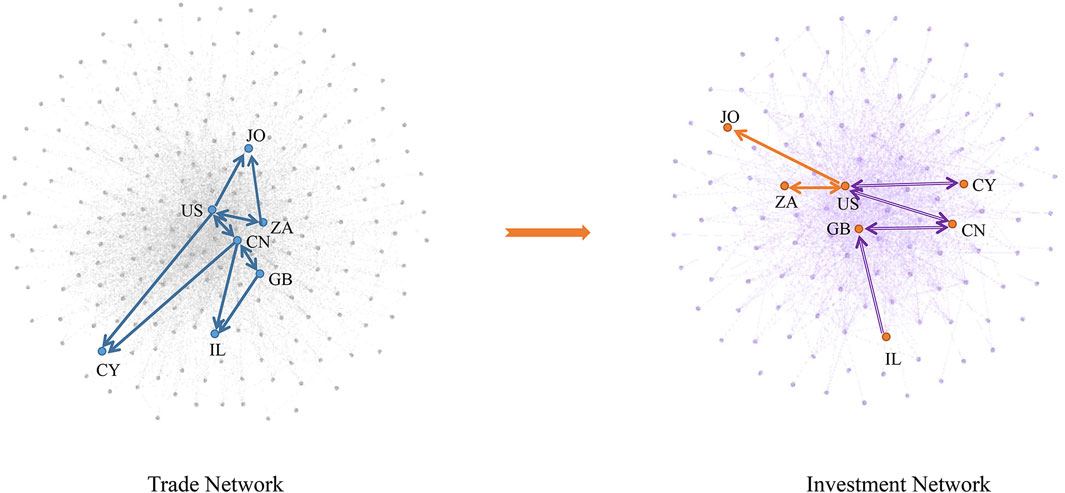
FIGURE 5. Motif correlation of motifs in trade networks with the same economies in investment networks.
2.2.6 Correlation between indicators
In order to quantitatively study the interrelationship between the primary indicators of international energy investment and trade networks, as well as the correlation between the occurrence frequency of significant motifs of investment and trade networks, the Pearson correlation coefficient method is adopted in this paper. Assuming that there are two variables, X and Y, their correlation can be expressed as (Pandia and Bihari, 2015)
3 Results and analysis
3.1 Macroscopic-level correlation of the international energy “investment–trade” networks
In order to better study the size and nature of energy investment and trade, we analyze the topology of the international energy “investment–trade” networks. Table 1 shows the indicator values for these two networks. There are 121 economies involved in international energy investment and 224 in international energy trade in 2018. Almost all economies involved in energy investment are involved in energy trade. In contrast, 52% of the economies involved in energy trade are involved in energy investment. There are 101 economies involved in international energy investment and 205 in international energy trade in 2022. Almost all of the economies involved in energy investment are involved in energy trade, while 46% of the economies involved in energy trade are involved in energy investment. Comparing the data of these 2 years, we can see that after COVID-19 and the Russo-Ukrainian War, the number of economies involved in both energy investment and trade activities has decreased, and energy investment has decreased more than energy trade.

TABLE 1. Indicators measuring energy investment and trade networks.
In 2018, 1,181 edges and 728 energy trade transactions with the same economies on both sides of the investment transaction were found in the energy investment network. The energy trade network has 4,181 edges and 920 energy investment transactions with the same economies on both sides of the trade transaction. In 2022, 560 edges and 341 energy trade transactions with the same economies on both sides of the investment transaction were found in the energy investment network. In the energy trade network, there are 3,338 edges and 476 energy investment transactions with the same economies on both sides of the trade transaction. It can be seen that the number of connected edges in the energy investment network in 2022 is only 47% of that in 2018, and the number of connected edges in the energy trade network is three-quarters of the original number. After a comparative analysis of the shared economies and co-existing trade relationships in these networks, we observed that the economies involved in investment in the trade network occupy the core of the trade network, while the economies not involved in investment are distributed at the periphery of the network.
The distance of the international energy investment network is more significant than that of the trade network. However, the graph density of the network is smaller than that of the trade network, suggesting that the investment network is sparser relative to the trade network. In contrast, the minimum investment distance between economies is longer than the minimum trade distance. These network characteristics suggest that international energy trade transactions are pervasive across economies, and that up to three intermediate countries are needed to establish trade relationships between one country and another, and to establish closer trade relationships between economies. On the other hand, international energy investment transactions exist only between some economies. In contrast, investment relationships between economies are more distant.
3.2 Microscopic-level correlation of economies
3.2.1 The critical economies in investment and trade networks
In order to further study the correlation between the energy “investment–trade” networks at the economic level, we use four indicators to determine the criticality of the economy. These indicators are degree centrality, intermediate centrality, proximity centrality, and eigenvector centrality. The results are shown in Table 2.
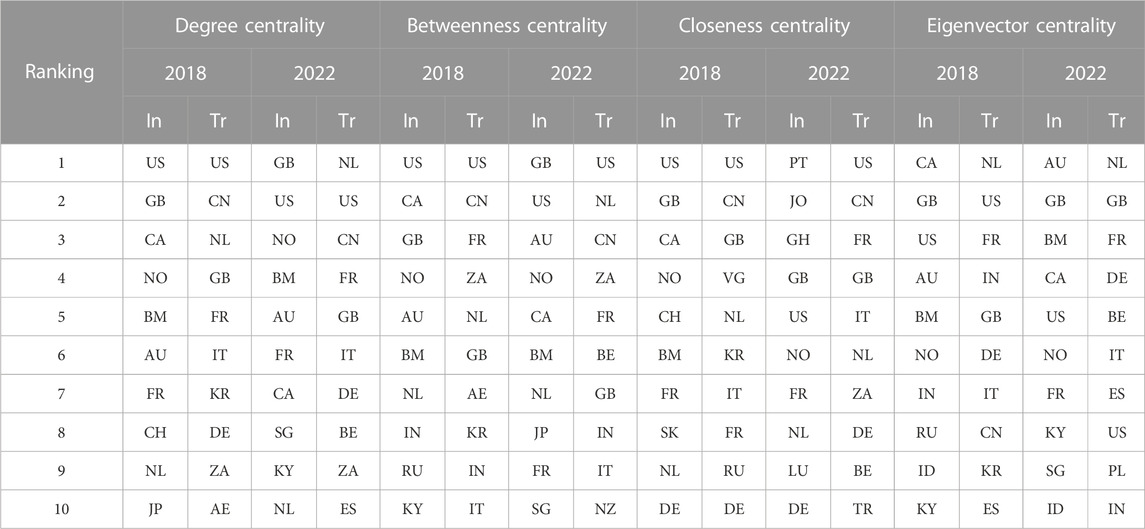
TABLE 2. Top 10 countries in critical indicators for the energy “investment–trade” networks in 2018 and 2022. In this table, “In” stands for “Investment” and “Tr” stands for “Trade.”
Degree centrality represents the number of economies that have direct investment (trade) dealings with the economy. The larger the value is, the more economies have dealings with the economy. The United States, Britain, France, and the Netherlands all occupy the top 10 positions in the degree centrality of these networks in both 2018 and 2022, indicating that these four countries have a large number of partners in the investment and trade networks and play a relatively important role in investment and trade networks.
Betweenness centrality represents the shortest investment (trade) transaction routes of an economy control. In 2018, the United States, Britain, and the Netherlands all occupied the top 10 positions in the betweenness centrality of the two networks, indicating that these three countries are located on the shortest path between a large number of other economies and have a relatively high degree of control over fossil energy investment and trade resources. They are essential media for other countries’ transactions, crucial investment and trade hubs, and energy commodity transfer stations. Furthermore, in 2022, in addition to the United States, Britain, and the Netherlands, France occupied the top 10 position regarding intermediary centrality.
Closeness centrality represents the “distance” of investment (trade) transactions between the economy and other economies. Five countries—the United States, Britain, France, the Netherlands, and Germany—occupy the top 10 positions in both networks in terms of closeness centrality, indicating that these five countries are less dependent on other countries for investment transactions and trade imports and exports, and have a higher ability to trade without the influence and control of other countries.
Eigenvector centrality represents the influence of the economy on the investment (trade) transactions of other essential economies in the network. In 2018, the United States, Britain, and India occupied the top 10 positions in both networks regarding eigenvector centrality, indicating that these three countries have more investment (trade) dealers and the countries they deal with are also influential countries in the network. Moreover, in 2022, in addition to the United States, Britain, and India, France occupied the top 10 position for eigenvector centrality.
It is easy to see that France is becoming increasingly important in the international energy “investment–trade” networks, comparing the key economic indicators for 2022 with 2018, mainly regarding the shortest transaction path and the closeness of investment (trade) transactions with other essential economies.
By comparing the top 10 countries in the critical indicators of the investment network with their rankings in the trade network, we observed that Bermuda, the Cayman Islands, and the Virgin Islands all ranked high in the four centrality indicators in the investment network in 2018 and 2022, indicating that they occupied a more important position in the investment network, with a large number of countries in which they invest and a high position in the investment network. However, in the trade network, the centrality indicator is only at a low-to-medium level. This condition confirms the attractiveness of the investment policies of Bermuda, the Cayman Islands, and the Virgin Islands as the world’s top three offshore financial centers. It also indicates that they do not have the stockpile and geographical advantages in terms of fossil energy trade transactions.
By comparing the top 10 countries in the critical indicators of the trade network with their rankings in the investment network, we observed that three countries—Korea, Germany, and the United Arab Emirates—all ranked highly in the centrality indicators in 2018. It indicates that these three countries are essential intermediaries in the trade network. However, in the investment network, the indicator of eigenvector centrality ranks only in the medium-to-low range. This condition suggests that Korea, Germany, and the United Arab Emirates are transit countries in a pivotal position for international fossil energy trade. However, the countries where they conduct investment transactions are not very important in international investment transactions. In 2022, Belgium and Italy are countries that were at the top of the trade network centrality index, but at the bottom of the investment network centrality index.
3.2.2 Correlation of network indicators between energy investment and trade networks
Correlation tests based on network indicators at the individual level of economies are conducted for economies co-owned in the international energy “investment–trade” networks. The network indexes use degree centrality, betweenness centrality, closeness centrality, and eigenvector centrality of nodes using the Pearson correlation test. In 2018, the number of shared economies was 117, while in 2022, the number of shared economies was 95.
The results are presented in Figure 6. The analysis of the results shows that in the international energy sector investment and trade network in 2018, 87% of the economies have positive correlations between critical indicators, with 65% having strong correlations. In 2022, positive correlations among critical indicators are found in 84% of economies, with strong correlations found in 66%. These data suggest two things: first, the economies occupying an important position in the investment network have a high probability of occupying a vital position in the trade network. It is a similar situation in the trade networks. Second, by comparing the data for 2018 and 2022, it is clear that the share of economies with positive correlations between critical indicators decreases. However, the share of economies with strong correlations increases. This indicates that after the epidemic and the Russo-Ukrainian War, energy investment and energy trade economies have become less consistent in their market positions in energy investment transactions and energy trade trading activities. However, the degree of consistency has increased for economies with consistent market positions.
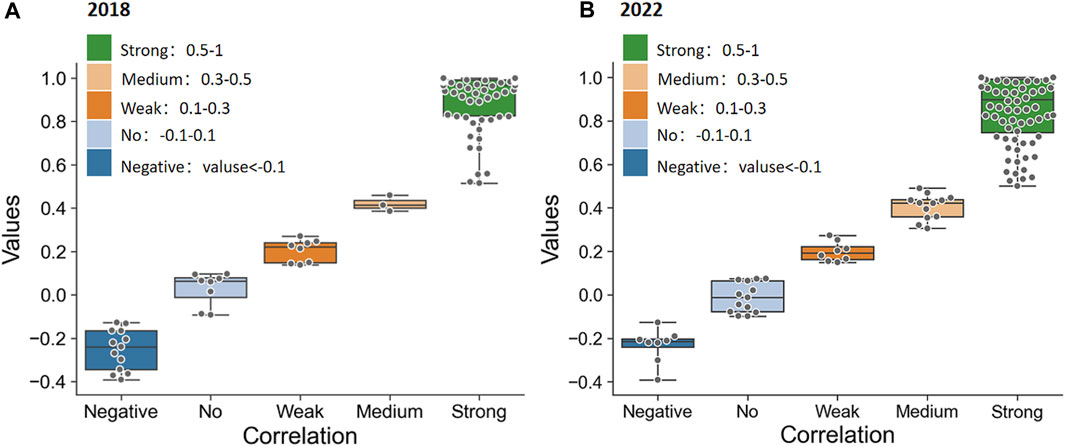
FIGURE 6. Economy-level correlation analysis of the international energy investment network and trade network. (A) The Pearson correlation in 2018. (B) The Pearson correlation in 2022.
The high positive correlation between the critical indicators comes from the consistency of the country’s behavior in terms of fossil energy investments and trade transactions. There are three categories of such countries: the first category is countries with large fossil energy reserves and the economic strength to invest in other countries or favorable investment policies to attract investment from other countries, which include the United States and Canada in North America; Brazil in South America; Britain, the Netherlands, and Russia in Europe; India and the United Arab Emirates in Asia; Australia in Oceania; and South Africa in Africa. The distribution of these countries is characterized by the fact that they are all coastal countries with easy access to sea transport. The second category is that fossil energy storage and demand are at the average level globally, and the number of energy investment transactions is relatively average. The representatives of this category are Sri Lanka and the Philippines. The third category is the small number of fossil energy trading and investment transactions; Cornwall and others represent such countries.
There is also a negative correlation between critical indicators due to the unequal position of economies in the international market for fossil energy investment and fossil energy trade. In one case, the economy is essential in the energy investment market. However, it fails to take a significant position in the energy trade market. The most common examples are Bermuda, the Cayman Islands, and the Virgin Islands, all of which are coastal economies but not rich in fossil energy reserves or demand. However, they have adapted their investment policies to attract large numbers of investors to meet domestic tax and fiscal needs. Alternatively, economies have a more significant position in the energy trade market but have failed to take a significant position in the energy investment market, most typically in Korea and Greece.
3.3 Mesoscopic-level correlation of the network’s local structure
3.3.1 Motifs in the energy “investment–trade” networks
As the basic structural unit of the network, motifs can reflect the connection mode of network nodes. The correlation between the two networks can be obtained from the mesoscopic perspective by correlating the frequencies of the same motifs in the international energy “investment–trade” networks. Using the Pearson correlation test, the indicators used in this paper are the number of times each of the 13 modes appears in the two networks. The results are shown in Table 3. According to the test results, in 2018, the correlation coefficient was 0.799, which is significant at the level of 0.01. In 2022, the correlation coefficient was 0.758, significant at the level of 0.00. These data show a significant positive correlation between the frequencies of the same motifs in the international energy “investment–trade” networks.

TABLE 3. Pearson’s correlation coefficients and significance levels for the international energy “investment–trade” networks in 2018 and 2022.
The significant motifs reflect the transaction characteristics of the economies and the international energy “investment–trade” networks as they invest or trade with their neighboring economies. The significant motifs present the international energy “investment–trade” networks in 2018 are shown in Table 4, and Table 5 shows the significant motifs present in the international energy “investment–trade” networks in 2022.
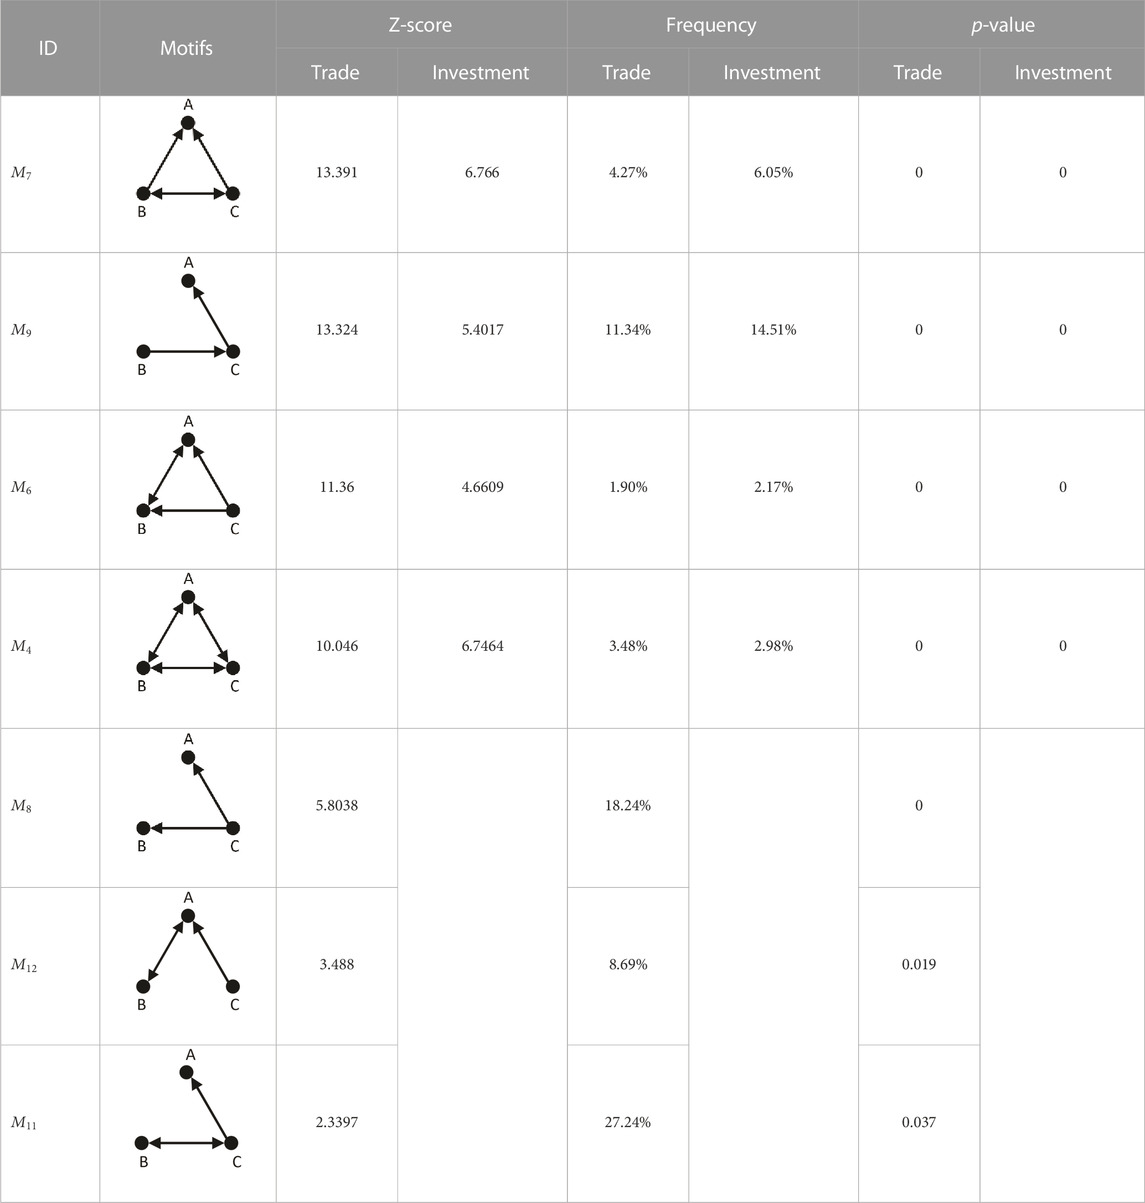
TABLE 4. Significant motifs of the international energy investment and trade network in 2018.

TABLE 5. Significant motifs of the international energy investment and trade network in 2022. In this table, “↑” represents that the ranking of this index in 2022 is higher than that in 2018. On the contrary, “↓” means that the ranking of this index in 2022 is lower than that in 2018.
The motifs that play an important role in both networks are
The significant motifs unique to the energy trade network were
In 2022, the motifs that hold a significant position in both networks are
3.3.2 The linking preference in the investment network from the trade network
The motifs in the international energy trade and investment networks can reflect the transactional characteristics of the economies in these two networks when investing or trading. The motifs can also reflect the correlation between the local structure of energy trade and energy investment relationships. This correlation can be expressed in two ways: first, the conditional probability that the energy investment edges can be formed between the economies that constitute the significant motifs of the energy trade network; second, the conditional probability of forming the significant motifs of the energy investment network among the economies that constitute the significant motifs of the trade network.
Table 6 shows the conditional probability of connecting edges in the energy investment network among the economies forming the significant motifs in the trade network in 2018. Table 7 shows the conditional probability of connecting edges in the energy investment network among the economies forming the significant motifs in the trade network in 2022. Comparing the data of these 2 years shows that the probability of mutual energy investments between countries with energy trade decreases substantially after the COVID-19 pandemic and the Russo-Ukrainian War to only one-half of the pre-epidemic level. However, the trend of energy investments among countries with energy trade is similar.
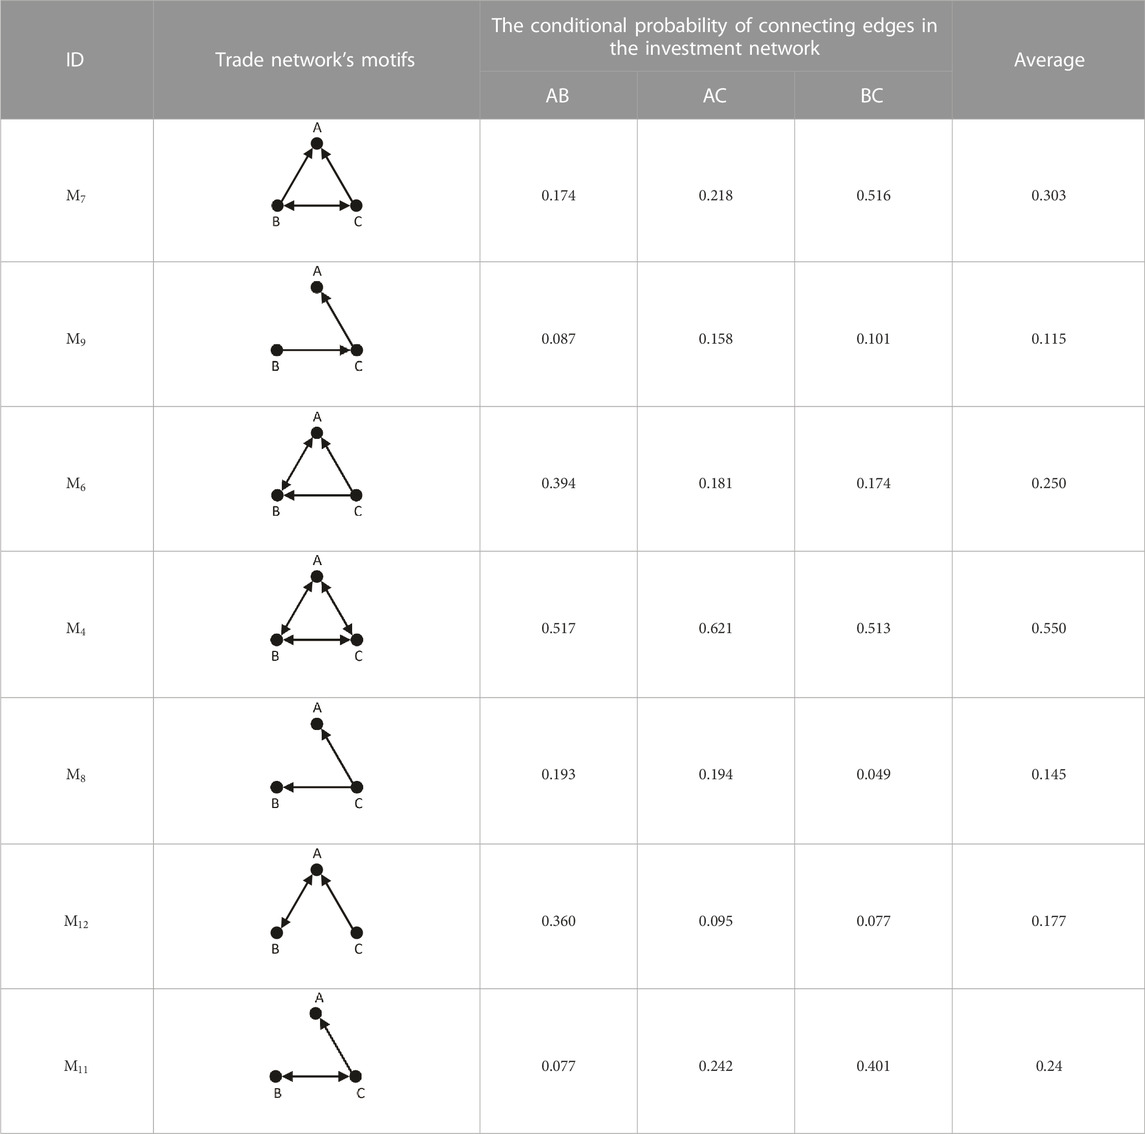
TABLE 6. Conditional probability of edges in the investment network among economies that constitute the significant motifs in the trade network in 2018.
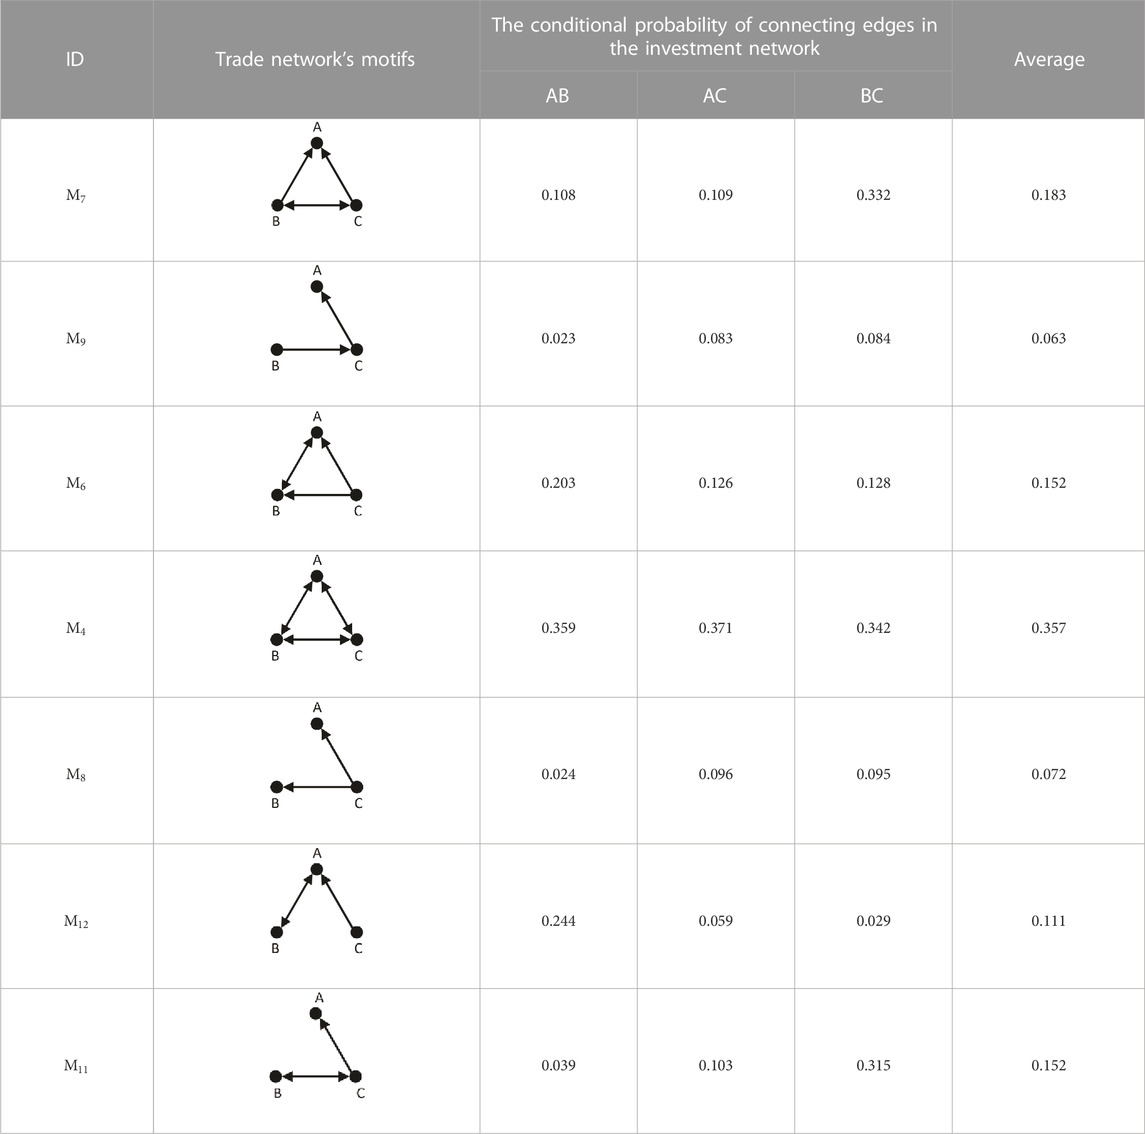
TABLE 7. Conditional probability of edges in the investment network among economies that constitute the significant motifs in the trade network in 2022.
The economies involving
Figure 7 shows the conditional probability of connecting significant motifs in the energy investment network among the economies that form the significant motifs in the trade network. As can be seen from the figure, the proportion of energy trading partners forming key modalities of energy investment among themselves after the COVID-19 pandemic and the Russo-Ukrainian War is about three-quarters lower than before COVID-19 and the Russo-Ukrainian War.
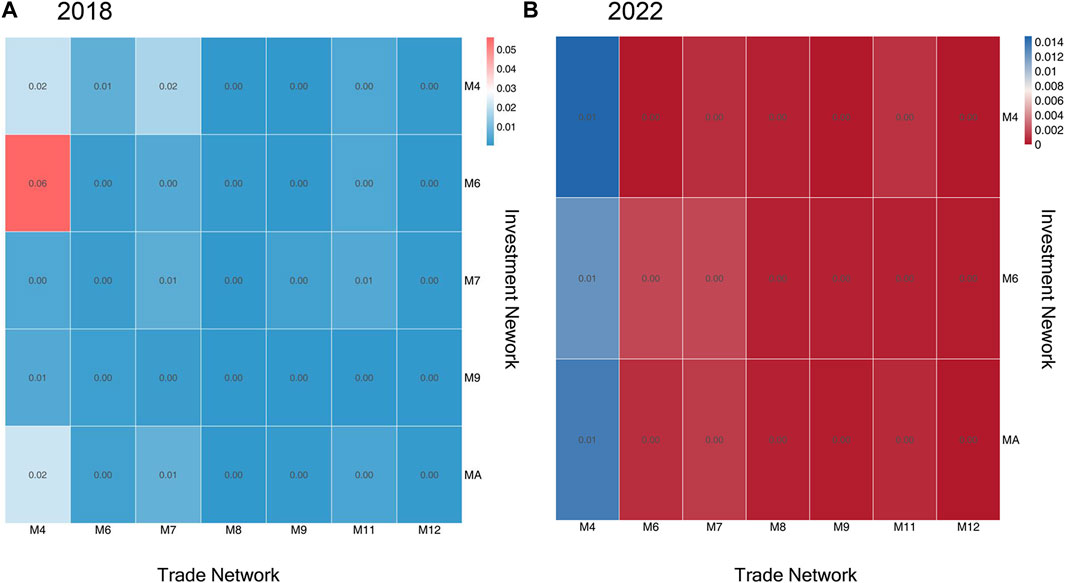
FIGURE 7. Conditional probability of motifs in the trade network among economies that constitute the significant motifs in the investment network. (A) Conditional probability of motifs in 2018. (B) Conditional probability of motifs in 2022.
In 2018, the economies that constitute
In 2018, only
3.3.3 The linking preference in the trade network from the investment network
The motifs can also express the correlation between the local structure of international energy investment and trade. It consists of two components: first, the conditional probability that the energy trade edges can be formed between the economies that constitute the significant motifs of the energy investment network; second, the conditional probability of forming the significant motifs of the energy trade network among the economies that constitute the significant motifs of the investment network.
The conditional probability of connecting edges in the energy trade network between economies that constitute the critical motifs in the energy investment network in 2018 is shown in Table 8. The conditional probability of connecting edges in the energy trade network between economies that constitute the critical motifs in the energy investment network in 2022 is shown in Table 9. Comparing these data, we can observe that the probability of energy trade between economies with an investment motif of
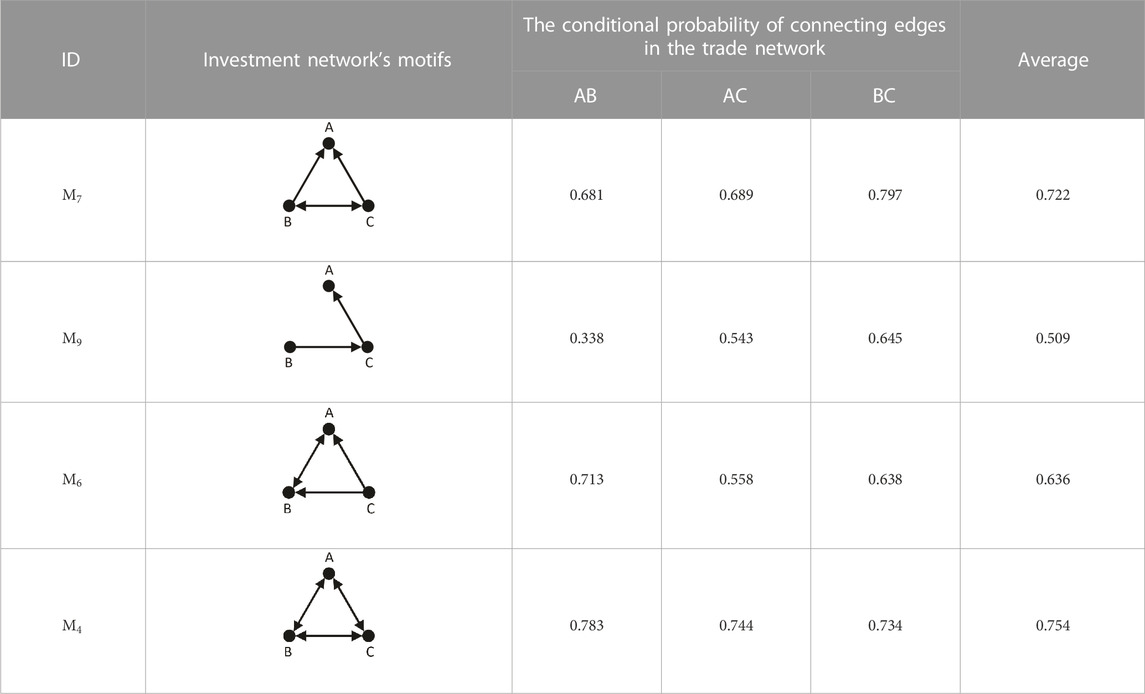
TABLE 8. Conditional probability of edges in the investment network among economies that constitute the significant motifs in the trade network in 2018.
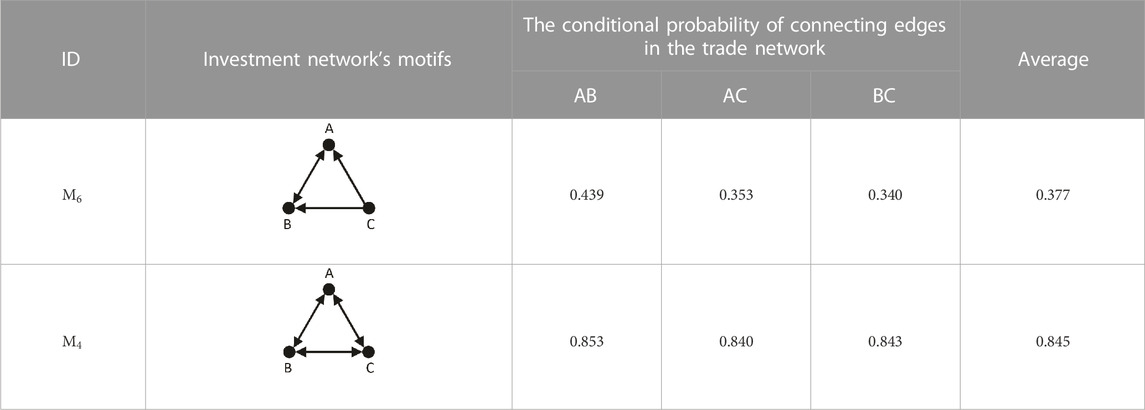
TABLE 9. Conditional probability of edges in the investment network among economies that constitute the significant motifs in the trade network in 2022.
In 2018, the economies involving
Figure 8 shows the conditional probability of connecting significant motifs in the energy investment network among the economies that form the significant motifs in the trade network. From the two figures, Figures 8A, B, it can be seen that if the local structure among the three economies in the energy investment network can form the significant motifs of the investment network, the three economies tend to form the trade interaction relationship between them in the trade network, that is, the connection form of
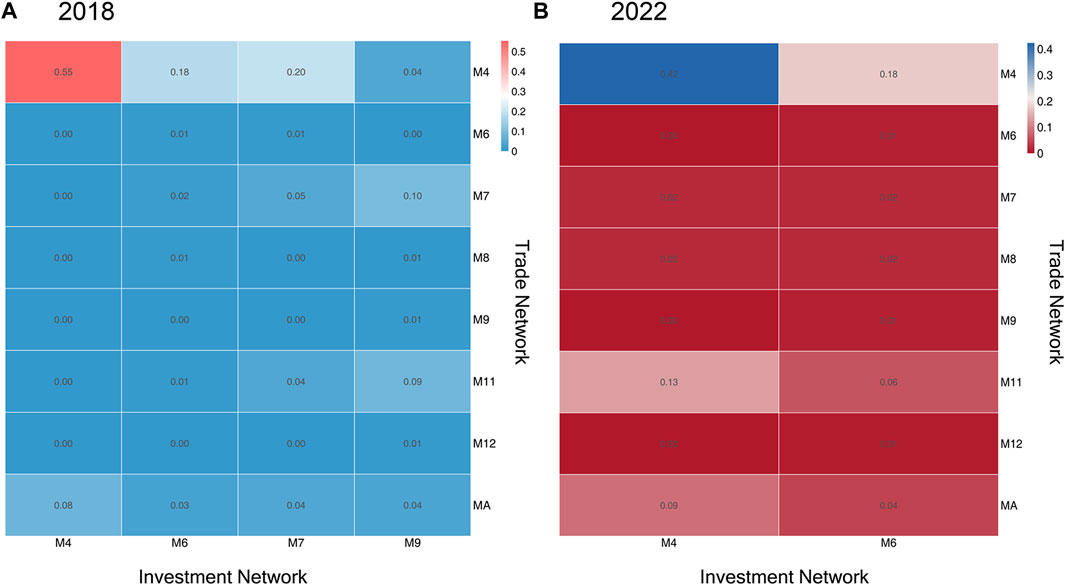
FIGURE 8. Conditional probability of motifs in the investment network among economies that constitute the significant motifs in the trade network. (A) Conditional probability of motifs in 2018. (B) Conditional probability of motifs in 2022.
In addition, in 2018,
Comparing the significant motifs in the investment network with the same patterns in the trade network, we can find the following:
First, economies involved in significant motifs in the investment network (
Second,
Third, after COVID-19 and the Russo-Ukrainian War, economies have become more cautious in their energy investment and trade activities. This caution is reflected in a significant reduction in investment volume and a preference for trade between economies with equal and close investment ties.
4 Discussion and conclusion
Energy is an essential strategic mineral resource. In order to ensure the energy security of countries, it is necessary to identify the correlation between fossil energy investment behavior and trade activities and thus predict the investment or trade behavior of fossil energy. This paper uses complex networks to investigate the similarities and differences between the international energy trade and investment systems from a macroscopic perspective. Then, we examine the criticality of common economies in international energy trade and investment activities and their positions in the two networks. Finally, from the mesoscopic perspective, the local structural correlation between the two networks is revealed by the connection characteristics of the key motifs and the correlation between the motifs. The main conclusion and discussion are stated as follows.
(1) From a macroscopic perspective, the international energy “investment–trade” structures are similar. This similarity is the basis for exploring the correlation between energy trade and investment. Almost all the economies participating in energy investment have participated in energy trade, and these economies occupy the core of the energy trade network. At the same time, from the microscopic perspective of individual economies, the energy trading network and the investment network are related. The study found that most shared economies have similar structural functions in both networks, that is, economies that play a crucial role in one network should also receive attention in the other network.
(2) From a mesoscopic perspective, energy trade and investment activities are driven by the same local trade patterns. In trade and investment transactions, three local trading patterns need to be focused on
1. Bilateral cooperation among the three economies;
2. Bilateral cooperation between the two economies, with the third economy as the core, trading in the same direction as the third economy;
3. Transmission transactions between economies.
From the perspective of both sides of the transaction, bilateral cooperation is the closest and most equal model of cooperation. For energy trade, countries with more energy reserves are more likely to become centers for other countries’ import and export trade. In contrast, the cost of transporting energy and the country’s geographic location may drive certain economies to become transshipment countries for energy transactions. For energy investments, countries with more capital tend to invest in different countries to ensure their energy security. In contrast, countries with energy reserves tend to accept investments from different countries to achieve political balance. Some countries become transits for energy investments due to their specific tax policies.
(3) In energy trading activities, the local trading mode of bilateral cooperation among the three nodes is more relevant to energy investment activities. Bilateral cooperation among the three nodes in energy trade activities implies that the trade cooperation between these three economies is solid and stable. This stable structure is reflected in energy investments. Investors and investees are more inclined to choose the economies in this local structure, so investment behavior among these three countries is more likely to occur. At the same time, only local trade patterns that include bilateral trade relations can involve representative local structures in investment relations, indicating that equal and close trade relations can promote investment behavior.
(4) Representative local trading patterns in energy investment activities are closely related to energy trade activities. The flow of capital between economies is significant in the overall investment system, indicating mutual familiarity and trust between economies. When energy trade is required, investment partners prefer each other as trading partners even if there is no direct flow of investment capital between the two economies. At the same time, when the local trading pattern of the energy investment system is bilateral cooperation among three nodes, energy trade relations also tend to form bilateral cooperation among the three nodes, which further verifies that equal and close investment relations can promote the formation of strong and stable trade relations. In addition, the three economies that need investment transmission will tend to form a bilateral trade pattern between the two economies and export fossil energy to the other economy. The purpose of energy demand control can be achieved by exporting energy to the third economy, while allowing a safer investment transmission of capital.
(5) Before COVID-19 and the Russo-Ukrainian War, the most representative energy trade pattern was a bilaterally cooperating economy, with the third economy as the core to trade in the same direction. After the war and the pandemic, it changed to two economies with no trade relationship, with a third economy as the core for conducting transactions. This represents the Russo-Ukrainian War that triggered the European energy crisis and the need for Europe to rely on transit countries to secure energy supplies. The energy investment landscape has also changed, with shrinking investment markets and investors choosing their investments more carefully and preferring to invest in familiar economies.
Considering these three aspects of the two networks together, macroscopic, mesoscopic, and microscopic, we can obtain the following: first, there is a correlation between energy investment and energy trade, which is the basis of predictability between the two. One can focus on representative local investment relations between economies when forecasting trade relations between economies. Second, a more evident phenomenon after the Russo-Ukrainian War is that close and equal investment relations can facilitate inter-economy trade activities. While the overall trade ratio decreases among economies that engage in investment activities, the trade ratio increases among economies with only such investment relationships. This also reflects the increased concern of countries about the security of energy trade after the epidemic and the war.
Based on the study of the local structural correlation between international energy investment and trade, we provide the following recommendations for relevant scholars to facilitate investors in predicting investment targets and to advise policymakers in formulating policies.
(1) For investors, we provide a new approach to predict possible investment situations between countries based on their inter-country energy trade activities. It is found that energy investment activities are more likely to occur between energy trading partners that are equally close. When there is equal and close energy trade activity between multiple economies and when the international situation is stable, the economies tend to form a situation where one investor is the main body that invests in two economies that invest in each other simultaneously. When the international situation changes, investors will become more cautious and appear to be warming up. They will consolidate their position in the investment market through equal and close energy investment activities to resist the crisis.
(2) For policymakers, focusing on national energy security reserves is essential. When the Russo-Ukrainian War broke out, Europe faced a massive crisis of energy sanctions and had to import energy from India to meet its needs. Furthermore, the outbreak of war also created opportunities for some countries to become energy transit points and profit from them. For example, India allowed oil from Russia to enter European countries bypassing sanctions; on one hand, it bought large quantities of cheap oil from Russia, and on the other hand, India refined it into other products for export to Europe.
As an innovative research method, motifs have been well-studied and applied in the biological and physical fields but still need to be improved in the energy field. Therefore, in further studies, we will consider analyzing the correlated interaction properties of international energy trade and investment in time-series using multi-year data.
Data availability statement
The original contributions presented in the study are included in the article/Supplementary Material; further inquiries can be directed to the corresponding author.
Author contributions
Conceptualization, QG and ZJ; methodology, ZJ and YD; software, ZJ; validation, QG and ZJ; Analysis, ZJ; investigation, ZJ; resources, QG; data curation, ZJ; writing-original draft preparation, ZJ; writing-review and editing, QG; visualization, ZJ; funding acquisition, QG. All authors have contributed significantly. All authors have read and agreed to the published version of the manuscript.
Funding
This research is supported by grants from the National Natural Science Foundation of China (grant no. 42001236, 71991481, and 71991480), and the Young Elite Scientist Sponsorship Program by Bast (grant no. BYESS2023413).
Acknowledgments
The authors would like to express their gratitude to Jianhe Guan who helped a lot during this work with precious analysis suggestions. The authors also thank the software FANMOD for network motif detections in this research.
Conflict of interest
The authors declare that the research was conducted in the absence of any commercial or financial relationships that could be construed as a potential conflict of interest.
Publisher’s note
All claims expressed in this article are solely those of the authors and do not necessarily represent those of their affiliated organizations, or those of the publisher, the editors, and the reviewers. Any product that may be evaluated in this article, or claim that may be made by its manufacturer, is not guaranteed or endorsed by the publisher.
Supplementary material
The Supplementary Material for this article can be found online at: https://www.frontiersin.org/articles/10.3389/fenrg.2023.1203102/full#supplementary-material
References
Barabasi, A. L., and Oltvai, Z. N. (2004). Network biology: Understanding the cell's functional organization. Nat. Rev. Genet. 5 (2), 101–113. doi:10.1038/nrg1272
Bonacich, P., and Lloyd, P. (2001). Eigenvector-like measures of centrality for asymmetric relations. Soc. Netw. 23 (3), 191–201. doi:10.1016/s0378-8733(01)00038-7
Chen, J. H., Zhou, W., Yang, H. T., and Wu, Z. F. (2021). Grouping" or "ride one's coattails"?—How developing countries along the belt and road satisfy themselves. Energies 14 (12), 3498. doi:10.3390/en14123498
Ding, H. Y., Jin, Y. Y., Liu, Z. Y., and Xie, W. J. (2018). The relationship between international trade and capital flow: A network perspective. J. Int. Money Finance 91, 1–11. doi:10.1016/j.jimonfin.2018.10.001
Freeman, L. C. (1978). Centrality in social networks conceptual clarification. Soc. Netw. 1 (3), 215–239. doi:10.1016/0378-8733(78)90021-7
Gao, C. X., Sun, M., and Shen, B. (2015). Features and evolution of international fossil energy trade relationships: A weighted multilayer network analysis. Appl. Energy 156, 542–554. doi:10.1016/j.apenergy.2015.07.054
Gneiting, T., and Katzfuss, M. (2014). Probabilistic forecasting. Annu. Rev. Stat. Appl. 1, 125–151. doi:10.1146/annurev-statistics-062713-085831
Guan, Q., and An, H. Z. (2019). Functional trade patterns in the international photovoltaic trade. Energy Procedia 158, 3670–3675. doi:10.1016/j.egypro.2019.01.893
Guan, Q., An, H. Z., Gao, X. Y., Huang, S. P., and Li, H. J. (2016). Estimating potential trade links in the international crude oil trade: A link prediction approach. Energy 102 (May 1), 406–415. doi:10.1016/j.energy.2016.02.099
Guan, Q., An, H. Z., Liu, N. R., An, F., and Jiang, M. H. (2017). Information connections among multiple investors: Evolutionary local patterns revealed by motifs. Sci. Rep. 7 (1), 14034. doi:10.1038/s41598-017-14141-1
Guan, Q., and An, H. Z. (2017). The exploration on the trade preferences of cooperation partners in four energy commodities' international trade: Crude oil, coal, natural gas and photovoltaic. Appl. Energy 203, 154–163. doi:10.1016/j.apenergy.2017.06.026
Guan, Q., An, H. Z., Wang, K. M., Duan, Y. R., and Zhang, Y. X. (2020). Functional trade patterns and their contributions to international photovoltaic trade revealed by network motifs. Energy 195, 116989. doi:10.1016/j.energy.2020.116989
Guo, P. C., Bi, Y. D. F., Wang, L., and Wang, X. F. (2018). in Cascading avalanche on international financial and trade network. 2018 37th Chinese Control Conference, China, 25-27 July 2018 (CCC), 9698–9703.
Li, H. J., An, H. Z., Fang, W., Wang, Y., Zhong, W. Q., and Yan, L. L. (2017). Global energy investment structure from the energy stock market perspective based on a heterogeneous complex network model. Appl. Energy 194, 648–657. doi:10.1016/j.apenergy.2016.05.062
Ma, N., Li, H. J., Wang, Y. H., Feng, S. D., Shi, J. L., and Wang, K. (2019). Interaction pattern features and driving forces of intersectoral co2 emissions in China: A network motif analysis. Resour. Conservation Recycl. 149, 391–412. doi:10.1016/j.resconrec.2019.03.006
Mao, K. Y. (2018). An empirical analysis of China’s petroleum industry’s foreign direct investment on petroleum import and export trade. China: Doctoral dissertation, Yanbian University.
Milo, R., Shen-Orr, S., Itzkovitz, S., Kashtan, N., Chklovskii, D., and Alon, U. (2002). Network motifs: Simple building blocks of complex networks. Science 298 (5594), 824–827. doi:10.1126/science.298.5594.824
Pandia, M. K., and Bihari, A. (2015). Important author analysis in research professionals' relationship network based on social network analysis metrics. Comput. Intell. Data Min. 3, 185, 194). doi:10.1007/978-81-322-2202-6_16
Schober, P., Boer, C., and Schwarte, L. A. (2018). Correlation coefficients: Appropriate use and interpretation. Anesth. Analgesia 126 (5), 1763–1768. doi:10.1213/ane.0000000000002864
Shen-Orr, S. S., Milo, R., Mangan, S., and Alon, U. (2002). Network motifs in the transcriptional regulation network of escherichia coli. Nat. Genet. 31 (1), 64–68. doi:10.1038/ng881
Wasserman, S., Faust, K., and Dawn, T. (1994). Social network analysis: Methods and applications (structural analysis in the social sciences). Cambridge: Cambridge University Press.
Watts, D. J., and Strogatz, S. H. (1998). Collective dynamics of 'small-world' networks. Nature 393, 440–442. doi:10.1038/30918
Wernicke, S., and Rasche, F. (2006). Fanmod: A tool for fast network motif detection. Bioinformatics 22 (9), 1152–1153. doi:10.1093/bioinformatics/btl038
Xu, S. T., Gow, J., Chen, Y. Z., Zhang, Y. H., and Huang, Z. B. (2017). The determinants of outward foreign direct investment strategies of Chinese energy firms. Singap. Econ. Rev. 64 (4), 1019–1036. doi:10.1142/s0217590817450072
Yin, K. D., Liu, Z., Huang, C., and Liu, P. D. (2020). Topological structural analysis of China's new energy stock market: A multi-dimensional data network perspective. Technol. Econ. Dev. Econ. 26 (5), 1030–1051. doi:10.3846/tede.2020.12723
Zhang, S. H., Wang, L., Liu, Z. X., and Wang, X. F. (2016). Evolution of international trade and investment networks. Phys. A Stat. Mech. Its Appl. 462, 752–763. doi:10.1016/j.physa.2016.06.117
Zhang, W. X. (2018). Research on the import trade effect of China’s energy direct invest. China: Doctoral dissertation, Dongbei University of Finance and Economics.
Keywords: energy trade, energy investment, complex networks, network motifs, correlations
Citation: Jin Z, Guan Q and Duan Y (2023) Microscopic, mesoscopic, and macroscopic structural correlations between the international energy “investment–trade” networks based on network motifs. Front. Energy Res. 11:1203102. doi: 10.3389/fenrg.2023.1203102
Received: 10 April 2023; Accepted: 12 June 2023;
Published: 28 June 2023.
Edited by:
Tao Zhang, University of Science and Technology Beijing, ChinaCopyright © 2023 Jin, Guan and Duan. This is an open-access article distributed under the terms of the Creative Commons Attribution License (CC BY). The use, distribution or reproduction in other forums is permitted, provided the original author(s) and the copyright owner(s) are credited and that the original publication in this journal is cited, in accordance with accepted academic practice. No use, distribution or reproduction is permitted which does not comply with these terms.
*Correspondence: Qing Guan, Z3VhbnFpbmczNUAxMjYuY29t