 Junming Li1
 Weihuang Zhong
 Ziheng Zhao
 Jingyi Hu
94% of researchers rate our articles as excellent or good
Learn more about the work of our research integrity team to safeguard the quality of each article we publish.
Find out more
ORIGINAL RESEARCH article
Front. Energy Res. , 30 May 2023
Sec. Energy Storage
Volume 11 - 2023 | https://doi.org/10.3389/fenrg.2023.1201815
This article is part of the Research Topic Low Carbon Design, Manufacturing and Application of the Energy Storage System and Equipment View all 5 articles
With the rapid technological progress of society and increasingly stringent environmental regulations, further reduction of emissions has become an important issue for environmental protection. This study developed a response surface model with the biodiesel blending ratio (BBR), load, and exhaust gas recirculation (EGR) as independent variables and brake thermal efficiency (BTE), brake specific fuel consumption (BSFC), and NOx, and CO emission rates as dependent variables. Simulations were performed and calculated. The results of the response surface approach with the objectives of maximizing the BTE of the engine and minimizing BSFC, NOx emissions, and CO emissions show that when the BBR is 20%, the EGR rate is 15%, and the engine load is 74.52%, pollutant emissions are significantly reduced while the engine power’s performance is maximized.
The efficient use of energy and environmental sustainability has become the focus of attention in many countries (Alaswad et al., 2015; Yu et al., 2016). Biodiesel is not only a renewable energy source (Martos et al., 2016; Zhang et al., 2022d) but also can effectively improve the combustion of diesel engines (Khare et al., 2011; Foley et al., 2013) and increase the thermal efficiency and reduce the emission of pollutant gases from diesel engines (Cui et al., 2017; Zhang et al., 2022c). The most direct way of reducing emissions from diesel engines is through after-treatment, which can significantly reduce the emissions of exhaust gases. For example, Zhao investigated the optimum operating conditions of a diesel particulate filter (DPF) at different temperatures, oxygen concentrations (Zhao et al., 2023), and exhaust gas loads (Zhao et al., 2022), and compared the effects of different parameters on after-treatment. Nowadays, the research on the combustion characteristics (Zhang et al., 2023a) of biodiesel in diesel engines is increasing (E et al., 2017; Cai et al., 2023). In recent years, many studies on diesel combustion (Zhang et al., 2021a) and diesel combustion after-treatment (Zhao et al., 2021) have been conducted. However, few experiments analyze and optimize each input parameter of diesel engines because many different results are usually produced, and the experiments need to be fully analyzed to produce the desired data. Different experimental analysis methods often result in different test protocols (Nuchitprasittichai and Cremaschi, 2011). Each method of experimental analysis in the engine field has distinct advantages and disadvantages (Zhang et al., 2022e; Tan et al., 2023b).
The orthogonal design of experiments method is a method that uses extreme difference analysis and analysis of variance, mainly through orthogonal tables, to arrange experiments characterized by simple operation and low workload (Shi et al., 2023). The orthogonal experimental method has a wide range of adaptability and is applied in various fields such as engineering, materials science, physics, and other multifaceted applications (Zhang et al., 2022a; Zhang et al., 2022b). Wang et al. (2022) studied the effect of combustion parameters on the combustion characteristics and NO emission characteristics of combustion in a combustion furnace by orthogonal experiments and concluded that the deflection angle of the blade end had a significant effect on the furnace temperature and NO emissions. The number of blades had no effect on the furnace temperature and NO emissions. Li et al. (2022) proposed a timing of the design energy consumption relationship of a typical rural house in a severely cold region. The optimization method is a multi-factor, multi-objective optimization using the orthogonal experiment method and the optimization method with entropy weights. A design scheme is proposed after comparing 18 optimization schemes that effectively improve the subjective design flaws of the constructors during building design and increase energy saving, cost-benefit ratio, and carbon emission reduction considerations. Hu et al. (2022b) proposed a method in response to the problems of increasing form factor and deterioration of key performance indexes by structural optimization methods used in the design process of magnetorheological (MR) valves. A geometric optimization design method is proposed for the optimal design of MR valve structures under specific volume constraints. In this work, a second-order response surface methodology (RSM) model is proposed to fit the radial flow path and spool region density of the radial MR valve using orthogonal experiments and response surface analysis, and the accuracy of the response surface function is also estimated for the entire design development. Finally, a geometric optimization problem was formulated for the constructed RSM using a genetic algorithm to find the global optimal geometric parameters of the radial MR valve, and the correctness of the algorithm and the effectiveness of the optimized design were effectively verified by experiments (Li et al., 2023b). Conducting experiments according to an orthogonal design method allows effective comparison of preselected parameters to determine their degree of influence on the experimental results. Sometimes, the actual determination of the specific optimization range requires the intervention of other optimization methods to complement the accuracy of the experimental results; ANOVA lacks the means to portray a nonlinear relationship between multiple factors.
The genetic algorithm (GA) is a method for solving optimization problems. The adaptation function is used to measure the overall situation to achieve the optimal solution, and the genetic algorithm has a stronger global search capability by randomly selecting individuals, which can avoid falling into the local optimal solution, and has higher solution accuracy. Teng and Qin (2019) In order to study the relationship curves of torque with soot and NOx under the premise of satisfying the torque output demand and soot emission demand, the relationship curves of torque with soot and NOx are determined using the established genetic algorithm model penalty function, and the best combination of ECG parameters and fuel supply parameters is found by optimization. A genetic algorithm based on algebraic analysis is proposed to optimize the combustion phase change angle of a dual-fuel engine, and a double Wiebe function is proposed to fit the actual operating conditions in its work. Finally, by comparing the genetic algorithm with the Levenberg–Marquardt (LM) algorithm for iterative calculations, the genetic algorithm is examined for its practicality, and also, the accuracy of the genetic algorithm is demonstrated (Hu et al., 2022a). However, while improving its convergence, the genetic algorithm requires about 150 iterations, requiring much computational time. Li et al. (2023a) proposed a non-dominated ranking genetic algorithm (NSGA Ⅲ) that has been recently investigated. This genetic algorithm differs from the traditional NSGA Ⅱ in that NSGA Ⅲ employs a diversity maintenance strategy that uses a set of uniformly distributed reference points to preserve the diversity of communities. This approach is better than NSGA Ⅱ, which uses a crowded ranking of reference points and is more applicable to multidimensional problems. Moreover, the reference points in NSGA Ⅲ results can directly identify similar individuals, and the optimal solution can be found in a shorter time during the enhanced training. Compared with previous genetic algorithms, the proposed algorithm greatly facilitates the processing of optimization results, increases accuracy, and limits the consumption of computational time. However, due to the varying degree of crowding of the initial data, some genetic algorithms may lead to data misuse; some local optimal solutions are ignored by mistake, thus losing the optimal solutions. Some additional processing is needed to improve or supplement the genetic algorithm (Hu et al., 2022a).
The RSM can be used to solve the interaction between random variables and system response variables through advanced experimental design methods (Solmaz et al., 2021; Liu et al., 2023). The main components of response surface experimental methods include experimental design and function fitting, and their accuracy is mainly determined by the design of the response surface function and the values of the coefficients in the function (Singh et al., 2021). RSM has been applied to develop models using design of experiments and multiple linear regression analysis techniques (Ozgur, 2021). The established second-order RSM model has been found to be the most appropriate in the current work. Currently, the RSM is widely used in engineering practice and has been studied by many experts worldwide in the field of internal combustion engine combustion. Kashyap et al. (2021) obtained the best performance of the dual fuel engine by replacing 20% of the hydrogen at higher loads by using RSM. The analysis of variance (ANOVA) of the experimental results at the 95% confidence level showed that the developed model was significant. Simsek and Uslu (2020) investigated the effect of biodiesel/2-ethylhexyl nitrate (EHN) fuel blends on diesel engine performance and emissions by RSM. In the RSM model created, three continuous factors were selected to create a Pareto chart supporting the analysis of variance and the validity of the selected input factors was determined. The final optimum values for the engine parameters were derived as 100% biodiesel percentage, 1.1% EHN percentage, and 1515 W load. The results show that the response surface experimental approach can effectively optimize compression ignition engine performance and exhaust emissions powered by a combination of biodiesel and EHN, thus saving time and reducing engineering effort. Yilmaz et al. (2022) studied diesel fuel blends and considered that the addition of 1-pentanol to biodiesel blends will increase the use of alternative fuels in diesel engines. The RSM was used to optimize the biodiesel blending ratio (BBR) and study the effect of these three component blends on emissions by considering the relationship between brake thermal efficiency (BTE), brake specific fuel consumption (BSFC), CO, HC, and NOx in relation to the three additive ratios to find the optimal blending ratio of 79.9% diesel, 8.33% waste oil biodiesel (WOB), and 12.58% 1-pentanol to achieve the best emission economy. The results of these studies help understand the combustion reaction process of diesel–biodiesel dual-fuel engines and have some engineering guidance for energy saving and emission reduction of dual-fuel diesel engines.
Biodiesel is a popular alternative fuel with the advantages of lean combustion, high octane number, and latent heat of vaporization, which can improve the combustion and emission characteristics of engines without changing the engine structure. It is essential to find the right combination of the advantages of the engine’s exhaust gas recirculation (EGR) and biodiesel fuel that will meet the emissions and engine performance targets. At present, researchers mostly use single factors for combustion and emission characteristics analysis of biodiesel, but parameters usually interact with each other, so it is necessary to use multi-objective optimization methods. RSM is an optimization method that can be used to reduce the number of experiments and to accurately predict the optimal operating parameters of the engine. Therefore, this paper uses the RSM with the objectives of maximizing BTE and minimizing BSFC, NOx, and CO to derive the optimal biodiesel blending ratio, the optimal workload, and the optimal EGR.
Biodiesel can achieve good combustion conditions in engines due to its high octane number and high latent heat of vaporization. Experiments were conducted using different proportions of biodiesel to investigate the blending ratio. The specific experiments are described as follows.
The temperature boundary conditions are given empirically and are set as follows: piston temperature is 553 K, cylinder head temperature is 523 K, cylinder wall temperature is 373 K, and injection nozzle temperature is 550 K. Velocity boundary conditions: piston movement speed is the actual piston movement speed at the calculated speed, and the remaining components are stationary. The turbulent kinetic energy (TKE) and turbulence length scale (TLS) in the initial combustion chamber are calculated from the following equations (Zhang et al., 2021b):
where
The main parameters of the diesel engine are shown in Table 1.
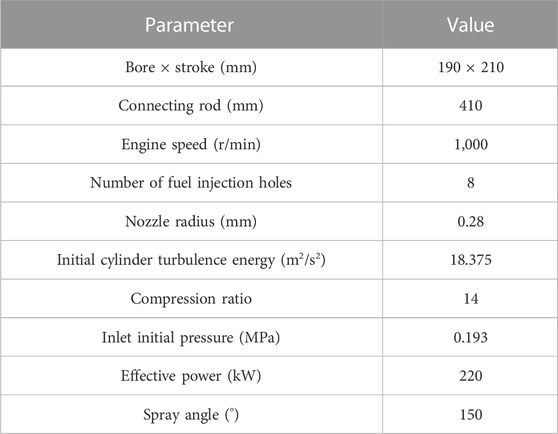
TABLE 1. Relevant parameters of the model.
The study examined diesel/biodiesel blends with different biodiesel blending ratios, namely, D95B5, D90B10, D85B15, and D80B20, respectively. D95B5 represents 95% diesel +5% biodiesel, D90B10 represents 90% diesel +10% biodiesel, D85B15 represents 85% diesel +15% biodiesel, and D80B20 represents 80% diesel +20% biodiesel. The input physical properties of the model are treated as constant values, and the physicochemical properties of diesel and biodiesel are shown in Table 2 (Chen et al., 2012; Tan et al., 2023a).
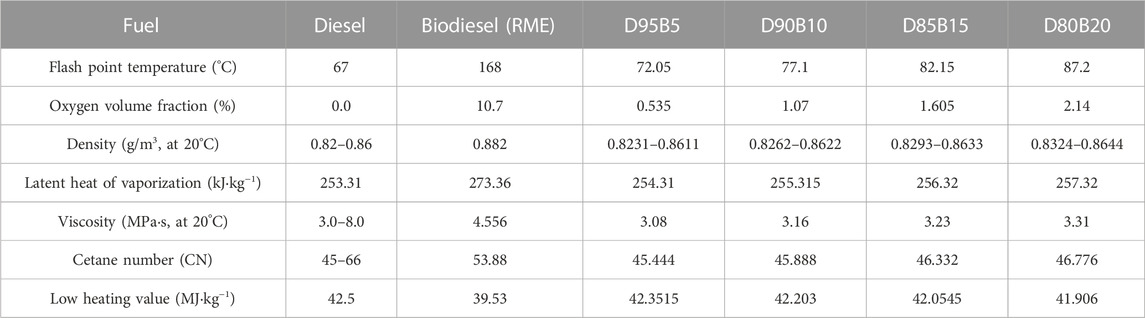
TABLE 2. Physiochemical properties of diesel and biodiesel.
The experimental arrangement is shown in Figure 1: the fuel is controlled by an oil pressure sensor (accuracy ±1% MPa) at the outlet, and at the end of the test setup, the emission levels of NOx and CO in the exhaust gas are measured with an exhaust gas analyzer with an accuracy of ±5 ppm. The models measured by the sensor during the experiment are passed through the computer to the electronic control unit and finally to the computer for analysis.
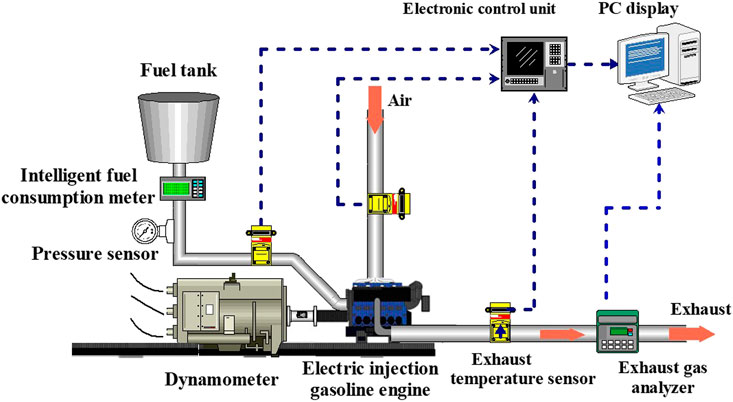
FIGURE 1. Diesel engine test system.
Before the model can be simulated, the accuracy of the simulation was verified using a suitable mesh density. Figure 2 shows the cylinder pressure curve with different grid sizes that can ensure accuracy and reduce the calculation time. A grid size of 2 mm was chosen for the experimental study.
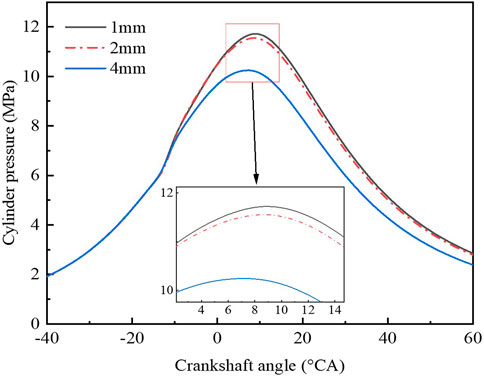
FIGURE 2. Cylinder pressure curves at different grids.
The experimental and simulation results were compared for cylinder pressure, heat release rate (HRR), and trends on NOx emissions at 100% and 50% load. As shown in Figure 3, both the experimental and prediction errors were within 5%, and the accuracy of the model was verified by the experiment. It was concluded that the model was accurate.
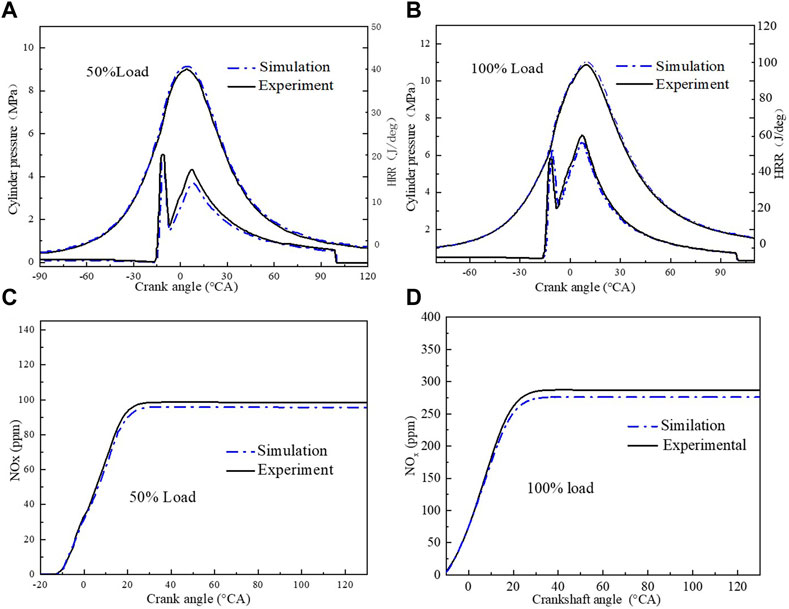
FIGURE 3. Comparison of experimental and simulated data at 100% and 50% load conditions: (A) indicates cylinder pressure at 50% load, (B) indicates cylinder pressure at 100% load, (C) NOx concentration at 50% load, and (D) NOx concentration at 100% load.
The research route of the RSM is to set up a finite number of representative experiments by experimental design and use the least squares method to derive polynomials to express the state function of the implicit limit based on the experimental output. Overall, the RSM is a practical statistical method to determine the final best response value between different inputs (Yusup et al., 2014; Sun et al., 2017).
In order to derive quantitative relationships between the three structural parameters of BBR, load, and EGR and the economic performance indicators (BTE and BSFC) and emission indicators (NOx and CO), a response surface function was constructed based on the RSM with the objectives of maximizing BTE and minimizing BSFC, NOx emissions, and CO emissions. The basic equations are as follows:
where
Among them, the relationship between the number of basic functions Y and the number of design parameters μ is divided into linear, quadratic polynomial, and cubic polynomial relationships.
The adaptability and accuracy of the model must be quantified to assess the predictive power of the model and perform significance tests on the established response surface models. Many factors determine the accuracy of the response surface model: the number of data groups collected, the smoothness of the actual function, and the choice of the response surface equation. In this paper, error analysis is performed statistically. The sum of squares of multiple error fluctuations and the value of degrees of freedom are used in statistics to test the response surface model (Jamaluddin et al., 2013). The specific equations are as follows:
where
where
In this paper, a response surface model is established based on the diesel engine operating parameters. On the premise of ensuring high model accuracy, the response surface optimization is carried out, and the optimal operating parameters of the diesel engine are derived. The specific process is shown in Figure 4.
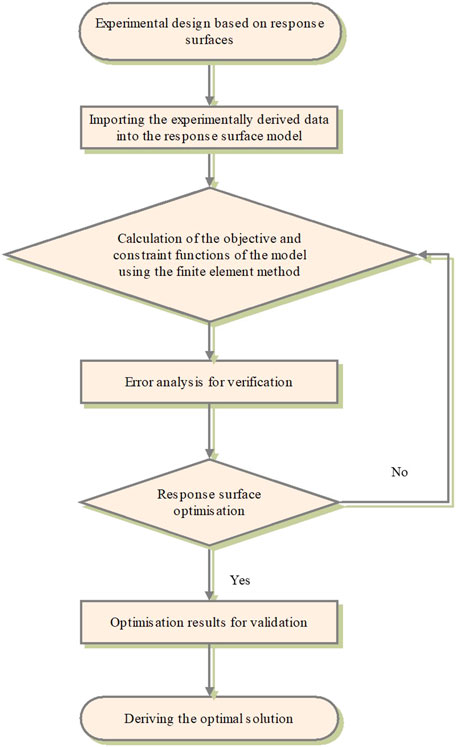
FIGURE 4. Response surface flow chart.
The Design-Expert software was used to create the response surface experimental design, and 20 sets of experimental data were derived. A response surface model was developed with BBR, load, and EGR as independent variables and BTE, BSFC, NOx emissions, and CO emission as dependent variables, and simulations were performed to calculate the results shown in Table 3.
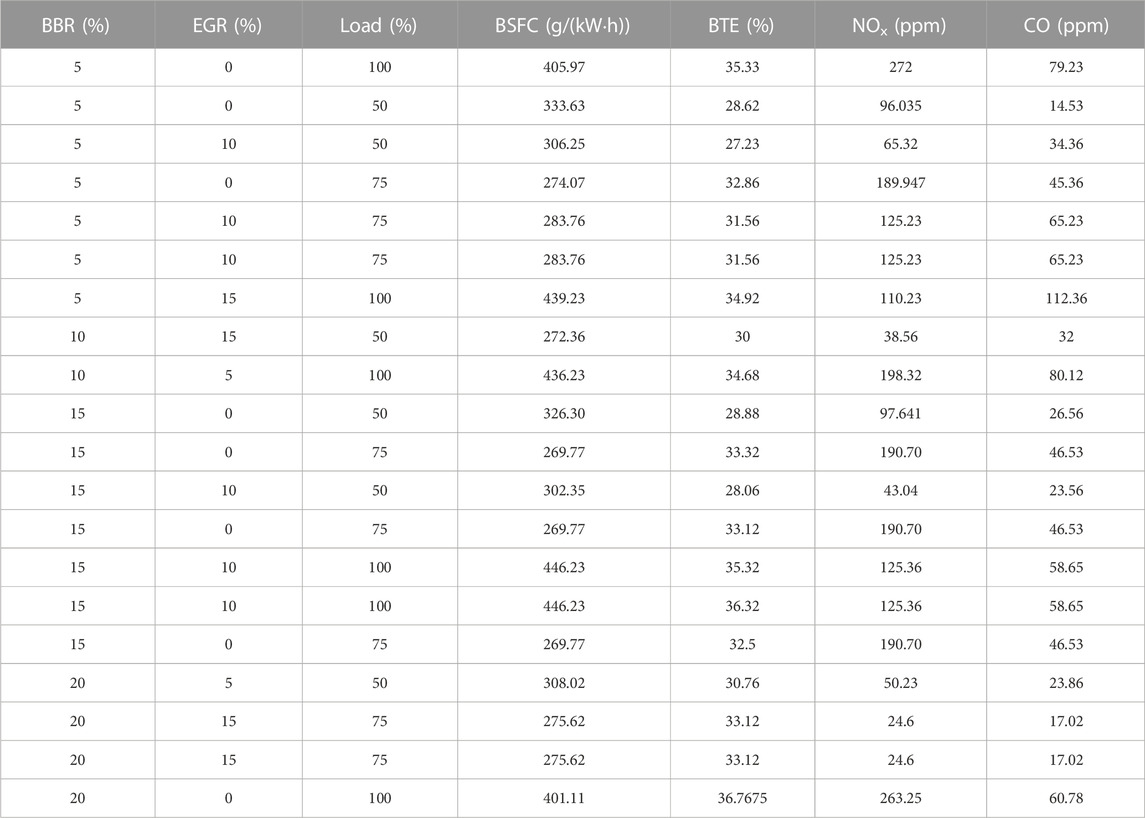
TABLE 3. Response surface design simulation data.
The core of the response surface optimization analysis method is to design the appropriate parameter variables in the space with a suitable experimental design method (Shahbaz et al., 2016). The input parameters are substituted into the response surface model, and the multiple quadratic regression equation is used to fit the direct mathematical function relationship between the influencing factors and the response results according to the input and output parameters, and then, the measured response value is used as the target value to obtain the ideal value with the response surface model.
In this article, a quadratic regression model of the engine system is represented to analyze the biodiesel blending ratio, the workload, and the effect of EGR on engine combustion and emissions. The difference between the predicted and target values is called the residual. Figure 5 shows the predicted BSFC, BTE, and NOx emissions against the expected values. Figure 5 shows that the residuals of the model are very small, indicating that the fit and model are ideal.
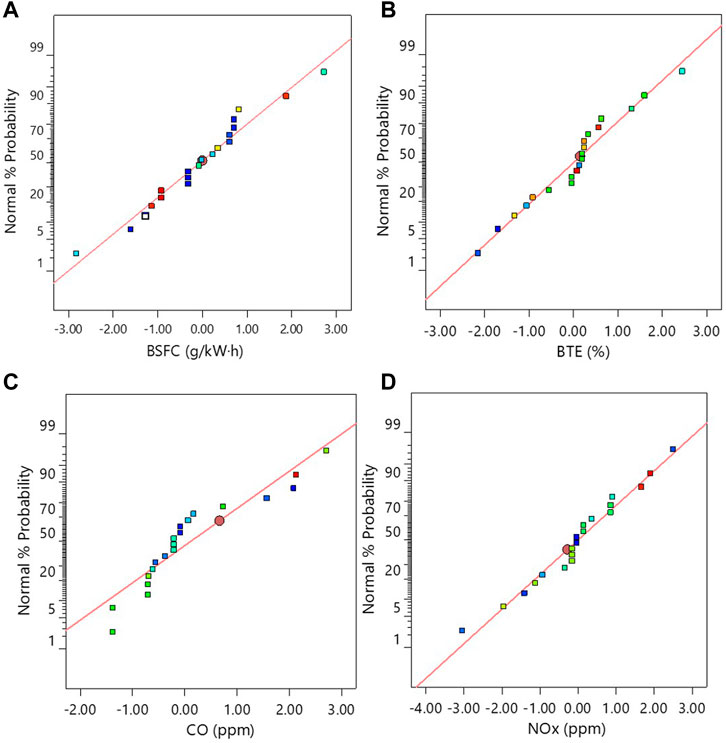
FIGURE 5. BSFC, BTE, CO, and NOx forecast compared to the expected value: (A) BSFC, (B) BTE, (C) CO, and (D) NOx.
The fuel consumption model based on RSM is as follows (Elsayed and Lacor, 2011):
The difference between the predicted value of fuel consumption calculated according to this formula and the simulated value is very small. BSFC is the brake-specific fuel consumption, g/(kWh); A is the BBR, %; B is the EGR rate, %; C is the engine load, %.
The variance analysis of fuel consumption is shown in Table 4. The biodiesel blending ratio, EGR, and biodiesel load have very significant effects on the model of fuel consumption (p-value of model<0.0001). The response values of
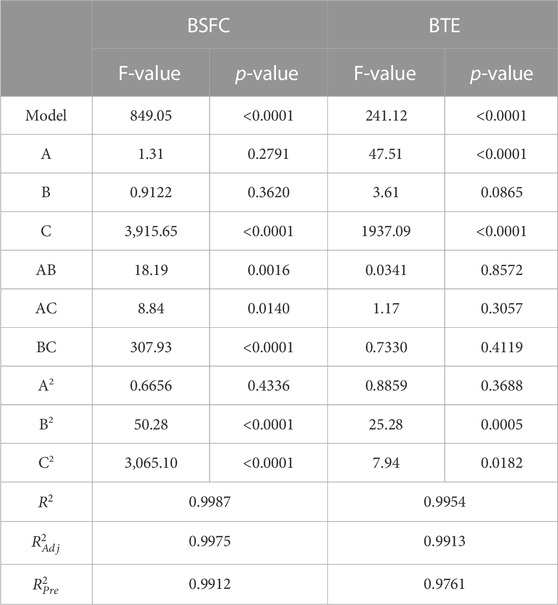
TABLE 4. BSFC and BTE Miller’s cyclic ANOVA table.
Figure 6 shows the graphs of the biodiesel blending ratio, EGR, and load on fuel consumption individually for biodiesel. In Figure 6A, the biodiesel blending ratio has little effect on fuel consumption. The EGR curve in Figure 6B shows a smaller slope than the load. The graph of fuel consumption versus load shows that the effect of load is the main effect, and fuel consumption decreases then increases rapidly with increasing load, as depicted by a curve with a steep slope, as shown in Figure 6C.
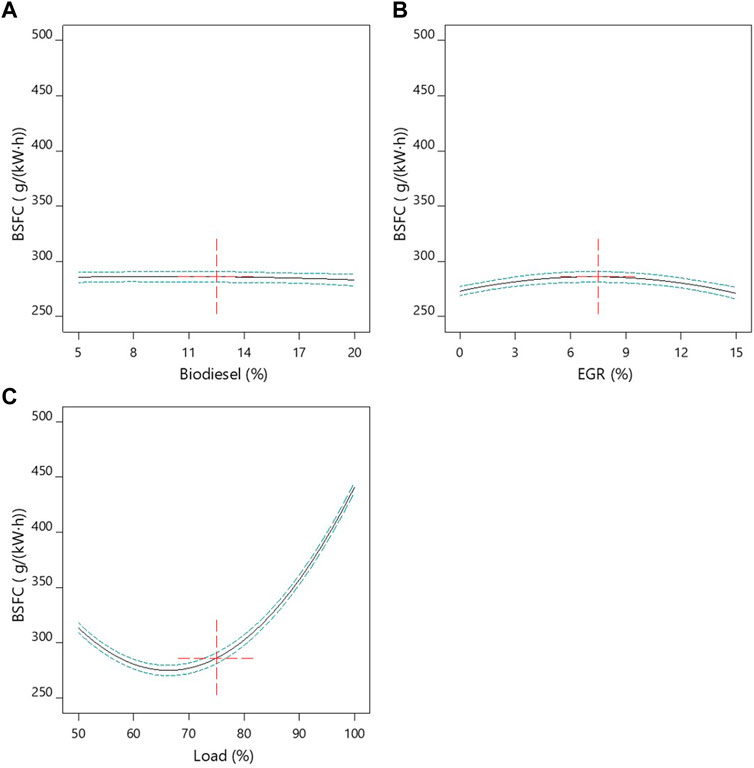
FIGURE 6. Graph of the separate effects of the BBR, EGR, and load on fuel consumption: (A) biodiesel (%), (B) EGR (%), and (C) load (%).
Three-dimensional surface plots specifically depict the interaction between variables and responses. Figure 7 shows surface plots of the relationship between the biodiesel blending ratio and load about BSFC. The results show that engine load has a greater effect on power than blended fuel. The surface plot shows a drastic change when the load slightly changes from low to high. This higher load does more work leading to consuming more fuel. In addition, the image shows that the biodiesel percentage has a negligible effect on fuel consumption.
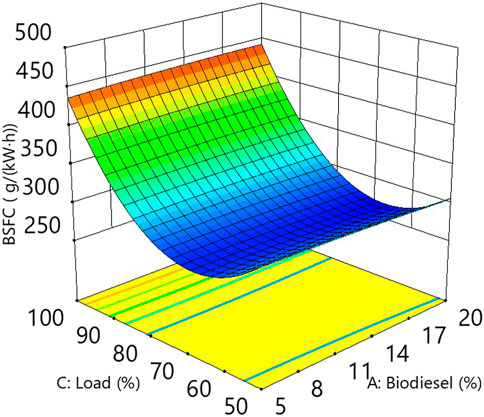
FIGURE 7. 3D surface plot of BSFC about the engine load and biodiesel blending ratio.
The brake thermal efficiency model based on the RSM is as follows:
The error between the predicted and simulated values of brake thermal efficiency calculated by this formula is almost negligible. In the equation, BTE represents the BTE of the engine, %; A is the BBR, %; B is the EGR rate, %; C is the engine load, %.
The variance analysis of thermal efficiency is shown in Table 4. It can be seen from the table that the p-values of the biodiesel blending ratio, EGR, and load-to-fuel consumption of biodiesel are <0.0001, 0.0865, and <0.0001, respectively. Among them, the response values of
Figure 8 shows the separate effects of biodiesel blending ratio, EGR, and load of BTE. In Figure 8, the biodiesel blending ratio has a positive correlation with the thermal efficiency in Figure 8A. The EGR has less effect on the BTE and remains around 32%, as shown by the curve in Figure 8B. As shown in Figure 8C, load is the main effect on the diesel engine, BTE increases rapidly with the increase of load, forming a curve with a steeper slope, and its effect on BTE is much greater than the biodiesel blending ratio and EGR. This indicates that as the load increases, diesel engine combustion in the cylinder becomes more and more adequate.
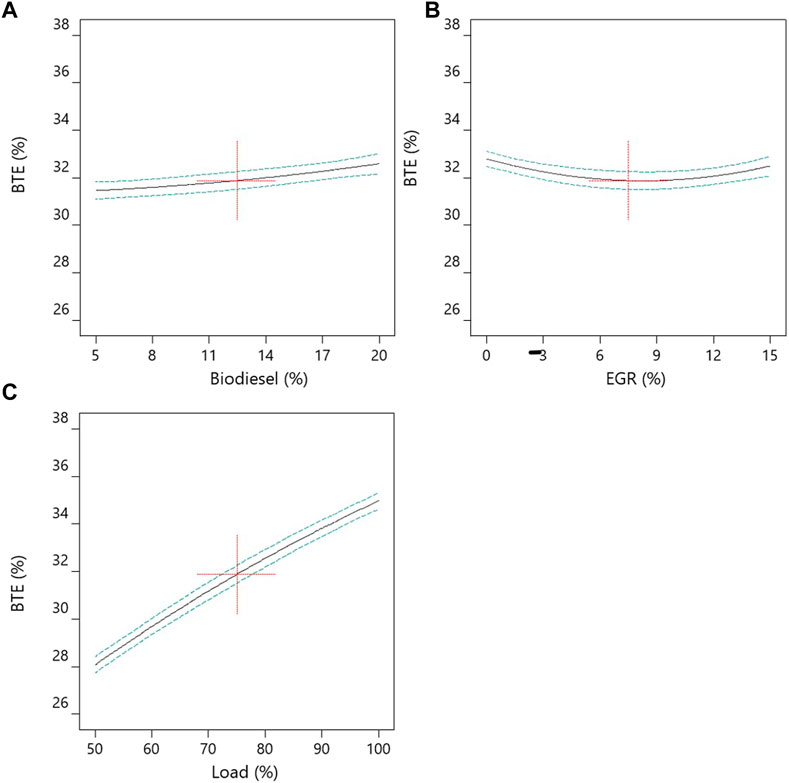
FIGURE 8. Graph of the separate effects of the BBR, EGR, and BTE load: (A) biodiesel (%), (B) EGR (%), and (C) load (%).
A 3D surface plot was created to further understand the interaction between the variables and the response. Figure 9 shows a surface plot of the relationship between the biodiesel blending ratio and load about BTE. The results show that the diesel load has a greater effect on BTE than the biodiesel blending ratio. A significant change can be seen on the surface plot when the load is changed slightly from low to high.
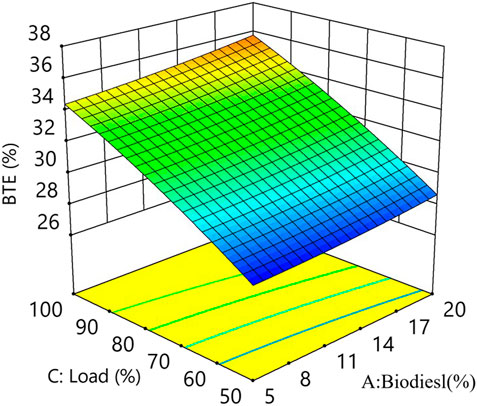
FIGURE 9. Surface plot of BTE about the engine load and biodiesel blending ratio.
The NOx model based on the RSM is as follows:
The NOx of the diesel engine calculated according to this equation was obtained, and the error between the predicted and values simulated through calculation was almost negligible. Therefore, it can be considered that NOx obtained through the formula can represent the NOx emissions of the engine, ppm; A is the BBR, %; B is the EGR rate, %; C is the engine load, %.
The variance analysis of NOx is shown in Table 5. It can be seen that the model is significant and can express the state of the diesel engine and the corresponding effects in each case with basic accuracy. The p-values of BBR, EGR, and load on NOx are <0.0001. In addition, the response values of
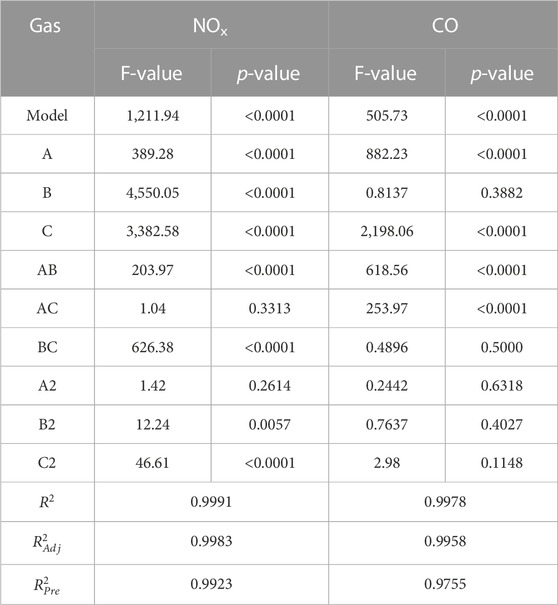
TABLE 5. BSFC and BTE Miller’s cyclic ANOVA table.
The individual effects of the biodiesel blending ratio, EGR, and load on the NOx emissions of a diesel engine are shown in Figure 10. The results show that the magnitudes of the effects on NOx emissions are as follows: the EGR is the largest, followed by the biodiesel blending ratio, and the load has the least effect. As shown in Figure 10A, increases in the biodiesel blending ratio cause a moderate increase in NOx emissions. This is because the high oxygen content of biodiesel leads to higher NOx. As shown in Figure 10B, EGR is the most influential on NOx emissions, and as EGR increases, NOx decreases significantly. In addition, in Figure 10C, there is a negative correlation with the increasing load curve, and NOx increases significantly with a large slope of the curve.
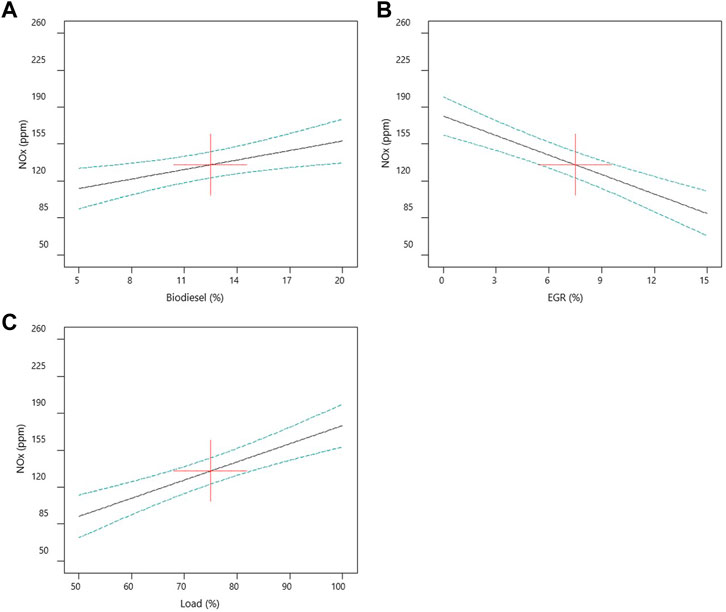
FIGURE 10. Graph of the separate effects of the BBR, EGR, and load of NOx emissions: (A) biodiesel (%), (B) EGR (%), and (C) load (%).
A 3D surface plot was created to further understand the interaction between the variables and the response. Figure 11 shows a surface plot of the relationship between EGR and load about thermal efficiency. The results show that NOx emissions from the diesel engine decrease significantly as EGR increases, while NOx emissions increase as the load and biodiesel blending ratio increase. The in-cylinder temperature increases significantly when the load changes from low to high, and the high temperature can lead to a large amount of NOx formation.
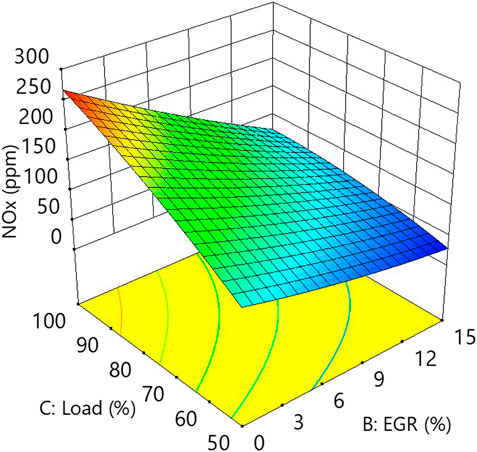
FIGURE 11. 3D surface plot of NOx about engine load and EGR.
The CO model based on the RSM is as follows:
where CO represents the CO emissions of the diesel engine, ppm; A is the BBR, %; B is the EGR rate, %; and C is the engine load, %. The predicted values of CO for diesel engines can be calculated by this equation, and the obtained results have very little error with the simulated values, so the emission values of CO are calculated by this equation.
The analysis of variance for CO is shown in Table 5. In this case, the factors that affect the model are biodiesel blending ratio, EGR, and load. The F-value of the model was 505.73 with a p-value <0.0001, which is less than 0.05; thus, the model is significant. In addition,
Figure 12 shows the individual effects of the parameters (Hu et al., 2023) on CO emissions. The increase in the oxygen content of biodiesel significantly increases the conversion of CO to CO2. As shown in Figure 12A, an increase in the biodiesel blending ratio leads to a decrease in CO emissions, and its effect is prominent. EGR has little effect on CO emissions, as shown in Figure 12B. However, in Figure 12C, the load is an important factor affecting CO, and the increase of CO emissions as the diesel engine load increases may be due to the increase of oxygen content, which leads to the increase in CO conversion to CO2.
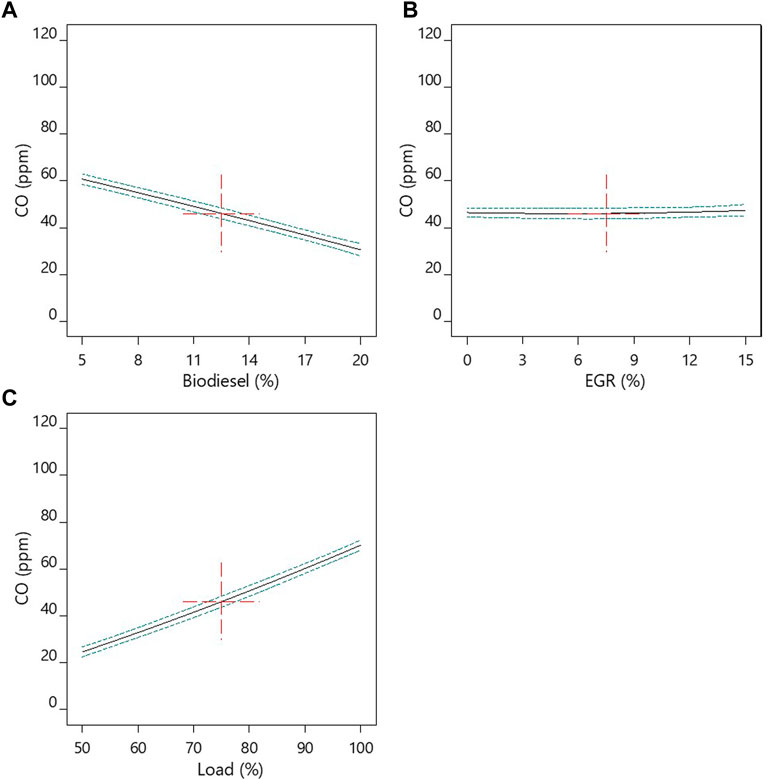
FIGURE 12. Graph of the separate effects of the BBR, EGR, and load of CO emissions: (A) biodiesel (%), (B) EGR (%), and (C) load (%).
A three-dimensional surface plot was created by analytical calculations. Figure 13 shows the surface plot of the relationship between the biodiesel blending ratio and load about BTE. Figure 13 shows that both the biodiesel blending ratio and load have a large effect on CO emissions. With the increased biodiesel blending ratio, the CO emissions of diesel engines decrease significantly, while with the increase of load, CO emissions also increase.
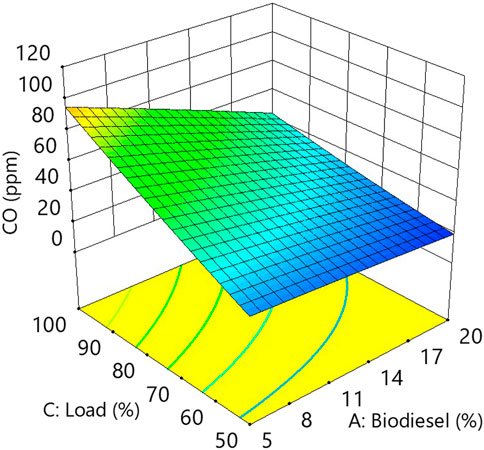
FIGURE 13. 3D surface plot of CO about the engine load and biodiesel blending ratio.
In this paper, BBR, load, and EGR are used as independent variables and BTE, BSFC, NOx emissions, and CO emissions are used as dependent variables to obtain the optimal parameters for multiple responses and to achieve the objectives of maximizing BTE and minimizing BSFC, NOx emissions, and CO emissions (Luo et al., 2022; Ye et al., 2023).
The best solution derived from the response surface multi-objective optimization was to use 20% canola oil with diesel fuel for the diesel engine at 74.52% load and 15% EGR. The solution was chosen with a consensual value of 0.874, as shown in Figure 14. In addition, the highest value of BTE and the lowest value of BSFC, NOx emissions, and CO emissions combination were derived. The final predicted values of BTE, BSFC, NOx emissions, and CO emissions were 33.14%, 272.07g/(kWh), 24.3 ppm, and 16.48 ppm, respectively.
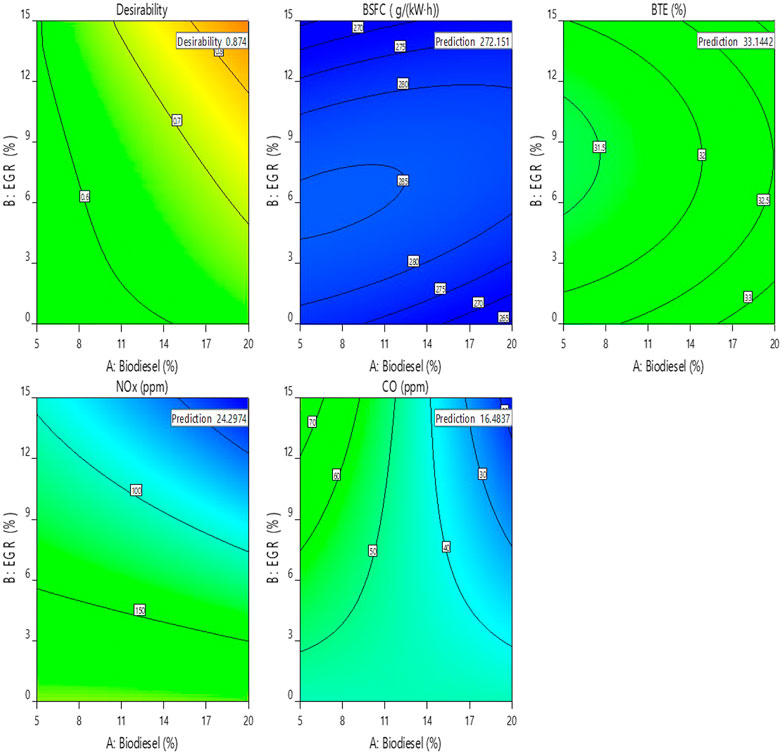
FIGURE 14. Predicted value of the best engine operating conditions.
Based on response surface multi-objective optimization, it is concluded that diesel engines can be optimized to a considerable extent in terms of performance and emission characteristics when using an optimal biodiesel blending ratio of 20%. This optimization occurs especially at high engine loads and high EGR. The main reason for this is the desirable fuel properties of biodiesel, higher oxygen content, and higher latent heat of vaporization contribute significantly to the optimal emission and combustion characteristics of the diesel engine (Ye et al., 2023).
After the optimization results were obtained, the best solution obtained from the multi-objective optimization was returned to the simulation experiment for another validation to verify the correctness of the optimization results. Table 6 presents a comparison of the actual values corresponding to the optimal conditions of the engine biodiesel blending ratio, EGR, and mixed load with the predicted values. The results show that the absolute errors in the predicted values of the model are consistent with an acceptable range. Thus, the developed model can accurately predict performance characteristics, and the absolute percentage error with the simulated values is less than 4%. However, in this paper, the percentage of absolute error is less than 5% for model predictions of NOx emission characteristics. This result may be due to the lack of experimental values and consensual values (Zuo et al., 2022). Finally, the validation results are in good agreement with the experimental data and can be used as a reference in the practical application of diesel engines.
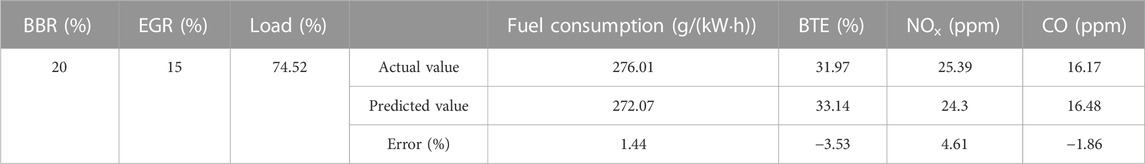
TABLE 6. Validation of optimization results.
In this paper, a response surface model was developed to study the effects of combustion and emission characteristics of diesel-biodiesel blends for diesel engines based on different engine blending ratios, loads, and EGR. The response surface model was developed with biodiesel blending ratio, load, and EGR as independent variables and BTE, BSFC, NOx emissions, and CO emissions as dependent variables. The maximum BTE, as well as the minimum BSFC, NOx emissions, and CO emissions, was obtained. The main findings are as follows:
(1) The response models of EGR, biodiesel blending ratio, and load for BTE and BSFC show that load has the most significant effect on BTE and BSFC, and load has the greatest effect on diesel engine operation.
(2) With increased EGR, the NOx emissions of diesel engines are significantly reduced, while NOx emissions increase with increases in the load and biodiesel blending ratio. It is possible that this is due to the recovery of heat energy by the EGR, which leads to a more complete combustion of the fuel, resulting in lower NOx emissions.
(3) CO emissions decreased significantly with an increasing biodiesel blending ratio, which may be due to the increase of oxygen content, whereas the CO emissions increased with increasing load.
(4) The best solution based on the response surface multi-objective optimization was selected as a consensual value of 0.874, using 20% biodiesel with 80% diesel as the fuel for the diesel engine at 74.52% load and 15% EGR. At this point, the BTE, BSFC, NOx emissions, and CO emissions were 33.14%, 272.07g/(kWh), 24.3 ppm, and 16.48 ppm, respectively.
This paper provides a better understanding of the relationship between EGR, biodiesel blending ratio, and load on the biodiesel engine, and provides a reference for future research on the parameters of biodiesel engines and the development of EGR systems. In future work, more engine parameters and more efficient and refined optimization methods will be considered (Zhang et al., 2023b).
The original contributions presented in the study are included in the article/Supplementary Material; further inquiries can be directed to the corresponding author.
JL: method, funding acquisition, conceptualization, and writing—review and editing; WZ: resources, project administration, method, software, data curation, writing—original draft, and writing—review and editing; JZ: data curation, and writing—review and editing; ZZ: software, formal analysis, investigation, and method; JH: investigation method, project administration, and formal analysis. All authors contributed to the article and approved the submitted version.
The study was supported by the Ph.D. Programs Foundation of Guangxi University of Science and Technology (Grant No. 23Z04).
The authors declare that the research was conducted in the absence of any commercial or financial relationships that could be construed as a potential conflict of interest.
All claims expressed in this article are solely those of the authors and do not necessarily represent those of their affiliated organizations, or those of the publisher, the editors, and the reviewers. Any product that may be evaluated in this article, or claim that may be made by its manufacturer, is not guaranteed or endorsed by the publisher.
Alaswad, A., Dassisti, M., Prescott, T., and Olabi, A. G. (2015). Technologies and developments of third generation biofuel production. Renew. Sustain. Energy Rev. 51, 1446–1460. doi:10.1016/j.rser.2015.07.058
Cai, L., E, J. Q., Li, J., Ding, J., and Luo, B. (2023). A comprehensive review on combustion stabilization technologies of micro/meso-scale combustors for micro thermophotovoltaic systems: Thermal, emission, and energy conversion. Fuel 335, 126660. doi:10.1016/j.fuel.2022.126660
Chen, Y. L., Chen, S. M., Tsai, J. M., Tsai, C. Y., Fang, H. H., Yang, I. C., et al. (2012). Optimization of suitable ethanol blend ratio for motorcycle engine using response surface method. J. Environ. Sci. Health, Part A Toxic/Hazard. Subst. Environ. Eng. 47 (1), 101–108. doi:10.1080/10934529.2012.629949
Cui, S., Pang, S., Pang, D., Tian, F., and Yu, Y. (2022). The microstructure and pitting corrosion behavior of K-tig welded joints of the UNS S32101 duplex stainless steel. MATERIALS 16 (1), 250. doi:10.3390/ma16010250
Cui, Y. F., Geng, Z. Q., Zhu, Q. X., and Han, Y. M. (2017). Review: Multi-objective optimization methods and application in energy saving. Energy 125, 681–704. doi:10.1016/j.energy.2017.02.174
E, J., Pham, M., Zhao, D., Deng, Y. W., Le, D., Zuo, W., et al. (2017). Effect of different technologies on combustion and emissions of the diesel engine fueled with biodiesel: A review. Renew. Sustain. Energy Rev. 80, 620–647. doi:10.1016/j.rser.2017.05.250
Elsayed, K., and Lacor, C. (2011). Modeling, analysis and optimization of aircyclones using artificial neural network, response surface methodology and CFD simulation approaches. Powder Technol. 212 (1), 115–133. doi:10.1016/j.powtec.2011.05.002
Foley, A. M., Gallachoir, B. P. O., McKeogh, E. J., Milborrow, D., and Leahy, P. G. (2013). Addressing the technical and market challenges to high wind power integration in Ireland. Renew. Sustain. Energy Rev. 19, 692–703. doi:10.1016/j.rser.2012.11.039
Guo, J. X., Zhuang, Y. B., Chen, L. M., Liu, J. H., Li, D. M., and Ye, N. H. (2012). Process optimization for microwave-assisted direct liquefaction of Sargassum polycystum C.Agardh using response surface methodology. Bioresour. Technol. 120, 19–25. doi:10.1016/j.biortech.2012.06.013
Han, D., Deng, Y., Han, W., E, J. Q., Chen, L., Feng, C., et al. (2021). Effects analysis on hydrocarbon reduction efficiency of a beta zeolite catcher in gasoline engine during cold start. Fuel 306, 121614. doi:10.1016/j.fuel.2021.121614
Hu, D., Wang, H., Wang, B., Shi, M., Duan, B., Wang, Y., et al. (2022a). Calibration of 0-D combustion model applied to dual-fuel engine. Energy 261, 125251. doi:10.1016/j.energy.2022.125251
Hu, G. L., Zhou, F., Zhu, W. C., Yu, L. F., and Li, G. (2022b). Geometric optimization and performance analysis of radial MR valve using Taguchi orthogonal experiment method. J. Mech. Sci. Technol. 36 (9), 4593–4614. doi:10.1007/s12206-022-0822-2
Hu, W., E, J. Q., Leng, E., Zhang, F., Chen, J., and Ma, Y. (2023). Investigation on harvesting characteristics of convective wind energy from vehicle driving on multi-lane highway. Energy 263, 126062. doi:10.1016/j.energy.2022.126062
Jamaluddin, M. A., Ismail, K., Ishak, M. A. M., Ab Ghani, Z., Abdullah, M. F., Safian, M. T. U., et al. (2013). Microwave-assisted pyrolysis of palm kernel shell: Optimization using response surface methodology (RSM). Renew. Energy 55, 357–365. doi:10.1016/j.renene.2012.12.042
Kashyap, D., Das, S., and Kalita, P. (2021). Exploring the efficiency and pollutant emission of a dual fuel CI engine using biodiesel and producer gas: An optimization approach using response surface methodology. Sci. Total Environ. 773, 145633. doi:10.1016/j.scitotenv.2021.145633
Khare, A., Beckman, T., and Crouse, N. (2011). Cities addressing climate change: Introducing a tripartite model for sustainable partnership. Sustain. Cities Soc. 1 (4), 227–235. doi:10.1016/j.scs.2011.07.010
Li, B., Wang, J., Zhang, H., Fan, L., Leng, X., Long, W., et al. (2023a). Multiple-objective optimization of Jet Controlled Compression Ignition (JCCI) mode with dual-direct injection in a high-speed light-duty engine. Fuel 333, 126327. doi:10.1016/j.fuel.2022.126327
Li, Q., Hu, H., Ma, L. Y., Wang, Z. G., Arici, M., Li, D., et al. (2022). Evaluation of energy-saving retrofits for sunspace of rural residential buildings based on orthogonal experiment and entropy weight method. Energy Sustain. Dev. 70, 569–580. doi:10.1016/j.esd.2022.09.007
Li, Y., Zhou, S., Liu, J., Tong, J., Dang, J., Yang, F., et al. (2023b). Multi-objective optimization of the Atkinson cycle gasoline engine using NSGA Ⅲ coupled with support vector machine and back-propagation algorithm. Energy 262, 125262. doi:10.1016/j.energy.2022.125262
Liu, Z., Luo, J., Pan, Y., Li, J., Li, L., Wei, X., et al. (2023). Multi-objective optimization of the performance and emission characteristics for a dual-fuel engine with hydrogen addition. Fuel 332, 126231. doi:10.1016/j.fuel.2022.126231
Luo, J. B., Liu, Z. H., Wang, J., Xu, H. X., Tie, Y. H., Yang, D. Y., et al. (2022). Investigation of hydrogen addition on the combustion, performance, and emission characteristics of a heavy-duty engine fueled with diesel/natural gas. Energy 260, 125082. doi:10.1016/j.energy.2022.125082
Martos, A., Pacheco-Torres, R., Ordonez, J., and Jadraque-Gago, E. (2016). Towards successful environmental performance of sustainable cities: Intervening sectors. A review. Renew. Sustain. Energy Rev. 57, 479–495. doi:10.1016/j.rser.2015.12.095
Nuchitprasittichai, A., and Cremaschi, S. (2011). Optimization of CO2 capture process with aqueous amines using response surface methodology. Comput. Chem. Eng. 35 (8), 1521–1531. doi:10.1016/j.compchemeng.2011.03.016
Ozgur, C. (2021). Optimization of biodiesel yield and diesel engine performance from waste cooking oil by response surface method (RSM). Pet. Sci. Technol. 39 (17-18), 1–21. doi:10.1080/10916466.2021.1954019
Shahbaz, M., Yusup, S., Inayat, A., Patrick, D. O., and Pratama, A. (2016). Application of response surface methodology to investigate the effect of different variables on conversion of palm kernel shell in steam gasification using coal bottom ash. Appl. Energy 184, 1306–1315. doi:10.1016/j.apenergy.2016.05.045
Shi, Z., Peng, Q., E, J. Q., Xie, B., Wei, J., Yin, R., et al. (2023). Mechanism, performance and modification methods for NH3-SCR catalysts: A review. Fuel 331, 125885. doi:10.1016/j.fuel.2022.125885
Simsek, S., and Uslu, S. (2020). Investigation of the effects of biodiesel/2-ethylhexyl nitrate (EHN) fuel blends on diesel engine performance and emissions by response surface methodology (RSM). Fuel 275, 118005. doi:10.1016/j.fuel.2020.118005
Singh, T. S., Rajak, U., Samuel, O. D., Chaurasiya, P. K., Natarajan, K., Verma, T. N., et al. (2021). Optimization of performance and emission parameters of direct injection diesel engine fuelled with microalgae Spirulina (L) - response surface methodology and full factorial method approach. Fuel 285, 119103. doi:10.1016/j.fuel.2020.119103
Solmaz, H., Ardebili, S. M. S., Calam, A., Yilmaz, E., and Ipci, D. (2021). Prediction of performance and exhaust emissions of a CI engine fueled with multi-wall carbon nanotube doped biodiesel-diesel blends using response surface method. Energy 227, 120518. doi:10.1016/j.energy.2021.120518
Sun, X., Kim, S., Yang, S. D., Kim, H. S., and Yoon, J. Y. (2017). Multi-objective optimization of a Stairmand cyclone separator using response surface methodology and computational fluid dynamics. Powder Technol. 320, 51–65. doi:10.1016/j.powtec.2017.06.065
Tan, D. L., Meng, Y., Tian, J., Zhang, C., Zhang, Z., Yang, G., et al. (2023a). Utilization of renewable and sustainable diesel/methanol/n-butanol (DMB) blends for reducing the engine emissions in a diesel engine with different pre-injection strategies. Energy 269, 126785. doi:10.1016/j.energy.2023.126785
Tan, D. L., Wu, Y., Lv, J. S., Li, J., Ou, X. Y., Meng, Y. J., et al. (2023b). Performance optimization of a diesel engine fueled with hydrogen/biodiesel with water addition based on the response surface methodology. Energy 263, 125869. doi:10.1016/j.energy.2022.125869
Teng, T., and Qin, L. (2019). Analysis of regional environment and regional innovation strategy based on cybernetics. Cogn. Syst. Res. 57, 25–31. doi:10.1016/j.cogsys.2018.09.023
Wang, C., Wang, C., Pan, H., and Yue, Y. (2022). Effect of structure parameters on low nitrogen performance of burner based on orthogonal experiment method. Case Stud. Therm. Eng. 39, 102404. doi:10.1016/j.csite.2022.102404
Wang, Z. Q., and Li, L. J. (2022). Effect of pre-injection on combustion and emission characteristics of a diesel engine fueled with diesel/methanol/n-butanol blended fuel. Processes 10 (1), 60. doi:10.3390/pr10010060
Ye, J. D., E, J. Q., and Peng, Q. (2023). Effects of porosity setting and multilayers of diesel particulate filter on the improvement of regeneration performance. Energy 263, 126063. doi:10.1016/j.energy.2022.126063
Yilmaz, N., Atmanli, A., Hall, M. J., and Vigil, F. M. (2022). Determination of the optimum blend ratio of diesel, waste oil derived biodiesel and 1-pentanol using the response surface method. Energies 15 (14), 5144. doi:10.3390/en15145144
Yu, H. L., Tarsitano, D., Hu, X. S., and Cheli, F. (2016). Real time energy management strategy for a fast charging electric urban bus powered by hybrid energy storage system. Energy 112, 322–331. doi:10.1016/j.energy.2016.06.084
Yusup, S., Khan, Z., Ahmad, M. M., and Rashidi, N. A. (2014). Optimization of hydrogen production in in-situ catalytic adsorption (ICA) steam gasification based on Response Surface Methodology. Biomass Bioenergy 60, 98–107. doi:10.1016/j.biombioe.2013.11.007
Zhang, B., Li, X. W., Zuo, Q. S., Yin, Z. B., Zhang, J. P., Chen, W., et al. (2022a). Effects analysis on hydrocarbon light-off performance of a catalytic gasoline particulate filter during cold start. Environ. Sci. Pollut. Res. 29 (51), 76890–76906. doi:10.1007/s11356-022-20519-0
Zhang, B., Li, X. W., Wan, Q., Liu, B., Jia, G. H., and Yin, Z. B. (2023a). Hydrocarbon emission control of an adsorptive catalytic gasoline particulate filter during cold-start period of the gasoline engine. Energy 262, 125445. doi:10.1016/j.energy.2022.125445
Zhang, Y. H., Zhong, Y. H., Wang, J., Tan, D. L., Zhang, Z. Q., and Yang, D. Y. (2021a). Effects of different biodiesel-diesel blend fuel on combustion and emission characteristics of a diesel engine. Processes 9 (11), 1984. doi:10.3390/pr9111984
Zhang, Z. Q., Dong, R., Lan, G., Yuan, T., and Tan, D. L. (2023b). Diesel particulate filter regeneration mechanism of modern automobile engines and methods of reducing PM emissions: A review. Environ. Sci. Pollut. Res. 30 (14), 39338–39376. doi:10.1007/s11356-023-25579-4
Zhang, Z. Q., Dong, R., Tan, D. L., Duan, L., Jiang, F., Yao, X. X., et al. (2023c). Effect of structural parameters on diesel particulate filter trapping performance of heavy-duty diesel engines based on grey correlation analysis. Energy 271, 127025. doi:10.1016/j.energy.2023.127025
Zhang, Z. Q., Li, J. T., Tian, J., Dong, R., Zou, Z., Gao, S., et al. (2022b). Performance, combustion and emission characteristics investigations on a diesel engine fueled with diesel/ethanol/n-butanol blends. Energy 249, 123733. doi:10.1016/j.energy.2022.123733
Zhang, Z. Q., Lv, J. S., Li, W. Q., Long, J. M., Wang, S., Tan, D. L., et al. (2022c). Performance and emission evaluation of a marine diesel engine fueled with natural gas ignited by biodiesel-diesel blended fuel. Energy 256, 124662. doi:10.1016/j.energy.2022.124662
Zhang, Z. Q., Lv, J. S., Xie, G. L., Wang, S., Ye, Y. S., Huang, G. H., et al. (2022d). Effect of assisted hydrogen on combustion and emission characteristics of a diesel engine fueled with biodiesel. Energy 254, 124269. doi:10.1016/j.energy.2022.124269
Zhang, Z. Q., Tian, J., Xie, G. L., Li, J. T., Xu, W. B., Jiang, F., et al. (2022e). Investigation on the combustion and -emission characteristics of diesel engine fueled with diesel/methanol/n-butanol blends. Fuel 314, 123088. doi:10.1016/j.fuel.2021.123088
Zhang, Z. Q., Ye, J. D., Tan, D. L., Feng, Z. Q., Luo, J. B., Tan, Y., et al. (2021b). The effects of Fe2O3 based DOC and SCR catalyst on the combustion and emission characteristics of a diesel engine fueled with biodiesel. Fuel 290, 120039. doi:10.1016/j.fuel.2020.120039
Zhao, X. H., E, J. Q., Liao, G. L., Zhang, F., Chen, J. W., and Deng, Y. W. (2021). Numerical simulation study on soot continuous regeneration combustion model of diesel particulate filter under exhaust gas heavy load. Fuel 290, 119795. doi:10.1016/j.fuel.2020.119795
Zhao, X. H., Jiang, J., Zuo, H. Y., and Jia, G. H. (2023). Soot combustion characteristics of oxygen concentration and regeneration temperature effect on continuous pulsation regeneration in diesel particulate filter for heavy-duty truck. Energy 264, 126265. doi:10.1016/j.energy.2022.126265
Zhao, X. H., Zuo, H. Y., and Jia, G. H. (2022). Effect analysis on pressure sensitivity performance of diesel particulate filter for heavy-duty truck diesel engine by the nonlinear soot regeneration combustion pressure model. Energy 257, 124766. doi:10.1016/j.energy.2022.124766
Keywords: optimization, response surface methodology, engines, diesel–biodiesel, emissions
Citation: Li J, Zhong W, Zhang J, Zhao Z and Hu J (2023) The combustion and emission improvements for diesel–biodiesel hybrid engines based on response surface methodology. Front. Energy Res. 11:1201815. doi: 10.3389/fenrg.2023.1201815
Received: 07 April 2023; Accepted: 08 May 2023;
Published: 30 May 2023.
Edited by:
Xiaohuan Zhao, Jinan University, ChinaCopyright © 2023 Li, Zhong, Zhang, Zhao and Hu. This is an open-access article distributed under the terms of the Creative Commons Attribution License (CC BY). The use, distribution or reproduction in other forums is permitted, provided the original author(s) and the copyright owner(s) are credited and that the original publication in this journal is cited, in accordance with accepted academic practice. No use, distribution or reproduction is permitted which does not comply with these terms.
*Correspondence: Weihuang Zhong, MjIxMDc2ODQ3QHN0ZG1haWwuZ3h1c3QuZWR1LmNu
Disclaimer: All claims expressed in this article are solely those of the authors and do not necessarily represent those of their affiliated organizations, or those of the publisher, the editors and the reviewers. Any product that may be evaluated in this article or claim that may be made by its manufacturer is not guaranteed or endorsed by the publisher.
Research integrity at Frontiers
Learn more about the work of our research integrity team to safeguard the quality of each article we publish.