 Wuyin Yan
 Hui Liu1
 Baijun Han
- 1School of Education, Guangzhou University, Guangzhou, China
- 2School of Continuing, Wenzhou Business College, Wenzhou, China
This data report collected photovoltaic patents under the Industry-University-Research (IUR) collaborative innovation perspective. The evolution of the collaborative innovation network from 2000 to 2019 was studied. The characteristics of patent holders and overall network characteristics was analysed based on Social Network Analysis (SNA), including network size and degree, network density, and network degree centrality. The SNA results show that the network size and degree have increased significantly over time. The network density has become increasingly sparse as PV technology has developed and the number of core network members has increased. Universities and research institutions is gradually shown its clustering role in leading innovations and discipline construction. H01L is the leading knowledge domains studied by the industry, university, and research institutions. F24J and F24S were the second most frequently involved knowledge domains in each stage. Furthermore, two noteworthy knowledge domains are H02J and H02S, which are related to control and regulation of power systems. This analysis provides insights into the energy subjects and knowledge domains within collaborative innovations and education.
1 Introduction
1.1 Global photovoltaic innovation trends and the progress in China
Photovoltaic power generation is an important way to utilize solar energy and is becoming an emerging industry of global concern. It is projected that by 2050, solar photovoltaic power will account for approximately 29% of the total electricity generation worldwide. As one of the major energy-consuming countries, China aims to peak its carbon dioxide emissions before 2030 and achieve carbon neutrality by 2060 (Gao et al., 2022; He et al., 2022; Shang et al., 2023). Promoting technological innovation in renewable energy, particularly solar photovoltaics, has become a key and strategic emerging industry in China (Huang et al., 2021). The “Action Plan for Peak Carbon Emissions by 2030″emphasizes the promotion of large-scale and high-quality development of solar power generation. Similar to other countries, China has prioritized increasing the proportion of photovoltaic power generation as a priority for economic development, urging industries, universities, and research institutions to strengthen research and development investments, as evident from the growth in patents over the past few decades.
Zhang et al. (2022) pointed out that before 2006, the period was a starting point for technology, with a total of only 1,129 patents, showing minimal growth. At that time, the photovoltaic industry heavily relied on foreign markets and technologies. From 2018 to the present, it entered a period of technological maturity, with a continuous increase in the number of patents but a declining growth rate. The industry has developed a relatively mature theoretical and technological foundation, with stable market demand, and relevant enterprises have acquired a certain level of independent research and technological innovation capabilities. Scholars generally believe that the overall number of photovoltaic patents is on the rise, mainly due to the substantial financial subsidies and policy support provided by the government for the development of the photovoltaic industry between 2007 and 2011, such as the “Golden Sun Program” initiated by the central government in 2009. This greatly stimulated the scale development of the solar photovoltaic industry, leading to a gradual increase in patent applications from 420 in 2006 to 5,688 in 2012. The development of photovoltaic technology and industry policies are closely linked.
However, the rapid development in a favourable environment has also led to severe overcapacity issues. With the EU’s anti-dumping measures against Chinese solar panels, the photovoltaic industry experienced losses and bankruptcies from 2011 to 2013. During this period, the growth in related patent applications also became sluggish, with an increase of only 106 patents from 2012 to 2013. Against this backdrop, China began to realize the importance of technological innovation for the sustainable development of the photovoltaic industry, leading to the introduction of various policy measures. Notably, attention was given to industry-university collaboration in innovation. The theoretical foundation of industry-university collaboration originates from knowledge transfer theory, innovation ecosystem theory, and open innovation theory. In terms of patent innovation, research on the knowledge transfer theory of industry-university collaboration, such as Feng et al. (2021), Zheng et al. (2022) and Zheng and Yin (2022), analyzes linear models, interactive models, and triangular models, which indicate that knowledge flows and application between academia and industry are an interactive process of mutual influence and learning. The government plays a crucial coordinating role in this knowledge flow, promoting collaboration among academia, industry, and the government.
1.2 Innovation and industry-university-research strategy in China’s photovoltaic industry
China proposed the concept of industry-university-research cooperation for strategic emerging industries, such as photovoltaics, to achieve more effective technological innovation. The coordination of research and manufacturing is an important source and driver of innovation, and the cooperation between basic and applied research helps commercialize technological achievements earlier (Feng et al., 2021; Chen Guomin et al., 2022; Jiang et al., 2022). Chinese photovoltaic companies began promoting independent innovation in addition to technology introduction, but their technological innovation capabilities are still insufficient. There is a need to connect and cooperate with universities and research institutes to promote the cluster development of industry-university-research innovation. The “PV Leader” plan was introduced to promote cost reductions through technological progress and upgrade technological requirements. The “China Intelligent Photovoltaic Industry Technology Innovation Strategic Alliance” was launched, but industry-university-research cooperation in the photovoltaic field is still a less frequently mentioned topic. Identifying the relationships between industry-university-research innovation entities is helpful in guiding cooperation between these entities at the policy level, but how to identify the technological cooperation mode in the photovoltaic field is still a problem (Wang et al., 2022; Huang et al., 2023; Liu et al., 2023). More and more scholars have recently explored the evolution of industrial technology innovation cooperation networks based on the industry-university-research model. For example, Yu et al. (2022) used social network analysis (SNA) to analyze the patent and national natural science foundation major project cooperation in the biopharmaceutical industry in the Yangtze River Delta region based on the industry-university-research model of patent and fund project cooperation. Pu et al. (2022) used social network analysis to analyze the patent data of industry-university-research cooperation in the new materials industry in Fujian Province from 1991 to 2020. Jianchao et al. (2019) used joint patent application data in the graphene industry in China from 2007 to 2019 to construct a cooperation and innovation network for the graphene industry in China. They found that the cooperation relationships were relatively loose, the level of technological research was uneven, and the regional cooperation was not sufficiently close. These innovation network studies based on patent data provide a good opportunity to understand the dynamics of industry and technological innovation.
1.3 Research objectives
The traditional analysis methods for patent data, such as citation analysis and co-occurrence analysis, are relatively fixed (Liu et al., 2021). However, to improve the accuracy of technology topic granularity and classification, quantitative and qualitative methods are constantly being improved and optimized. Scholarly researchers, such as Yang Bai, have proposed composite methods to promote the refinement of innovation topic recognition for industry-university-research collaboration, such as combining data mining and social network analysis methods. By constructing a patentee-technology cross-co-occurrence network, it is possible to determine the degree of technology cross-occurrence among patentees and identify potential technologies for patent combinations and patent entities for establishing cooperative relationships (Liu et al., 2021; Guo et al., 2022). Therefore, this paper uses patents for cooperation and innovation between industry, University, and research as its indicator of industry-university collaboration and innovation (Chen J. et al., 2022; Yuan and Yang, 2022; Yuan et al., 2023). Based on the cooperation patent data, we construct a cooperation and innovation network for the photovoltaic industry in China and analyse its network characteristics and evolution process. In addition to constructing the photovoltaic industry network, this paper also explores its complex network characteristics. Referring to Pu et al. (2022), we add a provincial cooperation perspective from the network topology of patent entities, which can help to analyse the spatiotemporal evolution of China’s photovoltaic industry cooperation and innovation network at multiple levels.
Based on the analysis of the network, this paper will provide a basis for future technological innovation policy making in the photovoltaic industry. Firstly, it aims to improve the identification of innovation topics in collaboration by utilizing social network analysis techniques to enhance the accuracy of technology topic granularity and classification. Secondly, this paper seeks to explore the complexity of the cooperation and innovation network in the Chinese photovoltaic industry, including its network characteristics and evolutionary process. By analysing the evolution of the industry’s cooperation and innovation network at multiple levels, this study intends to provide valuable insights for future technological innovation policymaking in the photovoltaic industry.
2 Methodology
2.1 Data acquisition and processing
Regarding patent databases, this study utilized patent data from the incopat patent retrieval database, which serves as a specialized patent information platform providing technological innovation intelligence for business decision-makers, R&D personnel, and intellectual property managers. Building upon the research conducted by Pu et al. (2022), we defined the search term as “photovoltaic”. In alignment with previous studies such as Wang et al. (2023), we observed that including granted patents filed in 2020 and 2021 did not effectively capture the network structure and evolution due to the prolonged review period of patent data. Including the latest patent applications would introduce distortions to the conclusions drawn. Therefore, to ensure data comparability and result accuracy, we limited the search range for the application date to “1 January 2000, to 31 December 2019,” encompassing only patents applied for and granted during this period. Our focus was exclusively on applicants (patentees) in China, and a total of 13,704 patent records were retrieved. The applicants (patentees) were defined as cross-disciplinary collaborations between industry, University, and research sectors (Kim and Yoon, 2022), resulting in a total of 2,540 joint patent applications involving industry-university-research partnerships. Adhering to the referencing standards of existing literature, we performed data selection and processing. Specifically, we excluded data that contained only a single type of applicant. Subsequently, we retained patents that involved collaborative efforts between organizations, encompassing any two of photovoltaic enterprises, universities, and research institutes (de Paulo et al., 2023). Based on the preliminary assessment of joint patent applications and the developmental stages of China’s photovoltaic industry, we categorized industry-university-research joint patent applications into three periods: 2000–2010, 2011–2015, and 2016–2019. Besides, International Patent Classification (IPC) codes are used to classify patents into specific technological fields. The use of IPC codes provides standardized classification, accurate analysis, and insights into technological trends and collaborations (Cai et al., 2020; Tang et al., 2023; Zhou et al., 2023).
2.2 Social network analysis
The patent cooperation network can be regarded as a complex system consisting of multiple actors and their relationships, making it applicable to social network analysis. Social network analysis (SNA) has been widely recognized as an effective theoretical method for studying complex social systems. Liu et al. (2019) pointed out that unlike attribute data processed by conventional statistics, social network analysis deals with relational data, where the units of analysis are relationships, and nodes and edges refer to participants and the relationships between them in the social network, respectively. Therefore, this study employs social network analysis methods and utilizes UCINET software to construct the patent cooperation network in China’s photovoltaic manufacturing industry and analyze its structural parameters and evolution patterns.
In the process of constructing the innovation network, there are two methods for describing the overall network: the community graph method and the matrix algebra method. The industry-university-research cooperation and innovation network in China’s photovoltaic industry belong to a one-mode network, where “both rows and columns represent actors from the same set, and the elements in the matrix represent the relationships between actors” (Chunaev, 2020). Since the rows and columns in the selected matrix represent the same participants in the same order, an adjacency matrix is chosen as the descriptive tool. The rows and columns of the matrix represent the patent topics in the industry-university-research innovation network, and the elements in the matrix represent the number of joint patent applications. The construction method of the matrix is as follows:
When
According to Li and Zheng (2023), network density, average clustering coefficient, network centrality, and average shortest path length are important traditional indicators for characterizing network features. Based on previous research and to avoid redundancy and ensure comprehensive analysis, this study examines the network characteristics of both the overall network and individual networks separately. For the overall network, the selected network feature indicators are network density, centrality, and clustering coefficient. The clustering coefficient reflects the degree of node clustering in a graph. The overall network’s clustering coefficient is the average clustering coefficient of the network nodes. The calculation formula is as follows:
Where,
3 Results
3.1 Network characteristics and evolution
3.1.1 Analysis of patent holders
Based on Li and Zheng (2023), the present study constructed the networks. From 2000 to 2010 (Figure 1), there were a total of 280 patent holders in the network, indicating a relatively small number. During this period, universities and research institutes, such as U77 (Tsinghua University), U8 (Southeast University), U241 (Zhejiang University), and U9 (Shanghai Jiao Tong University), played a dominant role. These academic and research institutions held central positions in the network, highlighting their advantages in scientific research, innovation, and information exchange. They exhibited extensive collaboration and had a strong ability to control resources within the network. While there were some patents from enterprises, their positions in the network were relatively disadvantaged. They were unable to match the universities and research institutes in terms of R&D in innovative technologies and the transformation of innovation achievements. Consequently, they still need to make greater efforts to independently pursue industry-university-research collaboration for innovation.
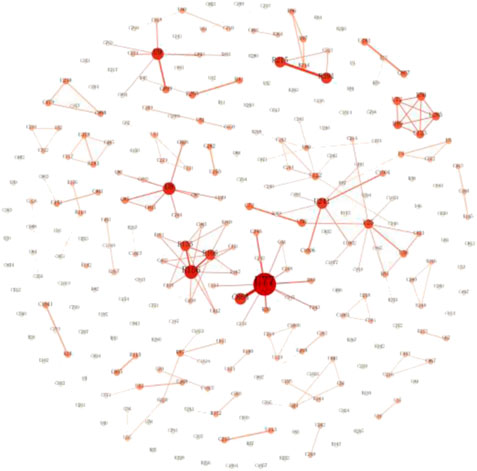
FIGURE 1. IUR collaborative innovation network from 2000 to 2010.
From 2011 to 2015 (Figure 2), the number of patent holders participating in industry-university-research (IUR) collaboration significantly increased to 776, indicating an expansion of the collaboration scope. Surprisingly, C5 (State Grid Corporation of China) rapidly assumed an absolute central position in the network structure during this period. There were 397 patent holders with a degree centrality greater than 5, suggesting a considerable number of nodes in the network had a high degree of centrality. While universities and research institutions like U8, U9, U77, and R129 (Bengbu Institute of Glass Industry Design) still exerted control over the innovation collaboration in the field of photovoltaics within their limited scope, there was a notable disparity compared to the industry-academic collaboration led by C5. The dominant position of C5 in innovation collaboration can be attributed to its substantial resources and influence in the photovoltaic sector as the State Grid Corporation of China. As a key player in the country’s energy supply and distribution, C5 holds significant importance. Its technical and financial strength in the photovoltaic field makes it the preferred choice for potential partners seeking collaboration. Furthermore, the State Grid Corporation of China actively implements measures such as providing financial support and policy guidance to attract and promote more industry-academic collaborations. These efforts further enhance its dominant position in the IUR collaboration within the photovoltaic industry. In summary, the ability of the State Grid Corporation of China to control photovoltaic technology innovation collaboration from 2011 to 2015 is primarily due to its substantial resources and influence in the photovoltaic field, as well as proactive policy support and guidance. This has positioned the company as an ideal choice for collaboration, further driving the development of industry-academic collaboration in the photovoltaic sector.
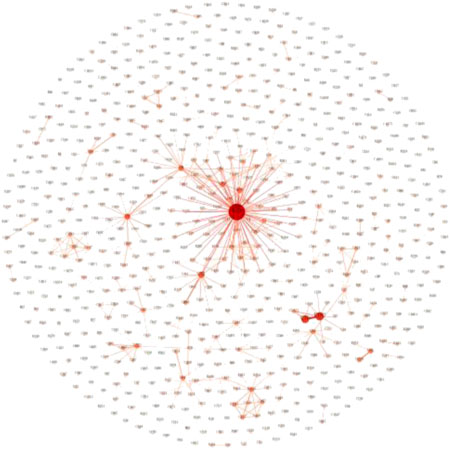
FIGURE 2. IUR collaborative innovation network from 2011 to 2015.
From 2016 to 2019 (Figure 3), the number of patent holders participating in the industry-university-research cooperation innovation network increased to 1,128, and there was a noticeable rise in overall collaboration among the nodes. Among them, 429 patent holders had a degree centrality greater than 9. During this period, the industry-university-research innovation network further solidified the dominant position of State Grid Corporation of China (C5) as the driving force, and the emergence of subsidiary companies like C9 expanded their control over collaborative innovation. This highlighted the sustained influence and power of C5 in driving cooperative efforts within the network. The strong presence of C5 can be attributed to its status as a significant state-owned enterprise, as well as its wide-ranging resources and capabilities. However, it is worth noting that universities and research institutions began to play a more prominent role. Entities such as U77 (Tsinghua University), U9 (Shanghai Jiao Tong University), U40 (Donghua University), U50 (South China University of Technology), and R122 (Shanghai Institute of Ceramics, Chinese Academy of Sciences) gradually formed new clusters within the network, showcasing their potential to counterbalance C5’s dominant position in future innovation collaborations. This indicates that academic and research institutions are becoming increasingly influential and capable of driving innovation. The increased participation of universities and research institutions signifies a diversification of knowledge sources and expertise within the network Table 1.
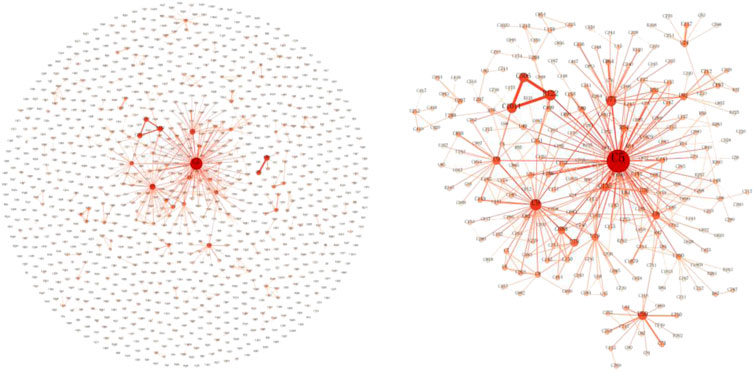
FIGURE 3. IUR collaborative innovation network from 2016 to 2019.
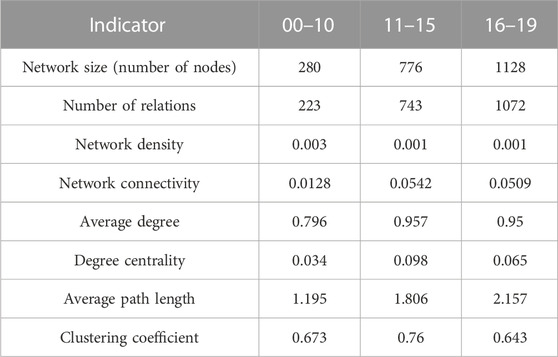
TABLE 1. Characteristics of collaborative innovation network.
3.1.2 Network overall characteristics analysis
Through the analysis of social networks in three time periods (00–10, 11–15, and 16–19), the following results can be observed in Table 1:
In the 00–10 period, the social network had a size of 280 nodes. The network density was 0.003, indicating relatively few connections between nodes. The network connectivity was 0.0128, suggesting sparse relationships between nodes. The average degree was 0.796, meaning each node was connected to an average of 0.796 other nodes. The degree centrality of the network was 0.034, reflecting a small number of nodes with high degrees. The average path length was 1.195, indicating an average distance of 1.195 connections between any two nodes. The clustering coefficient was 0.673, indicating a relatively high level of node clustering in the network.
In the 11–15 period, the social network expanded to 776 nodes, indicating an increase in the number of participants. The network density was 0.001, suggesting relatively few connections between nodes. The network connectivity was 0.0542, indicating sparse relationships in the network. The average degree increased to 0.957, meaning each node was connected to an average of 0.957 other nodes. The degree centrality of the network was 0.098, indicating a small number of nodes with high degrees. The average path length increased to 1.806, indicating longer average distances between any two nodes. The clustering coefficient was 0.76, indicating an improvement in node clustering in the network.
In the 16–19 period, the social network further expanded to 1,128 nodes, indicating a continued increase in the number of participants. The network density was 0.001, indicating relatively few connections between nodes. The network connectivity was 0.0509, signifying sparse relationships in the network. The average degree was 0.95, meaning each node was connected to an average of 0.95 other nodes. The degree centrality of the network was 0.065, reflecting a small number of nodes with high degrees. The average path length increased to 2.157, indicating further elongated average distances between any two nodes. The clustering coefficient was 0.643, suggesting a slight decrease in node clustering but still relatively high.
Overall, analyzing the social network characteristics in these three time periods, we observe a gradual increase in network size, number of relationships, and network density. This indicates a growing number of participants and connections in the social network. However, the changes in network connectivity and clustering coefficient are inconsistent. Network connectivity increased in the 11–15 period but stabilized in the 16–19 period. The clustering coefficient was relatively high in the 00–10 period but slightly decreased in the following two periods. The average degree and degree centrality of the network showed a relatively stable trend across these three periods. The average path length increased in the latter two periods, indicating longer distances between nodes.
3.2 Evolution of collaborative knowledge domains
The use of IPC codes allowed for the construction of a photovoltaic knowledge network, which visualized the collaborative knowledge domains among institutions. The network consisted of yellow circular nodes representing industrial, academic, and research institutions, with their size indicating the number of collaborative patents in various domains. Green square nodes represented the knowledge domains studied by institutions, with their size indicating the number of institutions applying for collaborative patents in those domains. The width and color of the edges represented the frequency of institution collaboration in those domains.
The knowledge network diagrams for the three stages were presented in Figures 1–4. The findings revealed that as energy storage technology advanced and the number of core network members increased from 272 to 397 and then to 429, the energy storage domains involved in collaboration gradually expanded from 105 to 179 and eventually to 231. However, the network density became increasingly sparse, with values decreasing from 0.003 to 0.001 and then to 0.001. These observations demonstrate the evolving nature of collaborative efforts in the energy storage sector and highlight the expansion of knowledge domains and the growing complexity of inter-institutional relationships over time.
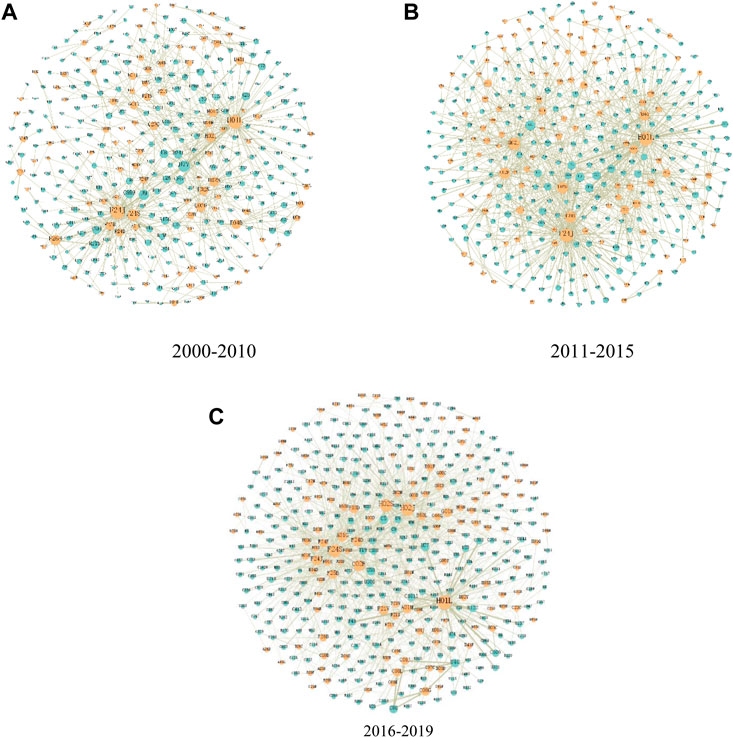
FIGURE 4. Evolutionary map of bipartite collaborative knowledge network (A): 2000–2010, (B): 2011–2015, (C): 2016–2019.
In each stage, H01L was the most frequent knowledge domain involved in collaboration, focusing on methods or devices for directly converting chemical, solar, or thermal energy into electrical energy. Innovation collaboration related to H01L spanned various entity types, indicating the broad collaborative nature of research in this domain. F24J and F24S were the second most frequently involved knowledge domains in each stage. F24J pertains to solar collector systems, while F24S is related to devices and methods for solar energy systems. The research domain of F24J primarily involves solar collector systems used to collect solar energy and convert it into usable thermal energy. These systems often include components such as reflectors, absorbers, and thermal storage devices, capturing and concentrating solar energy for applications like hot water supply, heating, or other thermal energy uses. In contrast, the research domain of F24S primarily focuses on devices and methods for converting solar energy into electrical energy or other forms of usable energy. This may involve components or technologies such as photovoltaic cells, inverters, battery energy storage systems, grid connections, etc., to achieve efficient utilization and integration of solar energy. In the first stage, although F24J had a slightly higher involvement frequency than F24S, they were generally comparable. In the second stage, F24J had a significantly higher involvement frequency than F24S, but in the third stage, F24S surpassed F24J by a large margin. This indicates that the research on solar energy system devices and methods gradually became a primary collaborative domain throughout this process. The reason could be attributed to the increasing focus of research institutions and the industry on solar energy system devices and methods due to the development of solar energy technologies, aiming for higher efficiency, reliability, and sustainable utilization of solar energy. Furthermore, two noteworthy knowledge domains are H02J and H02S, which are related to control and regulation of power systems. In the three stages, the involvement frequency in this domain increased successively and became an important knowledge domain comparable to F24S in the third stage. Notably, H02J has consistently been a focal innovation domain of the State Grid Corporation of China, indicating sustained attention and investment in research on power system control and regulation. This is because stable operation and optimized regulation of photovoltaic systems have become a focus in response to the demand for power systems.
4 Conclusion
In conclusion, the research presented in this study focuses on the cooperation and innovation network in the Chinese photovoltaic industry. The research methodology employed social network analysis (SNA) to analyze the patent cooperation network in the photovoltaic industry. Network characteristics such as density, clustering coefficient, centrality, and shortest path length were examined to understand the structure and dynamics of the network. The analysis revealed the dominant role of universities and research institutes in the early stages, while later periods saw increased participation from enterprises and the emergence of key players in the network. This study analyzed the collaboration and knowledge domains in the field of photovoltaic technology. The findings showed that energy storage and solar energy system devices and methods were the primary collaborative domains, indicating increased focus on efficient utilization of solar energy. Additionally, control and regulation of power systems emerged as an important knowledge domain, reflecting the demand for stable operation of photovoltaic systems.
While this study provides valuable insights into the characteristics and evolution of the industry-university-research collaboration innovation network in the photovoltaic industry in China, it is important to acknowledge its limitations. Firstly, the focus of the study on patent holders restricts the analysis to a specific subset of innovation activities, potentially overlooking the contributions of non-patent holders and the broader innovation process. Consequently, the findings may not fully represent the overall innovation landscape in the photovoltaic industry. Secondly, the study relies primarily on quantitative methods, which may limit the exploration of qualitative aspects such as the motivations and strategies of innovation entities involved in industry-university-research collaboration. A more comprehensive understanding could be achieved by incorporating qualitative research methods to complement the quantitative analysis. Thirdly, the study’s time frame from 2000 to 2019 may not capture the most recent developments and emerging trends in the photovoltaic industry-university-research collaboration innovation network in China. Given the rapidly evolving nature of the industry, future research should consider including more recent data to provide a more up-to-date analysis. Lastly, it is important to note that the study specifically focuses on the photovoltaic industry in China, and the findings may not be directly applicable to other industries or countries. Further research is needed to investigate industry-university-research collaboration networks in different contexts to gain a more comprehensive understanding of innovation dynamics. By acknowledging these limitations, future research can address these areas and further enhance our understanding of industry-university-research collaboration and innovation networks in the photovoltaic industry and beyond.
In summary, this study provides a useful framework for understanding the network characteristics and evolution of the photovoltaic industry-university-research collaboration innovation network in China. Future research could use a more comprehensive approach to analyze the innovation landscape and strategies of innovation entities in industry-university-research collaboration activities, and extend the analysis to other industries and countries to further deepen our understanding of the dynamics of innovation networks (Zhuo et al., 2021; Xu et al., 2021; Cheng et al., 2022; Hu et al., 2023).
Data availability statement
The original contributions presented in the study are included in the article/supplementary material, further inquiries can be directed to the corresponding author.
Author contributions
WY contributed to the study conception and design. Material preparation, data collection, and analysis were performed by WY and HL. The draft of the manuscript was written by WY. The revision was made by BH and WY. The supervision was performed by BH. All authors contributed to the article and approved the submitted version.
Funding
This research has received support from the Guangdong Higher Education Society's “14th Five-Year Plan” for Higher Education Research Projects in 2021, under the project titled “Research on the Construction of Quality Assurance System for Teaching in Private Undergraduate Colleges in Guangdong Province from the Perspective of Student Learning Experience” (Project No: 21GYB03).
Acknowledgments
This research thanks for the comments from reviewers. The authors would like to take this opportunity to thank the data collection assistants.
Conflict of interest
The authors declare that the research was conducted in the absence of any commercial or financial relationships that could be construed as a potential conflict of interest.
Publisher’s note
All claims expressed in this article are solely those of the authors and do not necessarily represent those of their affiliated organizations, or those of the publisher, the editors and the reviewers. Any product that may be evaluated in this article, or claim that may be made by its manufacturer, is not guaranteed or endorsed by the publisher.
References
Cai, H. H., Sarpong, D., Tang, X., and Zhao, G. (2020). Foreign patents surge and technology spillovers in China (1985-2009): Evidence from the patent and trade markets. Technol. Forecast. Soc. Change 151, 119784. doi:10.1016/j.techfore.2019.119784
Chen, Guomin, Chen, Pengrun, Huang, Wenxia, and Zhai, Jie (2022a). Continuance intention mechanism of middle school student users on online learning platform based on qualitative comparative analysis method. Math. Problems Eng. 2022, 1–12. Article ID 3215337. doi:10.1155/2022/3215337
Chen, J., Sun, B., Li, Y., Jing, R., Zeng, Y., and Li, M. (2022b). Credible capacity calculation method of distributed generation based on equal power supply reliability criterion. Renew. Energy 201, 534–547. doi:10.1016/j.renene.2022.10.129
Cheng, M., Cui, Y., Yan, X., Zhang, R., Wang, J., and Wang, X. (2022). Effect of dual-modified cassava starches on intelligent packaging films containing red cabbage extracts. Food Hydrocoll. 124, 107225. doi:10.1016/j.foodhyd.2021.107225
Chunaev, P. (2020). Community detection in node-attributed social networks: A survey. Comput. Sci. Rev. 37, 100286. doi:10.1016/j.cosrev.2020.100286
de Paulo, A. F., de Oliveira Graeff, C. F., and Porto, G. S. (2023). Uncovering emerging photovoltaic technologies based on patent analysis. World Pat. Inf. 73, 102181. doi:10.1016/j.wpi.2023.102181
Feng, Q., Feng, Z., Su, X., Bai, Y. D., and Ding, B. Y. (2021). Design and simulation of human resource allocation model based on double-cycle neural network. Comput. Intell. Neurosci. 2021, 1–10. doi:10.1155/2021/7149631
Gao, X., Yu, K., Zhao, Y., Zhang, T., Wen, J., Liu, Z., et al. (2022). Effects of subtle change in side chains on the photovoltaic performance of small molecular donors for solar cells. Chin. Chem. Lett. 33 (10), 4659–4663. doi:10.1016/j.cclet.2021.12.055
Guo, W., Ding, Q., Li, X., and Sun, S. (2022). “Research on patent network structure of advanced materials industry in the central plains urban agglomeration,” in 2022 IEEE 6th Advanced Information Technology, Electronic and Automation Control Conference (IAEAC), Beijing, China, October 2022 (IEEE), 757–765.
He, J., Han, N., Xia, M., Sun, T., and Ghaebi, H. (2022). Multi-objective optimization and exergoeconomic analysis of a multi-generation system based on biogas-steam reforming. Int. J. Hydrogen Energy 48, 21161–21175. doi:10.1016/j.ijhydene.2022.12.093
Hu, F., Qiu, L., Xiang, Y., Wei, S., Sun, H., Hu, H., et al. (2023). Spatial network and driving factors of low-carbon patent applications in China from a public health perspective. Front. Public Health 11, 1121860. doi:10.3389/fpubh.2023.1121860
Huang, C., Han, Z., Li, M., Wang, X., and Zhao, W. (2021). Sentiment evolution with interaction levels in blended learning environments: Using learning analytics and epistemic network analysis. Australas. J. Educ. Technol. 37 (2), 81–95. doi:10.14742/ajet.6749
Huang, X., Chen, N., Ye, D., Zhong, A., Liu, H., Li, Z., et al. (2023). Structurally complementary star-shaped unfused ring electron acceptors with simultaneously enhanced device parameters for ternary organic solar cells. Sol. RRL 7, 2300143. doi:10.1002/solr.202300143
Jianchao, H., Tongning, M., and Pingkuo, L. (2019). Comprehensive evaluation on graphene's potentials and industrial development in China. Resour. Policy 63, 101446. doi:10.1016/j.resourpol.2019.101446
Jiang, S., Zhao, C., Zhu, Y., Wang, C., Du, Y., Lei, W., et al. (2022). A practical and economical ultra-wideband base station placement approach for indoor autonomous driving systems. J. Adv. Transp. 2022, 1–12. doi:10.1155/2022/3815306
Kim, S., and Yoon, B. (2022). Multi-document summarization for patent documents based on generative adversarial network. Expert Syst. Appl. 207, 117983. doi:10.1016/j.eswa.2022.117983
Li, W., and Zheng, X. (2023). Development mechanism and technological innovation of hydrogen energy: Evaluating collaborative innovation based on hydrogen patent data. Int. J. Hydrogen Energy. doi:10.1016/j.ijhydene.2023.05.310
Liu, B., Zhou, Q., Ding, R. X., Palomares, I., and Herrera, F. (2019). Large-scale group decision making model based on social network analysis: Trust relationship-based conflict detection and elimination. Eur. J. Operational Res. 275 (2), 737–754. doi:10.1016/j.ejor.2018.11.075
Liu, W., Song, Y., and Bi, K. (2021). Exploring the patent collaboration network of China's wind energy industry: A study based on patent data from cnipa. Renew. Sustain. Energy Rev. 144, 110989. doi:10.1016/j.rser.2021.110989
Liu, Z., Feng, J., and Uden, L. (2023). From technology opportunities to ideas generation via cross-cutting patent analysis: Application of generative topographic mapping and link prediction. Technol. Forecast. Soc. Change 192, 122565. doi:10.1016/j.techfore.2023.122565
Pu, G., Zhu, X., Dai, J., and Chen, X. (2022). Understand technological innovation investment performance: Evolution of industry-university-research cooperation for technological innovation of lithium-ion storage battery in China. J. Energy Storage 46, 103607. doi:10.1016/j.est.2021.103607
Shang, Y., Lian, Y., Chen, H., and Qian, F. (2023). The impacts of energy resource and tourism on green growth: Evidence from Asian economies. Resour. Policy 81, 103359. doi:10.1016/j.resourpol.2023.103359
Tang, S., Cai, H. H., Xia, M., and Turi, A. N. (2023). “The surge in blockchain-based patent applications: Booster or bumps?,” in Financial technologies and DeFi: A revisit to the digital finance revolution (Cham: Springer International Publishing), 111–121.
Wang, H., Dai, J., Wei, H., and Lu, Q. (2023). Understanding technological innovation and evolution of energy storage in China: Spatial differentiation of innovations in lithium-ion battery industry. J. Energy Storage 66, 107307. doi:10.1016/j.est.2023.107307
Wang, P., Yu, P., Huang, L., and Zhang, Y. (2022). An integrated technical, economic, and environmental framework for evaluating the rooftop photovoltaic potential of old residential buildings. J. Environ. Manag. 317, 115296. doi:10.1016/j.jenvman.2022.115296
Xu, Q., Zhang, J., Wang, D., and Li, Y. (2021). Single-atom site catalysts supported on two-dimensional materials for energy applications. Chin. Chem. Lett. 32, 3771–3781. doi:10.1016/j.cclet.2021.05.032
Yu, W., Chen, H., Tian, J., Cao, Z., Li, M., Lv, Y., et al. (2022). A decade-long innovative collaboration network between hospitals and the biomedical industry in China: A social network analysis. Res. Square. doi:10.21203/rs.3.rs-1563398/v1
Yuan, H., and Yang, B. (2022). System dynamics approach for evaluating the interconnection performance of cross-border transport infrastructure. J. Manag. Eng. 38 (3). doi:10.1061/(ASCE)ME.1943-5479.0001015
Yuan, Q., Kato, B., Fan, K., and Wang, Y. (2023). Phased array guided wave propagation in curved plates. Mech. Syst. Signal Process. 185, 109821. doi:10.1016/j.ymssp.2022.109821
Zhang, W. H., Chou, L. C., and Chen, M. (2022). Consumer perception and use intention for household distributed photovoltaic systems. Sustain. Energy Technol. Assessments 51, 101895. doi:10.1016/j.seta.2021.101895
Zheng, W., and Yin, L. (2022). Characterization inference based on joint-optimization of multi-layer semantics and deep fusion matching network. PeerJ Comput. Sci. 8, e908. doi:10.7717/peerj-cs.908
Zheng, W., Zhou, Y., Liu, S., Tian, J., Yang, B., and Yin, L. (2022). A deep fusion matching network semantic reasoning model. Appl. Sci. 12 (7), 3416. doi:10.3390/app12073416
Zhou, H., Zhu, X., Dai, J., and Wu, W. (2023). Innovation evolution of industry-university-research cooperation under low-carbon development background: In case of 2 carbon neutrality technologies. Sustain. Energy Technol. Assessments 55, 102976. doi:10.1016/j.seta.2022.102976
Keywords: university, subject, patents, social network analysis, energy, IPC, knowledge domain
Citation: Yan W, Liu H and Han B (2023) Industry–university–research knowledge flow in energy subjects: evolution of network structure in collaborative photovoltaic innovations. Front. Energy Res. 11:1198998. doi: 10.3389/fenrg.2023.1198998
Received: 02 April 2023; Accepted: 14 June 2023;
Published: 23 June 2023.
Edited by:
Ronghui Zhang, Sun Yat-sen University, ChinaReviewed by:
Xihui Chen, Zhejiang University of Technology, ChinaMuhammad Kamran Khan, Bahria University, Pakistan
Copyright © 2023 Yan, Liu and Han. This is an open-access article distributed under the terms of the Creative Commons Attribution License (CC BY). The use, distribution or reproduction in other forums is permitted, provided the original author(s) and the copyright owner(s) are credited and that the original publication in this journal is cited, in accordance with accepted academic practice. No use, distribution or reproduction is permitted which does not comply with these terms.
*Correspondence: Baijun Han, aGFuYmFpanVuMjAyMkBvdXRsb29rLmNvbQ==