 Liqin Li
 Minye Rao
- 1School of Accounting, Fujian Jiangxia University, Fuzhou, China
- 2School of Cultural Tourism and Public Administration, Fujian Normal University, Fuzhou, China
Research and promotion of green technology can improve energy efficiency and help to optimize energy structure, which are key considerations in achieving the “dual carbon” goals of carbon peaking and carbon neutrality. Owing to the “dual externality” arising from green technology innovation (GTI), government policies have an important impact on this area. Environmental taxes and government subsidies are important means for governments to improve GTI and optimize energy utilization, with different environmental taxes and subsidies having different impacts. This study evaluates the impact of environmental taxes and government subsidies in China from 2009 to 2019, and assesses how these policies interacted with each other to determine China’s efficiency in GTI over this period. The study’s findings based on analysis of 30 provinces and cities in China indicate that environmental taxes have a threshold effect on the development of green technologies, and that the current level of taxation is insufficient to encourage optimized development in this area. Government subsidies can also help to reduce the negative effects arising from the current environmental tax burden. To optimize government policy implementation in this area, improve the level of GTI, and improve energy use efficiency, this study proposes countermeasures based on differentiated policies, including gradually increasing the rate and scope of environmental taxation, and strengthening the supervision of government subsidies.
1 Introduction
The traditional extensive economic growth model based on “high energy consumption and high pollution risks” has produced rapidly increasing GDP growth over the last 40 years. However, it has also resulted in significant energy waste and environmental pollution. In 2021, China’s carbon emissions reached 1.023 billion tons, making China the world’s number one carbon emitting nation. Reducing carbon emissions while achieving the goals of carbon peaking and carbon neutrality is a major challenge for China to realize in tandem with continued high-quality economic development. The 20th Communist Party of China (CPC) National Congress Report points out China’s ambition to “actively yet prudently realize the goals of carbon peak and carbon neutrality,” and “promote clean, low-carbon and efficient use of energy.” If China is to realize each of these goals, green technology innovation (GTI) will be an essential contributing factor (Sun et al., 2019).
As R&D and promotion of green technology alongside updated industrial production technology can improve energy efficiency at root, green technology plays a vital role in optimizing energy efficiency. This being the case, Green technology innovation efficiency (GTIE) is an important indicator of GTI development. The utility ratio of technology input to technology output is an environmental effect indicator for integrating ecological protection into the calculation despite the controversial definitions. Because it can directly affect energy usage and the quality of green economic development, it is an important measure for countries to evaluate the effect of environmental and economic policies.
Because green technology innovation has “double externality” which results from the effect of technology spillover and green spillover. So governments typically utilize environmental taxation and financial subsidies to encourage businesses’ innovative behavior (Huang et al., 2022; Shao and Chen, 2022). Levying environmental taxes and fees raises the pollution costs of enterprises and motivates them to carry out GTI, while government subsidies can lower the innovation costs of enterprises. Governments frequently combine both of these tools to optimize energy use and advance the level of GTI. The environmental tax burden will directly affect GTI behavior, while government subsidies at different environmental tax burden levels will produce different policy effects. On 1 January 2018, China formally implemented an environmental tax, “shifting” the long-standing pollution fee to create an independent environmental tax system. Simultaneously, the Chinese government has lowered enterprise R&D costs and boosted enterprise innovation power by providing subsidies for scientific and technological innovation while also restricting emission charges and environmental taxes. Numerous studies have already been carried out on the effects of environmental taxes and government subsidies on the development of green technologies, and which lay the foundation for this study’s research and analysis. However, the selection of GTI indicators has been biased and one-sided, so, this paper uses GTIE which is a multi-input and multi-output comprehensive measurement to assess the overall advancement of GTI. This makes the empirical conclusions more objective and credible. In practice, the government uses a combination of environmental taxes and government subsidies to promote GTI, but existing research has focused on the unilateral effects of environmental taxes and government subsidies on GTI. This paper uses panel threshold model to analyze not only the threshold effect of environmental tax on GTIE, but also the comprehensive impact of the combination of environmental tax and government subsidy policies on GTIE. And it will make the empirical research in this paper more accurate and comprehensive.
The following questions are addressed through empirical analysis using the super-efficiency Slacks-Based Measure (SBM) and panel threshold models:
Research Question 1. Is there a threshold effect from the environmental tax burden on GTI in China?
Research Question 2. Is the current environmental tax burden in the appropriate space to promote GTI after the change of “fees into taxes?”
Research Question 3. Given China’s current environmental tax burden, is the implementation of government subsidies effective?The study’s findings clearly indicate that the effects of combining different policies should be considered in future policy modifications. GTI should be extensively encouraged; and the “dual carbon” target should be actively advanced on a consistent basis.
2 Literature review
Environmental taxes and government subsidies are the key factors affecting enterprises’ R&D costs and benefits. Many studies have already been implemented concerning the impact of environmental taxes and government subsidies on GTI, as well as the measurement of GTIE.
2.1 Research on the evaluation methods and indicator system of GTIE
According to existing body of literature, researchers have already developed mature evaluation methods and indicator systems for GTI with diverse perspectives and dimensions. Data envelopment analysis (DEA) and Stochastic frontier analysis (SFA) are commonly used methods for studying GTIE, with a number of researchers having expanded DEA in various forms. DEA in particular, which subdivides the GTI process into two stages connected by value, has been widely used across a number of previous studies (Zhang, 2016; Fried et al., 2002) studied GTIE based on a three-stage DEA, whereas (Han et al., 2017) conducted their study based on a four-stage DEA. Minviel and Sipilainen (2021) explored the efficiency of technological innovation using an SFA model, while (WooPyeong and Kang, 2018) applied the SFA model to measure the level of green industrial development in China. In terms of selecting an indicator system, GTI is a complex process involving multiple inputs and outputs. Unlike the efficiency evaluation of traditional technological innovation, GTI integrates environmental protection evaluation indicators. The relevant input indicators are R&D, labor, and energy consumption, while the output indicators are knowledge, economic benefits, and environmental protection. Based on the main input and output indicators, most researchers have specified indicators to measure GTIE in China based on their respective research directions and regions (Coh, 2010; Harc and Alic, 2018).
2.2 Research on the impact of environmental taxes on GTI
Environmental taxation has a dual impact (innovation compensation and compliance cost) on GTI. Whether an enterprise chooses to engage in GTI depends on whether the innovation benefits can offset the environmental costs. In terms of the impact of government subsidies on GTI, there are three perspectives: promotion, inhibition, and uncertainty.
The first is promotion. Some researchers believe that technological innovation can improve an enterprise’s performance and competitiveness and that the benefits generated offset the environmental regulation costs (Porter, 1991). According to (Cai et al., 2020), direct environmental regulation is a positive incentive for enterprises to innovate, further encouraging technological innovation and reducing pollutant emissions (Aronsson, 2005; Zhu et al., 2017). Environmental tax, a market-based environmental regulation incentive, promotes GTI more effectively than other more direct forms of environmental regulation (Jaffe et al., 2005; Pezzey and Jotzo, 2013). The transition from pollutant discharge fees to environmental taxes in China has significantly promoted enterprises’ adoption of GTI (Kolsuz and Yeldan, 2017). The second perspective is that of inhibition. According to some scholars, environmental regulation increases the cost of pollution prevention and control and prevents enterprises from carrying out GTI. It has been shown that improperly designed environmental tax systems do not provide an adequate incentive function (Wang-Helmreich and Kreibich, 2019). Kang and Jin (2002) conducted empirical tests on the middle and lower reaches of the Yangtze River and discovered that ER implementation made it difficult to improve regional production efficiency. An empirical study of EU countries by Ganda and Garidzirai (2020) shows environmental taxes do not improve energy efficiency (Ganda and Garidzirai, 2021). The third perspective is that of uncertainty. Some researchers have posited that there is a non-linear relationship between environmental regulation and GTI, and that this relationship is uncertain owing to differences across regions and industries. Whether environmental regulation can play a role in promoting GTI depends on the innovation compensation and compliance cost effects. The strengths of both effects are related to environmental regulation intensity (ERI). Some researchers have suggested that environmental regulation has a “U-shaped” effect on GTI that stimulates enterprises to innovate after surpassing the lowest point (Yang and Zeng, 2018; Wang et al., 2021). However, other researchers have argued that environmental regulation has an inverted “U-shaped” effect on GTI., From the perspective of regional competition Li and He (2018), Wang et al. (2019), and Fan et al. (2021) found using industrial panel data that environmental regulation first promoted and then inhibited GTI. The impact of environmental regulation on GTI has also been shown to vary across different industries (Song and Xue, 2022), as well as different regions (Eunmi et al., 2020).
2.3 Research on the impact of government subsidies on GTI
According to some researchers, government subsidies can partially compensate for the spillover effect of GTI, deliver beneficial information to external capital markets, and promote the external financing of enterprises and GTI (Xing et al., 2019; Wu and Hu, 2020).
However, a small number of researchers have suggested that government subsidies can reduce enterprises’ R&D investment, which is not conducive to technological innovation (Boeing, 2016). Moreover, as the government cannot supervise whether enterprises use subsidies for GTI, enterprises may engage in rent-seeking behavior or adopt earnings management strategies focused on areas other than GTI to obtain government subsidies for alternative purposes (Olson, 2014; Dai and Pan, 2018).
Some researchers have also cited that government subsidies may have different impacts on different enterprises owing to different R&D costs, market demands, and enterprises’ operating abilities. From this perspective, government subsidies help enterprises save R&D funds and encourage enterprises to adopt GTI before the curve passes the inflection point (Xiao et al., 2017), but have an inverted “U-shaped” effect on GTI from this point onwards (Ren and Nie, 2018).
2.4 Research gaps
Various shortcomings remain in the existing body of GTI literature. First, although advanced methods and indicators have been adopted, researchers still tend to demonstrate a preference for a limited number of indicators for measuring GTIE. Second, much controversy remains over the impact of environmental taxes and government subsidies on the GTI. Researchers in this area come from different regions and industries, and sometimes neglect the interaction between these two factors, making it difficult to reach a point of consensus.
Some researchers have examined the impact of environmental taxes and government subsidies on GTI and have stated that a combination of these two policy instruments can play a significant role in stimulating GTI (Acemoglu et al., 2012; Liu and Guo, 2021), while government subsidies specifically can improve local green innovation capacity (Li, 2021). However, different environmental taxes have different impacts on enterprises’ GTI, meaning government subsidies that operate in tandem with different environmental taxes also have different impacts on GTI. Previous studies have failed to analyze the impact mechanism of the combination of environmental taxes and government subsidies on GTI in an in-depth manner.
Previous studies have tended to utilize single indicators such as the number of patent applications and patent grants, which obviously cannot comprehensively measure substantive progress in the area of GTI. Existing studies have also failed to reach a consensus on the impact of environmental taxes and government subsidies on GTI, a fact that is related to differences in the industrial and regional data used by different researchers alongside a lack of comprehensive consideration of their interactions. Although researchers have placed some focus on the impact of both environmental taxes and government subsidies, the existing body of literature does not clearly define the impact of government subsidies under different tax burden levels, and so cannot advise on how to optimize both policy instruments in combination.
2.5 Research innovations
Based on the above analysis, this paper offers the following innovative proposals. First, the influence mechanisms of environmental taxes, government subsidies, and both of these policy instruments in combination on GTI were established in this study to thoroughly analyze the effects of government subsidies under different taxes. Second, this study uses GTIE as the measurement indicator. Previous empirical analyses have mainly focused on the direct output corresponding to GTI, such as the number of green patent applications and patent grants, which can only serve as a partial indicator and fail to cover a range of scenarios. According to the findings of this study, environmental taxes and government subsidies, as key factors influencing GTI, also affect enterprises’ sci-tech output. Only by using GTIE as the measurement indicator can the substantive progress of GTI be accurately gauged. Third, based on panel data from 30 Chinese provinces and cities, this study uses the threshold effect to assess the impact of current environmental taxes on GTI, and examines the regulatory effect of government subsidies on the threshold value.
3 Impact mechanism and research hypothesis of environmental taxes and government subsidies on GTIE
The following section discusses the impact of government subsidies on enterprise costs and benefits, and the impetus for GTI under different levels of ERI.
3.1 Analysis of enterprise GTI under weak ERI
In a situation in which the level of ERI is weak and there are no government subsidies, innovation costs are greater than environmental regulation costs owing to the high costs and risks associated with GTI. Under these circumstances, enterprises prefer to utilize old technologies and pay the accompanying pollutant discharge fees to meet environmental regulation requirements. Government subsidies can reduce innovation costs and encourage enterprises to make technological innovations. However, in a scenario in which environmental regulation is weak, environmental regulation costs may be completely ignored, and enterprises may lack the motivation to carry out GTI. To maximize the benefits accrued, especially in the context of insufficient government supervision of R&D subsidies, enterprises may use government subsidies for purposes other than R&D, producing a “crowding-out effect” on enterprise R&D investment.
3.2 Analysis of enterprise GTI under moderate ERI
As ERI increases, avoidance costs increase also. Without technological innovation, environmental costs will permanently increase enterprises’ costs and reduce competitiveness. Therefore, after weighing the long-term innovation benefits and environmental regulation costs, enterprises change the way they allocate capital. Through GTI, firms increase innovation input, improve production efficiency, and obtain innovation compensation. Moderate government subsidies reduce GTI costs and enhance enterprises’ impetus to engage in GTI. However, if government subsidies exceed environmental regulation costs, enterprises are discouraged from engaging in GTI.
3.3 Analysis of enterprise GTI under strong ERI
Under strong ERI, if the benefits generated from GTI cannot compensate for environmental regulation costs, enterprises will reduce R&D, transfer pollution to other locations, change their investment fields, and adopt other such avoidance strategies. Under these circumstances, government subsidies can only delay enterprises’ transfer of investment but cannot promote GTI.
Based on the above analysis, whether enterprises innovate depends on the comparison between the innovation and environmental regulation costs. The intensity of environmental regulation, from weak to strong, influences the GTI of enterprises differently. Based on this observation, Hypothesis 1 is presented as follows:
Hypothesis 1. There is a threshold effect of environmental taxes on GTI.Simultaneously, government subsidies change the original cost-comparison relationship, and produce different policy effects under different levels of environmental regulation. Based on this observation, Hypothesis 2 is presented as follows:
Hypothesis 2. Government subsidies have a moderating effect on the threshold value of the impact of environmental taxes on GTI.
4 Measurement and analysis of China’s GTIE
4.1 Evaluation method and indicator system of GTIE
4.1.1 Super-efficiency SBM model
Data Envelopment analysis (DEA) is a new system analysis method developed based on the concept of “relative efficiency evaluation” which was first proposed by operational researchers Charnes and Cooper. The DEA method refers to a production process that is carried out “through a series of decisions,” that will “input a certain number of production factors, and output a certain number of products” as decision making unit (DMU). The DEA efficiency evaluation model projects the input and output of all decision units (DMU) into the geometric space, and is used to measure the relative efficiency of decision units in the system containing “multi-input, multi-output.” DEA can process not only scale data but also sequence-scale data. In the case of unknown functional relationships between input and output, DEA can process multi-input and multi-output parameter estimation; therefore, it has strong practicability. Common DEA models can be divided into radial and non-radial models. The SBM (Slacks-based measure) model specifically is a non-radial model that considers “slack” variables. In order to more accurately compare decision units with an efficiency value of 1, (Tone, 2002), proposed the super-efficiency SBM model. Based on the traditional DEA model, this study selected the super-efficiency SBM model, which considers unexpected outputs and “slack” variables to measure the efficiency of GTI.
The super-efficiency SBM model formula is shown as follows:
where y and x are the output and input variables, respectively; s and m are the number of output and input indicators, respectively;
4.1.2 Construction of indicator system
Based on the input and output indicators of GTIE utilized both at home and abroad and in light of data availability considerations, this study measures GTIE based on the indicators shown in Table 1. While labor capital, and energy consumption are all commonly used input indicators, this study uses R&D personnel and expenditure as input indicators of labor and capital, respectively. In terms of R&D expenditure, this study uses the perpetual inventory method to deflate R&D expenditure through the R&D price index, using the year 2000 as a base period and with a depreciation rate of 15%. As GTI is mainly used to reduce energy consumption, this study takes total energy consumption as the input indicator of energy consumption. In the selection of output indicators, desirable and undesirable outputs were chosen that could be divided into innovation and economic outputs. Innovation output is generally measured by the number of patents granted or patent applications. In this study, many patent applications were adopted to measure innovation output because of the non-technical factors that also affect patent authorization. This study measures the economic output of GTI based on the sales revenue of new products and considers industrial wastewater discharge and industrial waste gas emissions as undesirable outputs of GTI for the scientific measurement of GTIE.
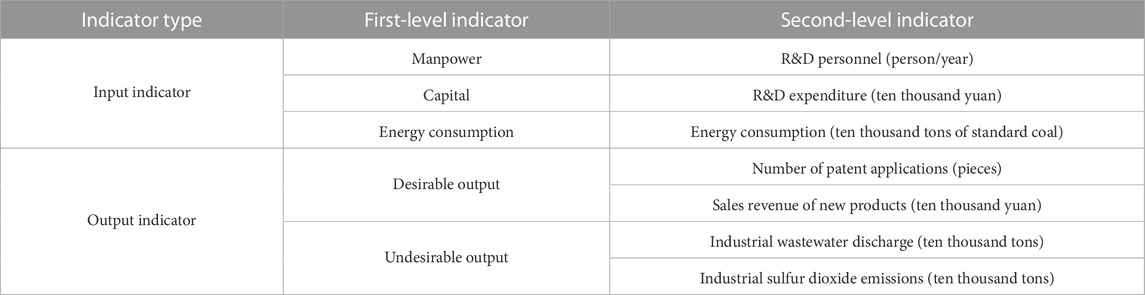
TABLE 1. Input and output indicators of GTIE.
The data are derived from the China Energy Statistical Yearbook, China Statistical Yearbook on Science and Technology, China Statistical Yearbook on Environment, China Statistical Yearbook and Environmental Bulletin in the past. Due to the lack of data in Tibet, to measure GTIE, this paper selects panel data from 30 provinces and cities (except Tibet) from 2009 to 2019.
4.2 Analysis of GTIE
The average GTIE values in the 30 Chinese provinces and cities selected, excluding Tibet due to a lack of available data, from 2009 to 2019 were calculated based on the super-efficiency SBM model, as shown in Table 2. An average GTIE value greater than 1 is a valid unit, whereas an average GTIE value less than 1 is an invalid unit. Only five municipalities and provinces, Beijing, Shanghai, Zhejiang, Guangdong, and Anhui were found to have an average GTIE value greater than 1. Each of the other provinces selected had an average GTIE value of less than 1, indicating that much effort needs to be made to improve China’s overall level of GTI.
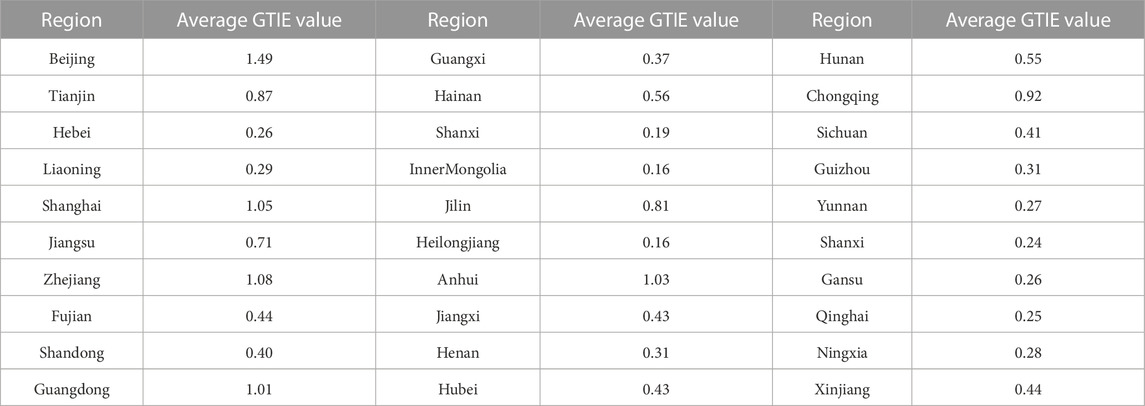
TABLE 2. Average GTIE value in 30 provinces and cities except Tibet from 2009 to 2019.
Figure 1 shows the changes in the average GTIE values in the 30 Chinese provinces and cities selected, excluding Tibet, from 2009 to 2019. According to the regional distribution, the average GTIE value of the eastern regions was significantly higher than that of the central and western regions, but the gap between the different regions is gradually narrowing. The average GTIE value of the eastern regions has remained stable with a slight decrease, which may be related to the many undesirable outputs produced by the rapid economic development in the eastern regions.
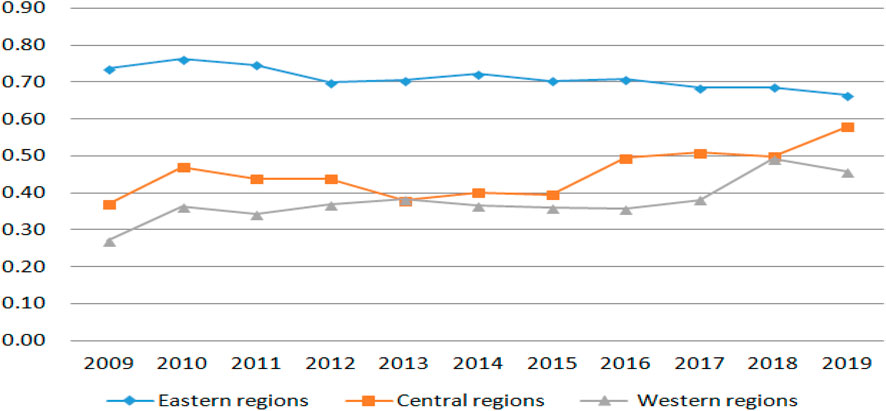
FIGURE 1. Changes in the average GTIE value by region from 2009 to 2019.
5 Empirical analysis based on threshold effect
As detailed above, GTI has a typical “dual externality,” and environmental taxes and government subsidies are an important means of encouraging enterprises to conduct GTI. In this context, the following questions are proposed: Can Chinese environmental taxes encourage GTI? Is this value within the appropriate ERI range? Under the current environmental tax system, do Chinese government subsidies moderate the impact of environmental taxes on enterprise GTI? In the following section, an empirical analysis is provided of the impact of environmental taxes and government subsidies on GTIE with the aim of providing policy recommendations for the formulation and modification of environmental taxes and government subsidies.
5.1 Setting of measurement model
Researchers employ different empirical methods to study the relationship between environmental taxes and GTI. Based on the theoretical analysis of other researchers, this study uses a panel threshold model to test the non-linear threshold effect of environmental taxes on GTI. In addition, this study introduces the interaction term between government subsidies and environmental taxes in the panel threshold model to test whether government subsidies moderate the impact of environmental taxes on GTI.
5.1.1 Panel threshold model
where i and t represent the province and time, respectively.
5.1.2 Panel threshold model settings under moderating effects
where
5.2 Variables and data sources
This study uses panel data from 30 provinces and cities (excluding Tibet) from 2009 to 2019 for the empirical analysis. The data were derived from the China Statistical Yearbook, China Statistical Yearbook on Environment, China Statistical Yearbook on Science and Technology over the past few years, and the Economy Prediction System. Datat-1 made up for the lost data.
5.2.1 Explained variable
GTI was calculated using the super-efficiency SBM model.
5.2.2 Explanatory variable
Environmental taxes (ETax): This study aimed to test the impact of environmental taxes on GTIE. China officially levied environmental taxes on 1 January 2018. China has now established an environmental tax system based on traditional pollutant discharge fees, with the collection object, collection scope, and calculation method remaining unchanged. In view of the consistency and continuity of the current statistical method, this study uses data on pollutant discharge fees from 2009 to 2017, and on environmental taxes from 2018 to 2019.
5.2.3 Moderating variable
Government subsidies (Gov): (Li, 2021): and (Cao, 2021) used the ratio of government funds to regional gross domestic products to represent government subsidies. Based on the work of (Liu and Zeng, 2019), this study measures government subsidies using the proportion of government expenditure in the R&D expenditure of major industrial enterprises in a given region.
5.2.4 Control variables
1) Regional Economic Development Level (GDP): This measurement is based on regional gross domestic product. The higher the economic development level of a region, the more conducive it is to promoting enterprises’ GTI. The logarithmic value of GDP was used to ensure data stability. 2) Financial Interrelations Ratio (Fin): This is measured by the ratio of deposits at regional financial institutions to regional GDP. The better the financial credit environment of a region, the more conducive it is to promoting enterprises’ GTI. 3) Environmental Protection Expenditure (EPE): This includes expenditure on environmental protection management affairs and expenditure on pollution control. It is measured as the proportion of environmental protection expenditure to fiscal expenditure. The greater a region’s environmental protection expenditure, the better the environment for GTI. 4) Industrial Structure Supererogation (Stru): This is measured by the weighted average of the primary, secondary, and tertiary industries as the proxy variable based on the study by Li (2021). The more advanced a region’s industrial structure, the higher the technological content of that structure and the more conducive it is to producing GTI. 5) R&D Personnel (RD): This indicator is measured by the number of R&D personnel in a region’s employed population. The logarithmic value of RD was used to ensure data stability. 6) Enterprise Size (Size): Measured as the ratio of the main business income of major enterprises to the number of major enterprises in a region. The larger the enterprise, the higher the R&D intensity in green technology, and the more conducive it is to GTI. The logarithmic value of size is used to ensure data stability.
5.3 Test and analysis of threshold effect and the moderating effect
5.3.1 Descriptive statistics of the variables
Descriptive statistics of the variables from 2009 to 2019 are shown in Table 3:
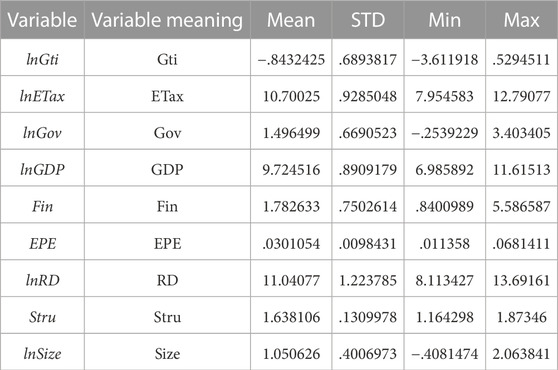
TABLE 3. Descriptive statistics of the variables.
5.3.2 Stationary test
In the empirical test, the stationarity of the data significantly impacted the credibility of the empirical results. Before the empirical analysis, the stationarity of the key variables of GTI efficiency and environmental protection taxes were first tested. Augmented Dickey–Fuller (ADF), Levin, Lin, and Chu (LLC), and Breitung tests were used, respectively. The test results are presented in Table 4, all of which passed the unit root test, indicating that there is no pseudo-regression problem in our subsequent empirical results.
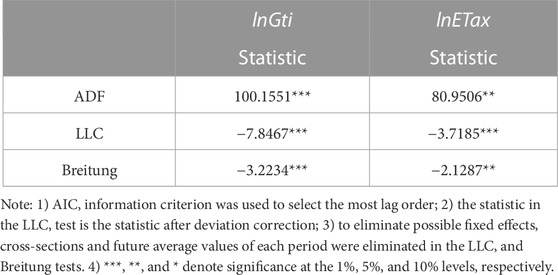
TABLE 4. Stability test of key variables.
5.3.3 Analysis of the threshold effect of environmental taxes, government subsidies and their combined influence on GTIE
5.3.3.1 Analysis of the threshold effect test
With the aim of testing the impact of environmental taxes on GTI, this study considers environmental taxes as the threshold variable and GTIEt+1 as the explanatory variable. This decision was taken in light of the fact that it takes a period of time for environmental taxes to have an impact on GTI. The significance of the threshold was tested using the bootstrap method. Table 5 shows that the impact of environmental taxes on GTI passed the single-threshold test at the 5% level. The threshold value of environmental taxes is 8.9177, and the confidence interval is (8.8741, 8.9971).

TABLE 5. Threshold existence test.
5.3.3.2 Threshold value and parameter estimation results for the impact of environmental taxes on GTIE
This study uses the logarithmic value of environmental taxes (ln ETax) as the threshold variable and the logarithmic value of GTIEt+1 as the explained variable to test the threshold effect of environmental taxes on GTIE using the single threshold method. Table 6 shows the results of the single-threshold estimates and the test results of the threshold effect, while Figure 2 shows the Likelihood Ratio (LR) statistics diagram of the single-threshold test. The LR diagram shows the confidence intervals of the threshold values. In this diagram, the red dashed line is the 5% critical value, the blue line is the likelihood ratio estimator, and the intersection of the blue line and the horizontal axis is the point estimate of the threshold value, which is in line with the results of the threshold estimate.
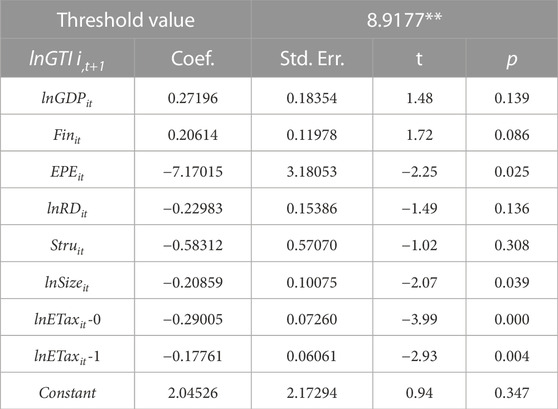
TABLE 6. Threshold estimate and threshold effect test results of environmental taxes.
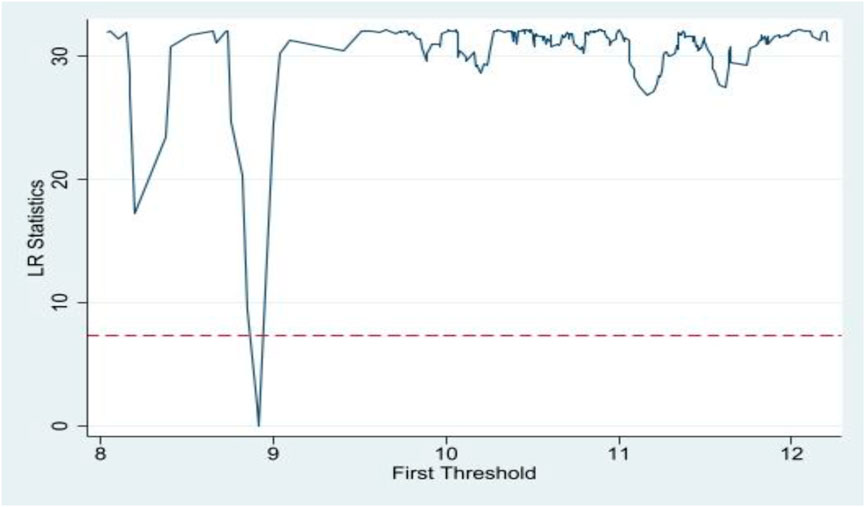
FIGURE 2. LR statistics diagram of the single threshold test.
As lnETax is obtained after logarithmization, the result of the threshold interval is the interval value of lnETax. According to Table 6, the impact interval of environmental taxes on GTIE is divided into two parts: lnETax ≤ 8.9177 (first interval), where the impact coefficient of environmental taxes on GTI is −0.29005; lnETax > 8.9177 (second interval), where the impact coefficient of environmental taxes on GTI is −0.17761. The empirical analysis shows that the impact of environmental taxes on GTI is generally negative. However, the impact of environmental taxes on GTI is weakened with an increase in environmental taxes; that is, environmental taxes help promote greater GTI with an increase in environmental taxes.
5.3.3.3 The moderating effect of government subsidies on the threshold value
In this study, the moderating effect of government subsidies on the threshold value is tested based on the interaction term between government subsidies and environmental taxes. Table 7 presents the test results for the threshold effect and threshold estimate. This study uses lnETax as the threshold variable for single-threshold analysis because it aims to test the moderating effect of government subsidies on the threshold value under different environmental taxes. The impact interval of government subsidies on the threshold value was divided into two parts: lnETax ≤ 8.9177 (first interval) and lnETax > 8.9177 (second interval). According to the results of the analysis, the threshold effect of the interaction term between environmental taxes and government subsidies passes the 5% significance test, which also verifies Hypothesis 2: Government subsidies have a moderating effect on the threshold value of the impact of environmental taxes on GTI.

TABLE 7. Threshold effect test and threshold estimate of the combination of environmental taxes and government subsidies.
Table 8 presents the results of the threshold effect test for the combination of environmental taxes and government subsidies. The results show that in lnETaxit ≤ 8.9177 (first interval), the impact coefficient of lnETaxit* lnGovit on GTIE is −0.21848 and passes the 1% significance test; in lnETaxit > 8.9177 (second interval), the impact coefficient of lnETaxit* lnGovit on GTIE is −0.15847 and passes the 1% significance test. In comparison to the above impact coefficients, which do not consider the moderating effect of government subsidies, the impact coefficient of lnETaxit* lnGovit on GTIE decreases from −0.29005 to −0.21848 in lnETaxit ≤ 8.9177 (first interval) and from −0.17761 to −0.15847 in ln ETaxit > 8.9177 (second interval).
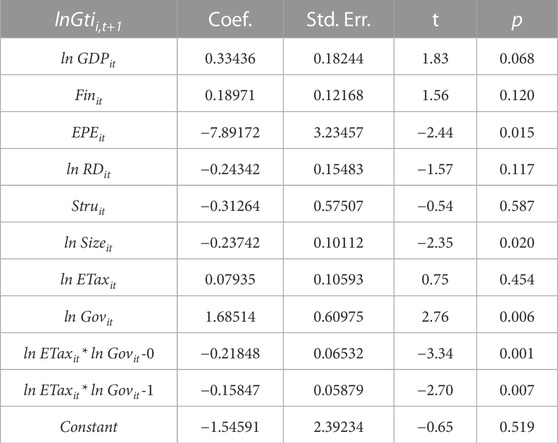
TABLE 8. Threshold test results of the combination of environmental taxes and government subsidies.
5.3.4 Robustness test
5.3.4.1 Changing the GTIE time node
To control for the time effect of environmental taxes on GTIE, this study tests the impact of environmental taxes on GTIE based on explained variablest-2 and explained variablest-3. Table 9 shows that the threshold effect of explained variablest-2 and explained variablest-3 is in line with the conclusions drawn from the original test and passes the significance test, which proves the robustness of the test results from the original model.
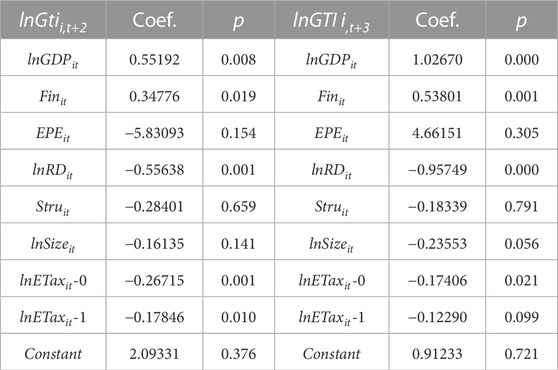
TABLE 9. Robustness test of changing the time node of GTIE.
5.3.4.2 Adding control variables
Different researchers have selected a variety of different control variables in their model designs due to a number of different considerations. Environmental Pollution Investment (EPI) and Ratio of sci-tech Investment (RI) are two control variables often utilized in prior studies. EPI reflects the degree of environmental protection investment in a region. The higher the EPI, the more conducive it is to enterprise GTI. The RI reflects the degree of investment in science and technology in a region. The higher the RI, the higher the degree of enterprise enthusiasm for GTI. To verify the robustness of the model, we included additional control variables. Table 10 shows that the conclusions are in line with those of previous models, proving the robustness of the model and conclusions.

TABLE 10. Robustness test after adding the control variable.
6 Conclusion and policy recommendations
6.1 Conclusion and discussion
Based on existing research, this study builds an environmental tax and government subsidy influencing mechanism to assess the corresponding impact of these policy instruments on GTI, and analyzes the threshold and regulatory effects using panel data from 30 Chinese provinces and cities from the years 2009–2019. Based on the empirical analysis, the following conclusions were drawn.
First, in this study, the super-efficient SBM model was used to assess the substantive progress of GTI in China. The research conclusions drawn are broad and accurate indicating that the overall GTIE level in China is low. In terms of the regional GTIE levels, there are large differences among the eastern, central, and western regions, but the gap is narrowing. According to the measurement results for China’s GTIE, only five regions had an average GTIE value greater than 1 over the observation period, and the overall GTIE level documented was low. The GTIE value of the eastern region was significantly higher than that of the central and western regions, but the gap between the different regions is gradually narrowing. This finding are is consistent with the conclusions reported by Cao (2021). Therefore, considerable efforts must be made to improve China’s GTIE, and the Chinese government should formulate specific policies to achieve this goal.
The second consideration of this study is with regard to the correct level of environmental taxation. The effect of environmental taxes on GTI in this study was moderate. According to some researchers, a non-linear relationship exists between environmental legislation and the development of green technologies, one that resembles a “U” or an inverted “U” shape (Wang-Helmreich and Kreibich, 2019; Fan et al., 2021). The results of the empirical analysis performed for this study indicate a non-linear relationship exists between environmental taxation and the development of green technologies. In contrast to the results of earlier studies performed in this area, this study maintains that while environmental taxes already have a threshold influence on the development of green technologies, they have not yet crossed the inflection point or reached the range needed to boost the effectiveness of such innovations.
This study’s results demonstrates that existing environmental taxes have a detrimental effect on the invention of green technologies. After evaluating the income and cost of innovation, businesses lack the desire to innovate because their overall environmental tax burden is low (Acemoglu et al., 2012; Li, 2021). This study’s findings also indicate that the formation of an independent environmental tax system and modification of the pollutant discharge fee has reduced the impact of environmental taxes on GTI and increased the regulation intensity of environmental taxes on businesses. When lnETaxit > 8.9177, the influence coefficient decreases from −0.29005 to −0.17761. This is related to the variables selected for the environmental tax in this study. Previous studies mostly considered a broad environmental tax as the key measurement index with a wider statistical scope. By contrast, the variables selected in this study are more targeted. As for the environmental tax introduced in China in 2018, its encouraging effect on GTI has not yet been realized.
The third key aspect of this study concerns the impact of government subsidies and environmental taxes on the effectiveness of GTI. Previous literature has concentrated on the influence of environmental taxes and government subsidies on GTI, and it was thought that these two factors could be successfully combined to advance this field. According to this line of reasoning, different tax burden levels result in varied outcomes when government subsidies are implemented. As a result, it is important to distinguish between the role that government subsidies play under various tax schemes rather than analyzing the overall effects of environmental tax and government subsidies.
According to the analysis provided in this study, government subsidies only have a regulatory impact on the threshold value, reducing the negative effects of environmental taxes on GTI, because the current environmental tax burden is not in the right range to encourage their development. When lnETaxit ≤ 8.9177 (the first interval), the influence coefficient of the intersection of environmental tax and government subsidies on the efficiency of GTI decreases from −0.29005 to −0.21848, and when lnETaxit > 8.9177 (the second interval), the influence coefficient of the intersection of environmental tax and government subsidy on GTI efficiency decreases from −0.17761 to −0.15847. This finding was consistent with the theoretical hypotheses cited above. Although the application of government subsidies under lax environmental regulations can reduce the adverse effects of environmental taxation on the development of green technologies, the combination of these two policies does not contribute to the promotion of GTI under the current level of environmental taxation.
6.2 Research significance and policy suggestions
6.2.1 Implications of the research
In accordance with the 2030 Agenda for Sustainable Development, every country should use various policy instruments to promote sustainable energy development. The development, popularization, and use of green technology can improve energy use efficiency and reduce pollution emissions. Therefore, GTI is an important driving force for green development, and an important supporting mechanism for China’s “dual carbon” goals. Governments should promote the development of green energy technology, and environmental regulation and government subsidies are important means for the government to promote GTI. Therefore, research on the impact of environmental tax and government subsidies on GTIE will be conducive to policy adjustment and improvement. The conclusion of this paper indicates that there is still a great room for improvement in GTIE, the government should apply all policies comprehensively to improve GTIE. Although in China, the implementation of environmental tax and government subsidies had some effect on promoting GTIE, it is not in a moderate space. The tax rate and range of environmental tax can be moderately increased, and the implementation of government subsidies should strengthen supervision.
6.2.2 Policy suggestions
Based on the results of this empirical analysis, this study proposes the following policy recommendations.
First, multiple measures should be adopted to formulate differentiated policies that can effectively improve GTIE. GTI presents a typical “dual externality,” but neither environmental levies nor government subsidies have had a matching impact on its promotion. Therefore, much work remains before all provinces and cities in China can increase their GTIE to an appropriate level. It is vital to develop administrative environmental regulations and policies to enhance the cost of violation and promote enterprise technological innovation because the existing market-oriented environmental regulation driven by environmental taxes can only boost GTIE to a certain limited level. The advantages in terms of resources and talent available to enterprises in China’s eastern region should be fully utilized, and the central and western regions should be encouraged to work together to improve the overall level of GTIE there. Significant attention should also be paid to regional differences in policies and coordinated policy promotion should be sought between regions.
Second, the environmental tax rate and collection scope should be gradually increased and a comprehensive environmental tax system should be designed in a top-down manner. Presently, the impact of environmental taxes on China’s GTI is still within a weak ERI range. Although the ERI is growing because of the conversion of pollutant discharge fees to environmental taxes, not all aspects of environmental and enterprise policy have benefited.
Owing to its narrow tax scope and low tax rate, the current environmental tax has not contributed to the promotion of GTI. Businesses are more willing to avoid paying taxes and fees because of weakening environmental controls and the uncertainty of technological progress. Along with the systematic re-design of the environmental tax system cited in the previous paragraph and a gradual increasing of the tax rate, China’s environmental tax scope should also be gradually expanded from pollution emissions only to include pollution products, ecological protection, and carbon emissions.
During this process, we should pay specific attention to the following issues. First, all of the changes suggested should be implemented in a systematic process. The only option for improving environmental taxes in the future is to broaden the environmental taxation purview and increase tax rates. It is important to note that this procedure should not be rushed; it should be performed gradually in accordance with the severity and urgency of the various pollutants being addressed. The tax rate should also be gradually increased, and the differentiated tax rate should be adjusted depending on both the type of pollutant and the level of regional pollution. Second, environmental tax collection-related support measures should be enhanced. The successful execution of environmental tax system standards, raising of the tax rate and enlargement of the tax remit depends heavily on the effectiveness of the tax collection and administration system. There are currently issues with China’s monitoring methods and mechanisms for collecting emissions data, while there is currently no information sharing for environmental taxes, which makes it more difficult to enforce joint collection of environmental taxes. The urgent task for improving thegthening the related support measu efficiency of environmental taxation in China can only be achieved by strenres.
Third, supervision, screening, and feedback mechanisms should be strengthened, and government subsidies should be applied. The findings of this study clearly demonstrate that the existing environmental tax burden is not within an acceptable range for supporting green technology development. Government subsidies only partially mitigate the damaging effects of the environmental tax burden on the development of green technology at the current level of taxation. The practical application of government R&D subsidies to aid businesses’ technical innovation is what causes this moderating effect. Businesses are unmotivated to implement GTI, given the current environmental tax burden. Only by strengthening the supervision, screening, and feedback mechanisms of government subsidies and vigorously supporting and rewarding enterprises that actually produce technological achievements can the prevalence of enterprises’ rent-seeking behavior be reduced. Thus, the regulatory role of government subsidies in positive induction must be fully understood.
7 Deficiencies and future research prospects
7.1 Limitations of this study
First, the data utilized for this study are insufficiently malleable. Owing to limitations in the availability of individual data indicators, the data selected for this study only covered the period from 2009 to 2019. As China officially levied an environmental tax in 2018, the time covered in relation to the recently introduced pollutant discharge fee is insufficient. Coupled with the run-in problem in the early stages of the environmental tax levy, independent legislation on environmental taxation may be weakened. Second, this study is insufficiently comprehensive in terms of its scope. The impact of environmental regulation on GTI is not limited to environmental taxes, carbon taxes, and other environmental regulations. This study considers environmental tax as the main variable to be considered in relation to GTI. While environmental tax is undoubtedly valuable in terms of policy research, it is also insufficient by itself to offer a fully comprehensive perspective of the current state of this research.
7.2 Research goals and expectations
With continuous improvements in the implementation of environmental taxes, the availability of index data has been enhanced, and the data span of this study has in turn been extended. In terms of model selection, a difference-in-differences model can be used to compare and analyze the impact of environmental taxes on the efficiency of GTI before and after implementation. In addition, the effects of carbon taxes and other environmental regulation methods can also be quantified in future research.
Data availability statement
The original contributions presented in the study are included in the article/Supplementary Material, further inquiries can be directed to the corresponding author.
Author contributions
LL: Conceptualization, Writing—original draft, Methodology; Writing—review and editing; MR: Software and Visualization.
Funding
This study is the interim achievement of the major project of Fujian Provincial Social Science Base, project number FJ2022JDZ064.
Conflict of interest
The authors declare that the research was conducted in the absence of any commercial or financial relationships that could be construed as a potential conflict of interest.
Publisher’s note
All claims expressed in this article are solely those of the authors and do not necessarily represent those of their affiliated organizations, or those of the publisher, the editors and the reviewers. Any product that may be evaluated in this article, or claim that may be made by its manufacturer, is not guaranteed or endorsed by the publisher.
References
Acemoglu, D., Aghion, P., Bursztyn, L., and Hemous, D. (2012). The environment and directed technical change. Am. Econ. Rev. 102, 131–166. doi:10.1257/aer.102.1.131
Aronsson, T. (2005). Environmental policy, efficient taxation and unemployment. Int. Tax Public Finance 12, 131–144. doi:10.1007/s10797-005-0498-4
Boeing, P. (2016). The allocation and effectiveness of China’s R&D subsidies-evidence from listed firms. Res. Policy 45, 1774–1789. doi:10.1016/j.respol.2016.05.007
Cai, X., Zhu, B. Z., Zhang, H. J., Li, L., and Xie, M. (2020). Can direct environmental regulation promote green technology innovation in heavily polluting industries? Evidence from Chinese listed companies. Sci. Total Environ. 746, 140810–141158. doi:10.1016/j.scitotenv.2020.140810
Cao, J. Y. (2021). Research on the impact of environmental regulation and government R&D subsidies on the efficiency of green innovation. China: Hebei Normal University.
Coh, B-Y. (2010). Measuring Industry Greening Indices for Korean high priority green technologies by technology-industry concordance analysis. J. Technol. Innovation 18, 121–146.
Dai, Z. W., and Pan, S. J. (2018). Accounting S O. Will the "virus" of zombie firms be contagious? Evidence based on the transparency of financial information. J. Finance Econ. 12, 138–150.
Eunmi, L., Park, Y. R., and Yu-Ya, W. (2020). A study on the effect of China’s sub-regional difference on the relationship between Chinese firm’s internal and external. Factors Green Technol. Innovation 24, 95–108.
Fan, F., Lian, H., Liu, X., and Wang, X. (2021). Can environmental regulation promote urban green innovation efficiency? An empirical study based on Chinese cities. J. Clean. Prod. 287, 125060–125139. doi:10.1016/j.jclepro.2020.125060
Fried, H. O., Lovell, C. A. K., Schmidt, S. S., and Yaisawarng, S. (2002). Accounting for environmental effects and statistical noise in data envelopment analysis. J. Prod. Analysis 17, 157–174. doi:10.1023/a:1013548723393
Ganda, F., and Garidzirai, R. (2021). The environmental influence of tax regimes in selected European union economies. Green Comput. Technol. Comput. industry 2020. doi:10.5772/intechopen.94552
Han, R. M., Liu, Y. C., and School, B. (2017). Research on technological innovation efficiency evaluation of industrial enterprises. Technoeconomics Manag. Res. 05, 53–57.
Harc, M., and Alic, M. B. (2018). “The role of eco-innovation and transition towards a green Economy in Croatia.”in proceedings of the 7th International Scientific Symposium on Economy of Eastern Croatia - Vision and Growth. May 24-26 2018: Osijek, CROATIA.
Huang, S., Lin, H., Zhou, Y., Ji, H., and Zhu, N. (2022). The influence of the policy of replacing environmental protection fees with taxes on enterprise green innovation-evidence from China's heavily polluting industries. Sustainability 14, 6850. doi:10.3390/su14116850
Jaffe, A. B., Newell, R. G., and Stavins, R. N. (2005). A tale of two market failures: Technology and environmental policy. Ecol. Econ. 54, 164–174. doi:10.1016/j.ecolecon.2004.12.027
Kang, S., and Jin, E. S. (2002). Environmental regulation and technological constraint. Environ. Resour. Econ. Rev. 11, 345–375.
Kolsuz, G., and Yeldan, A. E. (2017). Economics of climate change and green employment: A general equilibrium investigation for Turkey. Renew. Sustain. Energy Rev. 70, 1240–1250. doi:10.1016/j.rser.2016.12.025
Li, X. A. (2021). Environmental regulation, government subsidies and regional green technology innovation-- Based on the empirical research of provincial space panel. Econ. Surv. 04, 1–14.
Li, X. J., and He, N. (2018). Regional competition environmental tax and enterprise green technology innovation. China Popul. Resour. Environ. 9, 73–81.
Liu, H. Y., and Guo, W. Q. (2021). Induction effect of carbon tax and research subsidy policy mix to clean-technological innovations. Sci. Technol. Manag. Res. 02, 194–202.
Liu, J. R., and Zeng, X. (2019). Influence of environmental regulation and government innovation subsidy on enterprise green product innovation. Res. Econ. Manag. 06, 106–118.
Minviel, J. J., and Sipilainen, T. (2021). A dynamic stochastic frontier approach with persistent and transient inefficiency and unobserved heterogeneity. Agric. Econ. 52, 575–589. doi:10.1111/agec.12636
Olson, E. L. (2014). Green innovation value chain analysis of PV solar power. J. Clean. Prod. 64, 73–80. doi:10.1016/j.jclepro.2013.07.050
Pezzey, J. C., and Jotzo, F. (2013). Carbon tax needs thresholds to reach its full potential. Nat. Clim. Change 12, 1008–1011. doi:10.1038/nclimate2054
Ren, H. Y., and Nie, J. C. (2018). Firm heterogeneity, government subsidy and R&D investment. Ence Res. Manag. 39, 37–47.
Shao, Y., and Chen, Z. (2022). Can government subsidies promote the green technology innovation transformation? Evidence from Chinese listed companies. Econ. Analysis Policy 74, 716–727. doi:10.1016/j.eap.2022.03.020,PP.
Song, X. N., and Xue, H. F. (2022). Environmental regulation, FDI spill0ver and green technology innovation in manufacturing industry. Statistics Decis. 03, 81–85.
Sun, H., Sun, C., Kporsu, A. K., and Edziah, B. K. (2019). Institutional quality, green innovation and energy efficiency. Energy Policy 135, 111002. doi:10.1016/j.enpol.2019.111002
Tone, K. (2002). A slacks-based measure of super-efficiency in data envelopment analysis. Eur. J. Operational Res. 01, 32–41. doi:10.1016/s0377-2217(01)00324-1
Wang, Y., Sun, X., and Guo, X. (2019). Environmental regulation and green productivity growth: Empirical evidence on the porter hypothesis from OECD industrial sectors. Energy Policy 132, 611–619. doi:10.1016/j.enpol.2019.06.016
Wang, Z. Y., Cao, Y., and Lin, S. L. (2021). The characteristics and heterogeneity of environmental regulation's impact on enterprises' green technology innovation--Based on green patent data of listed firms in China. Stud. Sci. Sci. 09, 909–919+929.
Wang-Helmreich, H., and Kreibich, N. (2019). The potential impacts of a domestic offset component in a carbon tax on mitigation of national emissions. Renew. Sustain. Energy Rev. 101, 453–460. doi:10.1016/j.rser.2018.11.026
WooPyeong, Y., and Kang, S. (2018). Measuring the environmental performance of green companies. J. Environ. Policy Adm. 26, 1–30. doi:10.15301/jepa.2018.26.3.1
Wu, H., and Hu, S. (2020). The impact of synergy effect between government subsidies and slack resources on green technology innovation. J. Clean. Prod. 274, 122682–123142. doi:10.1016/j.jclepro.2020.122682
Xiao, L. M., Gao, J. F., and Liu, S. (2017). The change trend of green technology innovation efficiency in China based on spatial gradient--empirical analysis of provincial panel data. Soft Sci. 31, 63–68.
Xing, H., Wang, F., and Gao, S. Y. (2019). Does government subsidy promote substantive innovation in enterprises: A synergistic perspective of dual attributes of resources and signaling. Mod. Econ. Res. 03, 57–64.
Yang, S., and Zeng, G. (2018). The ecological innovation effect of environmental regulation: From the perspective of regional differences. Ecol. Econ. 09, 41–49.
Zhang, C. S. (2016). On the innovation efficiency of China's high-tech industries: A literature review. Forum Sci. Technol. China 04, 56–62.
Keywords: green technology innovation, government intervention, energy efficiency, threshold effect, environmental tax, government subsidies
Citation: Li L and Rao M (2023) The impact of government intervention on innovation efficiency of green technology—a threshold effect analysis based on environmental taxation and government subsidies. Front. Energy Res. 11:1197158. doi: 10.3389/fenrg.2023.1197158
Received: 30 March 2023; Accepted: 11 July 2023;
Published: 26 July 2023.
Edited by:
Quande Qin, Shenzhen University, ChinaReviewed by:
Liliana Proskuryakova, National Research University Higher School of Economics, RussiaFortune Ganda, Walter Sisulu University, South Africa
Copyright © 2023 Li and Rao. This is an open-access article distributed under the terms of the Creative Commons Attribution License (CC BY). The use, distribution or reproduction in other forums is permitted, provided the original author(s) and the copyright owner(s) are credited and that the original publication in this journal is cited, in accordance with accepted academic practice. No use, distribution or reproduction is permitted which does not comply with these terms.
*Correspondence: Liqin Li, bGlsaXFpbjQ2QDE2My5jb20=