 Daohua Zhang
 Xinxin Jin2
 XinYing Chew
95% of researchers rate our articles as excellent or good
Learn more about the work of our research integrity team to safeguard the quality of each article we publish.
Find out more
ORIGINAL RESEARCH article
Front. Energy Res. , 05 May 2023
Sec. Smart Grids
Volume 11 - 2023 | https://doi.org/10.3389/fenrg.2023.1193662
This article is part of the Research Topic Advances in Artificial Intelligence Application in Data Analysis and Control of Smart Grid View all 20 articles
A smart grid is a new type of power system based on modern information technology, which utilises advanced communication, computing and control technologies and employs advanced sensors, measurement, communication and control devices that can monitor the status and operation of various devices in the power system in real-time and optimise the dispatch of the power system through intelligent algorithms to achieve efficient operation of the power system. However, due to its complexity and uncertainty, how to effectively perform real-time prediction is an important challenge. This paper proposes a smart grid real-time prediction model based on the attention mechanism of convolutional neural network (CNN) combined with bi-directional long and short-term memory BiLSTM.The model has stronger spatiotemporal feature extraction capability, more accurate prediction capability and better adaptability than ARMA and decision trees. The traditional prediction models ARMA and decision tree can often only use simple statistical methods for prediction, which cannot meet the requirements of high accuracy and efficiency of real-time load prediction, so the CNN-BiLSTM model based on Bayesian optimisation has the following advantages and is more suitable for smart grid real-time load prediction compared with ARMA and decision tree. CNN is a hierarchical neural network structure containing several layers such as a convolutional layer, pooling layer and fully connected layer. The convolutional layer is mainly used for extracting features from data such as images, the pooling layer is used for the dimensionality reduction of features, and the fully connected layer is used for classification and recognition. The core of CNN is the convolutional operation, a locally weighted summation operation on the input data that can effectively extract features from the data. In the convolution operation, different features can be extracted by setting different convolution kernels to achieve feature extraction and classification of data. BiLSTM can capture semantic dependencies in both directions. The BiLSTM structure consists of two LSTM layers that process the input sequence in the forward and backward directions to combine the information in both directions to obtain more comprehensive contextual information. BiLSTM can access both the front and back inputs at each time step to obtain more accurate prediction results. It effectively prevents gradient explosion and gradient disappearance while better capturing longer-distance dependencies. The CNN-BiLSTM extracts features of the data and then optimises them by Bayes. By collecting real-time data from the power system, including power, load, weather and other factors, our model uses the features of CNN-BiLSTM to deeply learn real-time load data from smart grids and extract key features to achieve future load prediction. Meanwhile, the Bayesian optimisation algorithm based on the model can optimise the model’s hyperparameters, thus improving the model’s prediction performance. The model can achieve accurate prediction of a real-time power system load, provide an important reference for the dispatch and operation of the power system, and help optimise the operation efficiency and energy utilisation efficiency of the power system.
Smart grid real-time load forecasting refers to machine learning, data mining, statistics, and other methods to forecast the power load in the grid system in real time (Aravind et al., 2019). This can help grid operators to better dispatch power resources and improve the reliability and efficiency of the grid (Luo et al., 2022). The main challenge of real-time electric load forecasting for smart grids is the diversity and complexity of data. The load data in the grid system involves multiple dimensions, such as time, location, and load type, as well as various noises and anomalies. Therefore, suitable data pre-processing and feature extraction methods are needed to improve the accuracy and reliability of the prediction (Liu et al., 2013).Therefore, our research is motivated by the fact that the power system requires more accurate and real-time load forecasting with the development of smart grids. Traditional load forecasting methods often fail to meet these requirements, so a more accurate and real-time load forecasting method needs to be investigated. Deep learning models can handle large amounts of data. They can automatically learn features and patterns from the data, so they are widely used for load forecasting in power systems. The hyperparametric algorithm based on Bayesian optimisation can further improve the prediction performance of deep learning models, so it has been introduced into power system load forecasting. This study aims to explore an efficient and accurate load forecasting method to support smart grids’ reliability, efficiency and security. Smart grid real-time load forecasting can be applied in the power market, power dispatch, and energy trading, and it has a wide range of application prospects (Xiang et al., 2019). Common methods used to predict real-time load in smart grids are traditional time-series modeling, machine learning, and recurrent neural network methods.
Traditional time series modeling method: Traditional time series modeling mainly includes ARMA and ARIMA, which are simple models requiring only endogenous variables without the help of other exogenous variables, but can only capture linear relationships but not non-linear relationships in essence because they need stable time series data or are stable after differencing (He and Ye, 2022). Based on the characteristics of smart grid real-time load, it is difficult for the traditional time series modeling method to make accurate forecasts, and it is difficult to ensure the long time validity of the model in the environment of the constantly changing real-time load of the smart grid because the traditional time series forecasting model is not adjusted once it is trained (Li et al., 2023).
Machine learning method: This model uses machine learning algorithms, such as support vector machine (SVM) (Cabán et al., 2022), Bayesian Optimization (BO) (Wu et al., 2022), logistic regression, etc. Predict changes in financial time series data by processing and testing data sets. The advantage of this model is that it is easy to understand and fast enough to handle the interaction of non-linear features (Estrella et al., 2019). Still, the disadvantage is that the smart grid real-time load is affected by many different factors, so the performance of machine learning methods is not sufficient to meet people’s need (Chen B.-R. et al., 2022).
Recurrent neural network method: This model uses deep learning algorithms such as recurrent gating units (GRU) (Li et al., 2018), deep recurrent neural networks (RNN) (Papadaki et al., 2022), generative adversarial networks (GAN) (Song et al., 2020), etc., to learn from large amounts of data by automatically extracting data. The advantages of this model are powerful learning ability and the more significant the amount of data, the better the performance and portability. However, the disadvantages are high hardware requirements and poor portability, too dependent on data, and not very interpretable.
Based on the advantages and disadvantages of the above models, this paper proposes a prediction model combining an attention-based mechanism of convolutional neural network (CNN) (Niu et al., 2022)and bi-directional-long short-term memory neural network (BiLSTM) (Song et al., 2021). The output results are then passed through the BiLSTM network, which can be more accurate than the LSTM model. Finally, they are subjected to Bayesian optimization to achieve adaptive optimization of smart grid real-time load data by adjusting the parameter values in real time with Bayes. Finally, the CNN-BiLSTM-BO model is composed. The main holdings of this paper include Model design: 1. based on CNN-BiLSTM structure, a deep learning model for power system load forecasting is designed. The model can extract the spatial features of load data using CNN and the time series features of load data using BiLSTM to predict future loads accurately. 2. Hyperparameter optimisation: Bayesian optimisation algorithm is used to optimise the hyperparameters of the model to improve the prediction performance of the model. The Bayesian optimisation algorithm can find the optimal combination of hyperparameters quickly by adaptively adjusting the parameter search space to improve the generalisation ability and stability of the model. 3. Real-time load forecasting: The model is applied to real-time load forecasting, and the forecasting performance of the model is verified by actual data. Real-time load prediction is an important part of smart grid dispatching and operation. Accurately predicting load change trends can improve the efficiency and security of the power systems. The contribution points of this paper are as follows.
• The ability to handle non-linear relationships that cannot be taken by traditional timing modeling and its applicability is broader than that of conventional timing modeling.
• It is more capable of learning and interpretable than machine learning models such as decision trees and support vector machines.
• Compared with deep learning models such as FNN(Zhang et al., 2023), GAN, and GRU models, using BiLSTM models instead of RNN models can process sequence data more efficiently, preserve long-term data more permanently, and add Bayesian optimization models to improve its prediction accuracy further.
The rest of the paper presents recent related work in Section II. Section III offers our proposed methods: overview, convolutional neural network (CNN); bidirectional-long short-term memory neural network (bidirectional-LSTM, BiLSTM); Bayesian optimization; The fourth part presents the experimental part, including practical details and comparative experiments. The fifth part is the summary.ARMA (Chen et al., 2022a) model is an important model for studying time series, which is based on a mixture of autoregressive model (AR) (Xu et al., 2020) and moving average model (MA (Zhang et al., 2019)), and is often used in market research for forecasting market size and long-term tracking studies. It differs the non-stationary data by judging whether the time series data is smooth or not, then judges the model suitable for the time series as well as performs model sizing, and finally performs parameter estimation to generate the model and uses the model for forecasting.
The advantage of ARMA model is that it can be applied to many time series, and it can be used to evaluate the goodness of the model in the diagnosis of the model, which is very useful for forecasting. However, when the ARMA model is used to forecast the data, the prediction error becomes larger and larger with the extension of time compared to the short-term prediction results.
A decision Tree (Ning et al., 2020) is a machine learning model for solving classification and prediction problems and belongs to a supervised learning algorithm. The decision tree starts from the root node, analyzes each feature of the training data, selects an optimal solution, and then splits the training data set into subsets so that the training data set has the best classification under the current conditions and if it does, then constructs leaf nodes, and if it is still not well classified, then continues to split it, and so on recursively until all training data sets are correctly classified, or there are no convenient features. After the above operation, the decision tree may have a good classification ability for the training dataset. Still, it may not have the same effect on the unknown dataset. To avoid the overfitting phenomenon, the generated tree needs to be pruned to simplify the tree and achieve better generalization ability.
Decision tree models are risk-based decision-making methods, so in the context that decision trees are nowadays more mature, they are also used in various fields such as artificial intelligence, medical diagnosis, planning theory, cognitive science, engineering, data mining, etc.
GRU (Gate Recurrent Unit) is a Recurrent Neural Network (RNN) type. Like LSTM (Long-Short Term Memory), GRU is a variant of LSTM, which has a more straightforward network structure than LSTM and is more effective than LSTM. In LSTM, three gate functions are introduced: input gate, fo, getting gate, and output gate. The GRU model has one less “gate” than the LSTM, but the functions are comparable and more practical.
GRU is widely used in speech processing, natural language processing, and other fields such as language modeling, machine translation, and text generation because they are suitable for processing sequential data (Ning et al., 2023).
The CNN-BiLSTM model based on Bayesian optimization is proposed in this paper to predict smart grid real-time load data, which can effectively prevent the problems of gradient explosion and gradient disappearance. The model combines the advantages of convolutional neural network (CNN) and bi-directional long and short-term memory network (BiLSTM) and uses a Bayesian optimisation algorithm to automatically tune the hyperparameters to improve the prediction performance of the model. We will briefly describe each model and its relationship; CNN: CNN is a deep learning model commonly used in image processing and computer vision. It can extract different levels of feature representations from the original image through multi-layer convolution and pooling operations, thus enabling task the classification and recognition of images. In the CNN-BiLSTM model based on Bayesian optimisation, CNN is mainly used to extract the spatiotemporal features of the load data. BiLSTM: BiLSTM is a deep learning model commonly used in sequence modelling and natural language processing. It can capture long-term dependencies in time-series data and achieve accurate prediction of future data by combining forward and reverse LSTM units. In the CNN-BiLSTM model based on Bayesian optimisation, the BiLSTM is mainly used to model spatiotemporal features and achieve prediction of real-time load. Bayesian optimization: Bayesian optimization is an optimisation algorithm which describes the uncertainty of the objective function by building a Gaussian process model and updating the hyperparameters of the model according to Bayes’ theorem to achieve the optimisation of the objective function. In the CNN-BiLSTM model based on Bayesian optimisation, the Bayesian optimisation algorithm is mainly used to adjust the model’s hyperparameters, including the learning rate and batch size, improving the prediction performance and generalisation ability of the model. Interaction relationship of the three: the CNN-BiLSTM model based on Bayesian optimisation achieves efficient and accurate modelling for real-time load forecasting of the smart grids by combining the advantages of CNN and BiLSTM and using Bayesian optimisation algorithm to tune the hyperparameters automatically. CNN is mainly used to extract the spatiotemporal features of load data. Bilstm is mainly used. The CNN is mainly used to extract the spatiotemporal features of load data, the BiLSTM is mainly used to model the spatiotemporal features and realise the prediction of future load, and the Bayesian optimisation algorithm is used to automatically adjust the hyperparameters of the model to improve the accuracy and practicality of the prediction model. The flow chart of the model is shown in Figure 1. First, the smart grid real-time load data is input, and the data is preprocessed and normalized in the data input layer. Then the dataset is put into the CNN unit for feature extraction. To better extract the dataset’s features, the convolutional layer with a one-dimensional structure is chosen here to reduce the dataset’s dimensionality. The feature sequence is finally output after pooling, sampling, merging, and reorganizing by the fully connected layer. After that, the feature data are entered into the BiLSTM layer for smart grid real-time load data feature learning, and then Bayesian optimization is performed to obtain the optimal parameters of the model, improve the accuracy of prediction, optimize the CNN-BiLSTM structure, and finally output the prediction results.
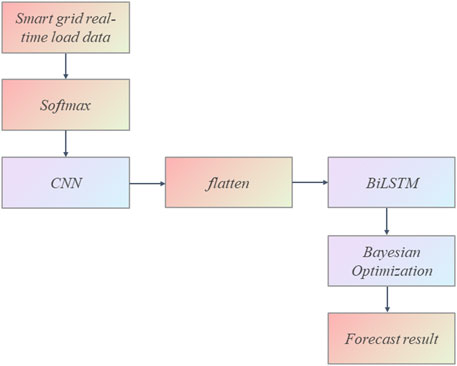
FIGURE 1. Schematic diagram of real-time charge model of smart grid based on CNN-BiLSTM under Bayesian optimization.
The CNN-BiLSTM-BO model includes three parts: CNN module, BiLSTM module, and Bayesian optimization. The three parts complete the prediction of smart grid real-time load data through their advantages, and the model’s overall structure is shown in Figure 2.
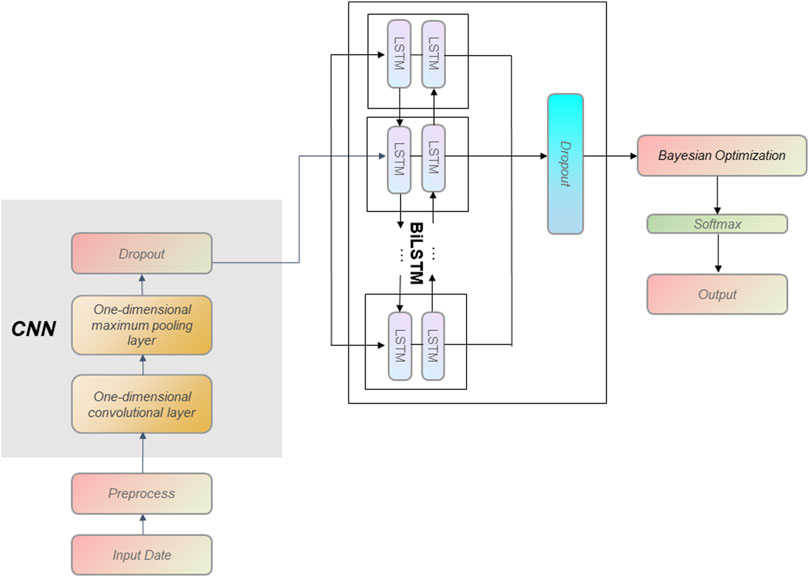
FIGURE 2. The overall detailed flow chart of the smart grid real-time charge model based on CNN-BiLSTM under Bayesian optimization.
Convolutional Neural Network (CNN) is a deep feed-forward neural network with local connectivity and weight sharing. As one of the deep learning algorithms, it can capture the local features and spatial structure of images, so CNN is widely used in image classification, target detection, etc. It is one of the most commonly used models at present (Zhibin et al., 2019). The primary role of the convolution layer is feature extraction. The convolution layer convolves the input image with convolution kernels, and multiple convolution kernels can be convolved separately to extract more features. The feature map obtained by convolution is then pooled in the pooling layer, which can significantly reduce the amount of data to discard useless information and consolidate operations without reducing the most significant features. The CNN can be divided into one-dimensional CNN(Cai et al., 2021) and multidimensional CNN according to the dimensionality. One-dimensional CNN has a more vital feature extraction ability in time series data processing, so this paper uses one-dimensional CNN to process smart grid real-time load data. Its model structure diagram is shown in Figure 3.
Considering the complexity of financial time-series data, we introduce a one-dimensional CNN based on its more robust feature extraction capability so that it can improve the performance of the overall prediction model. The structure of the one-dimensional CNN is shown in Figure 3, where the data are put into the convolution layer, where the convolution kernel ϕ acts on the input data Xa ∈ Yl×fat the ath time step to extract the feature matrix
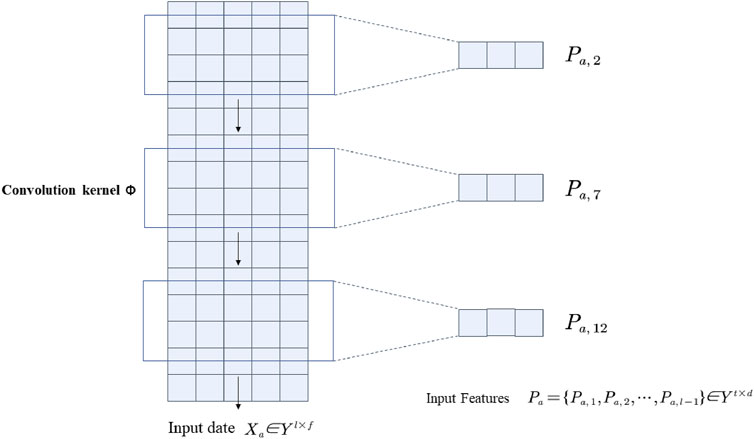
FIGURE 3. Operation process of one-dimensional CNN model in real-time load forecasting of smart grid.
Assuming that the input
In Eq. 1, the symbol ⋆ is the mutual correlation operation, B is the size of a training data set, lin and lout are the numbers of channels of input data and output data, respectively, fin and fout are the lengths of input data and output data, and N represents the size of the convolution kernel thought.
The LSTM only inputs information from the forward sequence into the neural network prediction results, and it is difficult to perceive the backward data content when training the model, so it is prone to problems such as gradient inflation or gradient disappearance when dealing with connections between more distant node links, while the BiLSTM can better retain the information provided by more distant nodes. The BiLSTM layer is a combination of forward LSTM and backward LSTM. The BiLSTM model uses sequential and inverse order calculations for each sentence to obtain two sets of hidden layer representations. Then the final confidential layer representation is obtained by vector stitching, which improves the performance on more comprehensive time-series data. In the BiLSTM structure, each LSTM cell has three gating structures, forgetting gate, input gate, and output gate, as shown in Figure 4.
Compared with LSTM, which can only input the information of forward sequence into the neural network for prediction, BiLSTM contains a forward LSTM unit and a backward LSTM unit; each LSTM unit is consistent with the structure of LSTM, and the forward and backward units are independent of each other, and according to the existing studies, BiLSTM is better than LSTM in the prediction of time series data.
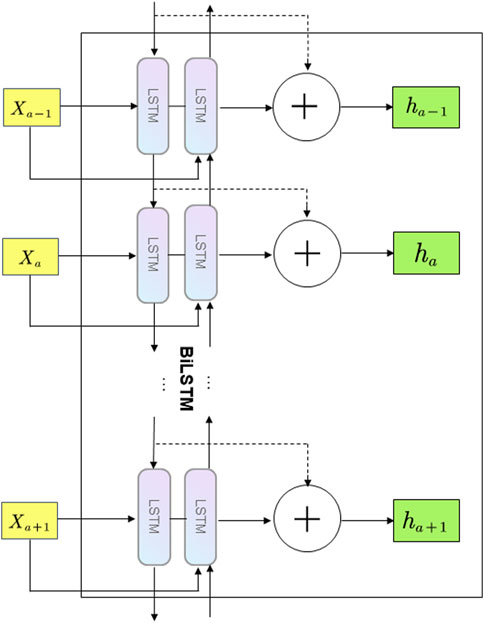
FIGURE 4. Calculation process of BiLSTM unit in real-time load forecasting process of smart grid.
We can see that the computational process of the forward LSTM structure in the BiLSTM network is similar to that of a single LSTM. By combining the forward hidden layer state and the reverse hidden layer state, we can obtain the hidden layer state of the BiLSTM network as shown in (2)
In (2), χt,
Bayesian Optimization is a method that uses the information from previously searched points to determine the next search point for solving black-box optimization problems with low dimensionality. It is a model-based sequential optimization method that can obtain a near-optimal solution to a model with little evaluation cost (Chen Z. et al., 2022). Bayesian optimization is commonly used in text classification, multi-category real-time prediction, and sentiment discrimination. Meanwhile, Bayesian optimization is also more widely used for sequential data prediction. Its structure diagram is shown in Figure 5.
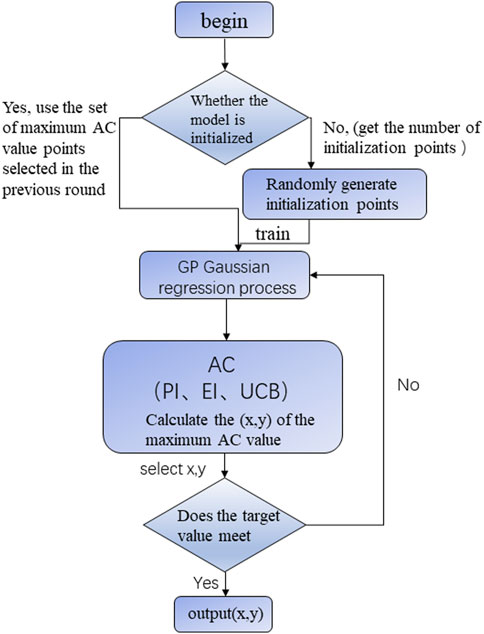
FIGURE 5. Flow chart of Bayesian module for optimizing CNN-BiLSTM computing model.
The model under the optimal hyperparameter combination can significantly improve the model’s prediction accuracy, so we need to optimise the hyperparameters of the model. Bayesian optimization, whose parameter optimisation function expression is shown in (3)
In (3), x is the value of the hyper value parameter to be optimized; f(x) is the performance function.
Gaussian Process (Song et al., 2020).
The probabilistic agent model for the Bayesian optimization process uses a Gaussian model, given a specific objective function f, input space is x ∈ R.
Dataset D =
The acquisition function used in this paper is GP-UCB(Gui-xiang et al., 2018). The expression of the function is as follows
This function finds the point that maximises the confidence interval of the Gaussian process by taking a weighted sum of the mean and covariance of the posterior distribution. Where μ(λ) stands for the mean value,σ(λ) represents the covariance, β1/2 represents the weight value (Table 1).
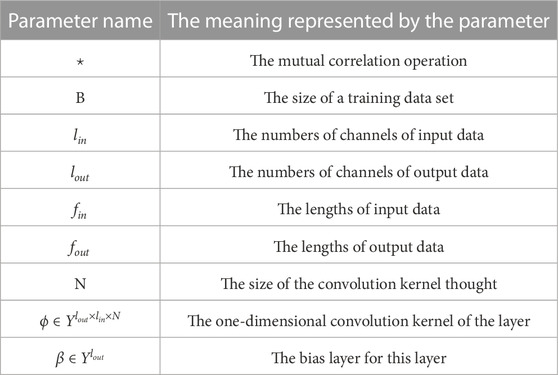
TABLE 1. Formula parameter meaning table.
This paper uses the data from ISO-NE, Elia, Singapore Electricity Load, and NREL databases as raw data.
ISO-NE: ISO-NE is the name given to New England’s electricity and energy sector, which manages the electricity system and market operations in New England (Derbentsev et al., 2020). ISO-NE’s primary responsibilities include its responsibility for producing, processing, and delivering electricity to end-users in the process, retail and industrial sectors (Shen et al., 2017); ensuring the safe, reliable, and economic operation of the electricity system; and managing the electricity market; facilitating cross-border electricity transactions and energy market ISO-NE’s service area includes Connecticut, Maine, Massachusetts, New Hampshire, Rhode Island, and Vermont. ISO-NE provides a wide range of data, including load, cost, production, and supply.
Elia: Elia is Belgium’s electricity high-voltage transmission grid and is responsible for managing the country’s high-voltage transmission network to ensure the security and stability of Belgium’s electricity supply (Peng et al., 2022). Celia’s main responsibilities include planning, building, operating, and maintaining Belgium’s high-voltage transmission grid and managing the transmission network’s market operations and electricity trading. Elia is also responsible for interconnecting with the transmission grids of other European countries to facilitate cross-border electricity trading. El aims to achieve a secure and reliable sustainable energy supply and support Belgium’s economic and social development.
NREL: NREL (National Renewable Energy Laboratory) is a national United States. Department of Energy laboratory dedicated to advancing the research and development of renewable energy and energy efficiency technologies. NREL’s mission is to promote the development and commercialization of renewable energy technologies through innovation and scientific and technological breakthroughs that support United States. energy security and environmental sustainability (Zou et al., 2022b). NREL’s research areas cover various renewable energy technologies such as solar, wind, biomass, and geothermal energy, energy storage, energy system integration, building energy efficiency, and other related areas. NREL also collaborates with other research institutions, industry, and government on several international collaborative projects to advance the development of renewable energy technologies worldwide. NREL has run Laboratory facilities and technology platforms, including a solar photovoltaic laboratory, wind energy laboratory, bioenergy laboratory, energy system integration center, etc., provides important support and guarantee for the research and development of renewable energy technologies, and also provides a large amount of data for analysis.
The electricity load in Singapore refers to the nationwide demand for electricity in various sectors, including industrial, commercial, and residential. As Singapore’s economy and population continue to grow, the electricity load is also increasing rapidly (Zou et al., 2022a). Singapore’s electricity load is mainly supplied by oil-fired, natural gas, and imported electric city. To meet future electricity demand and environmental requirements, the Singapore government is actively promoting the development of renewable energy and energy efficiency technologies to reduce dependence on fossil fuels and promote sustainable energy development.
Here we use four selected data sets as the original data and put them into the model for prediction by calculating their maximum and minimum values and standard deviations (Table 2).
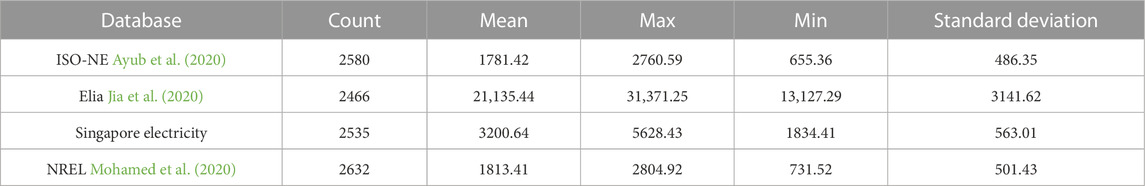
TABLE 2. Data sets from different databases.
To demonstrate the performance of our model, we designed several experiments to validate it. First, we compared our model with several other models in terms of inference time for complex data, and to prevent experimental chance, we further demonstrated the superiority of our model by comparing the training time of the model with other models and the performance of different models at different levels of complexity. We also designed experiments on its AUC and number of parameters, and finally, we compared the computation time and accuracy of the four data sets under different models, and we can see that the computation rate, the number of parameters required, and the experimental results of the CNN-BiLSTM-BO model are significantly better than those of other models. Therefore, our model can better predict the smart grid real-time load data.
In Figure 6, it is easy to see that in the performance for complex data, the other three models are inferior to ours regarding inference time for the same complex data. CEEMDAN and CNN-LSTM perform almost the same for a large amount of complex data, but inevitably, they both take longer inference time than our model for the same amount of complex data, and our model has faster speed.

FIGURE 6. Comparison of different models for complex data inference time.
Figure 7 compares the training time of the different models on the data. We compare the training time with the three models. We can see that there is almost no difference in the time required to train SVM and BP Network for a small amount of data with a slightly medium and large amount of data, and in the case of a medium amount of data, SVM almost catches up with our model. The training time of our model is shorter than the other three experimental models for both small and large amounts of data, so it can significantly reduce the time consumed to train the model and enable the model to make more contributions simultaneously.
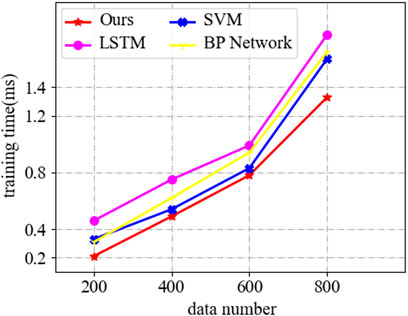
FIGURE 7. Comparison of data training time under different models.
In this set of experiments (Figure 8), we use three models to compare the performance of different levels of difficulty data8. It is evident from the experiments that the version of each model decreases as the complexity of the data increases. Still, our model reduces the least, so our model can cope with data of various difficulty levels.
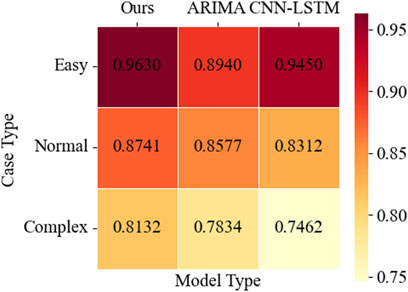
FIGURE 8. Performance at different levels of model complexity.
In this set of experiments (Figure 9), we test the computational flops of each model. The experimental results show that the most significant computational rollover required is the ARIMA model. The minor computational flops required is the BP Network, followed by our experimental model. Although our model is not the best-performing one in this group of experiments, our model outperforms CNN-LSTM, which proves that the performance of our model is substantially improved after Bayesian optimization, thus providing solid experimental results to demonstrate the feasibility of our model.
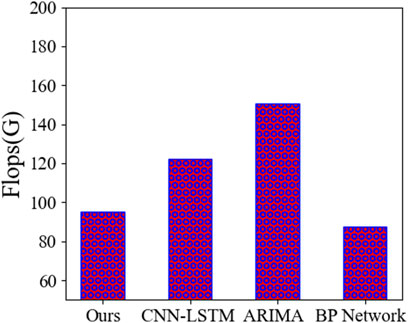
FIGURE 9. The number of flops required for different models.
In this set of experiments (Figure 10), we selected several groups of panel data. By comparing the AUC of our model when computing with the AUC of the chosen locations of panel data when computing with the GNN model, we can verify the performance of the AUC of different models when calculating with other panels. All experimental results of our model after several sets of data comparisons show that the performance of the AUC of our model when facing panel data is more robust than GNN.
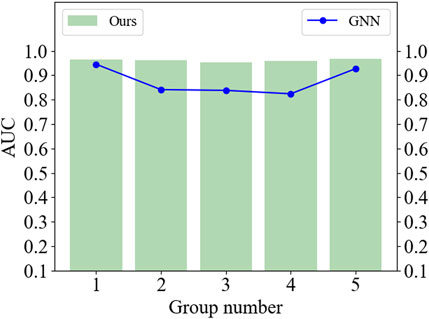
FIGURE 10. Comparison of AUC under different models with several groups of data.
This set of experiments (Figure 11) compares the size of the number of parameters required by different models11. After a series of experiments, we can find that, among the selected models, GNN operation requires the most parameters, CEEMDAN operation requires slightly fewer parameters than GNN, LSTM operation requires significantly fewer parameters, and our model is lower than LSTM. Our model also has a very brilliant performance regarding the number of parameters necessary for the operation; fewer parameters can reduce the burden of the model and related work and make the model better at calculating the data.
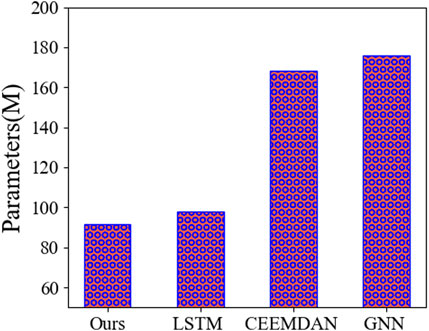
FIGURE 11. Number of parameters required for different models.
This is the flow chart of the Algorithm 1 of the model; firstly, the smart grid real-time load data is input, the data is pre-processed and normalized in the data input layer, then the data set is put into the one-dimensional CNN unit for feature extraction, the data set is processed for dimensionality reduction, and the feature sequence is finally output after pooling sampling and merging and reorganization in the fully connected layer, then the feature data is entered into the BiLSTM layer for smart grid real-time load feature learning, and then Bayesian optimization is performed to get the optimal parameters of the model to improve the accuracy of the prediction, and the final output of the forecast is superior.
Algorithm 1. Algorithmic representation of the training process in this paper.

In this set of experiments (Figure 12), we trained our four selected data sets in multiple models, and it is not difficult to find that the results of the experiments on all four data sets show that GNN takes the longest computing time, while our model has the shortest computing time in the face of the remaining four models, and the time required is even close to half of that of GNN. This set of experiments powerfully demonstrates the superiority of our model’s computing speed and significantly reduces the time required for our work, but also provides experimental data to prove the feasibility of choosing our model.
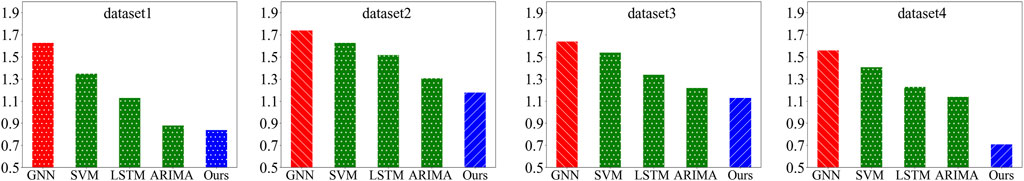
FIGURE 12. Comparison of computing time of different models.
In the last group of experiments (Figure 13), we used four models to conduct experiments on the four data sets we selected to compare the accuracy of the experiments. From the experimental results, we can find that SEEMDAN, LSTM, and BPNetwork have different performances in dealing with other data sets, i.e., the accuracy of the three models selected in this group, except our model, varies significantly in the face of different data. This is fatal to the accuracy and precision of the experiments. If the models do not have stable experimental stability in the face of other data, the testing results are not convincing. Then our model, in the f of the performance of the four data sets we have selected, accuracy does not vary significantly and can be said to be the same, so it can guarantee the accuracy of the experimental results, which can make our testing results have better accuracy and persuasive power.
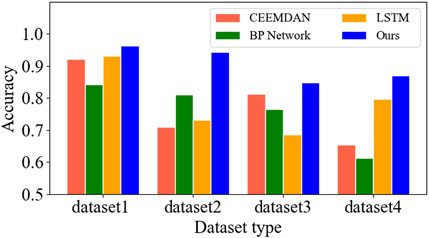
FIGURE 13. Comparison of the accuracy of different models on the dataset.
Table 3 compares the accuracy, computation, and parameter size of the models mentioned in the paper with our model. The table shows that our model has significant advantages in these aspects.
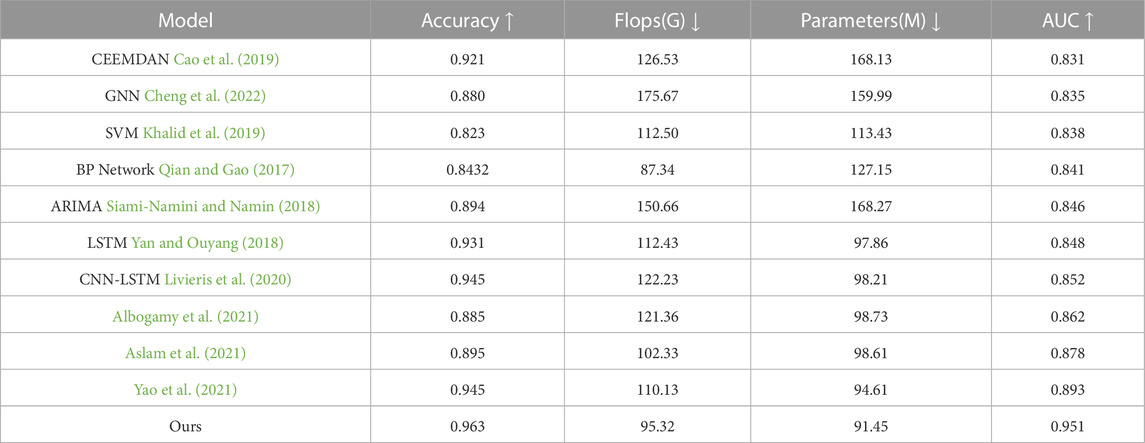
TABLE 3. A comparison of different models.
In this paper, a smart grid real-time load prediction model based on Bayesian optimization of CNN-BiLSTM is proposed, which effectively solves the problem of gradient disappearance and gradient explosion while improving the accuracy and practicality of the model, the more vital feature extraction ability of the one-dimensional CNN, first, the smart grid real-time load data is first input into the one-dimensional CNN network, and after convolution for feature extraction into the pooling Simplify the feature data. Then the simplified feature data is input into the BiLSTM network; BiLSTM is based on a kind of LSTM extension, which can better retain the information provided by the nodes at a longer distance; BiLSTM memory network has two directions of transmission layer compared to the LSTM network can handle more data volume at the same time. It has a more efficient exploration efficiency for predicting smart grid real-time load.
Nevertheless, our model still has some shortcomings, as the BiLSTM network is used instead of the LSTM network. Hence, the operation speed is more complicated, which may impact the operation rate, and the number of parameters required will increase year-on-year because of the complexity of deep learning and the degree of model combination.
Smart grid real-time load forecasting is an important technology that has many functions (Aslam et al., 2020).The following are the roles of conducting smart grid real-time load forecasting: 1. Optimize power system operation: Smart grid real-time load forecasting can help power system managers to rationally deploy power resources according to load demand to ensure stable and reliable power system operation. 2. Improve the efficiency of the power system: Through smart grid real-time load forecasting, power system managers can better understand the demand of power loads, thus optimizing the operation efficiency of the power system and reducing energy waste and cost. 3. Promote the application of renewable energy: Smart grid real-time load forecasting can help power system managers more accurately predict the production and supply of renewable energy, thus better planning and managing the application of renewable energy and promoting the development and utilization of renewable energy. 4. Improve the operation of energy markets: Smart grid real-time load forecasting can provide energy market participants with more accurate electricity load forecasts and market information, facilitating the efficient process and development of energy markets.
Therefore, smart grid real-time load forecasting is indispensable for both power system managers and the whole grid system. Our smart grid real-time load forecasting model can help power system managers to forecast the demand of power load more accurately for better planning and management of power system operation.
The original contributions presented in the study are included in the article/supplementary material, further inquiries can be directed to the corresponding author.
DZ, XJ, and XC contributed to conception and design of the study. PS organized the database. DZ performed the statistical analysis and wrote the first draft of the manuscript. XC reviewed and edited sections of the manuscript. All authors have read and agreed to the published version of the manuscript.
The research is funded partially by Excellent Young Talents Support Program of Anhui Universities (gxyq2021233), Key Science Research Project of Industry-University Research (BYC2021Z01), Teaching Quality Engineering of Anhui Province (2021xsxxkc181,2019sxzx24), and Teaching Demonstration Course Project of Anhui Province (2020jxsfk002), Key Science Research Project of Anhui Universities (2022AH052413), Scientific and technological innovation team project (BKJCX202202).
The authors declare that the research was conducted in the absence of any commercial or financial relationships that could be construed as a potential conflict of interest.
All claims expressed in this article are solely those of the authors and do not necessarily represent those of their affiliated organizations, or those of the publisher, the editors and the reviewers. Any product that may be evaluated in this article, or claim that may be made by its manufacturer, is not guaranteed or endorsed by the publisher.
Albogamy, F. R., Hafeez, G., Khan, I., Khan, S., Alkhammash, H. I., Ali, F., et al. (2021). Efficient energy optimization day-ahead energy forecasting in smart grid considering demand response and microgrids. Sustainability 13, 11429. doi:10.3390/su132011429
Aravind, V. S., Anbarasi, M., Maragathavalli, P., and Suresh, M. (2019). “Smart electricity meter on real time price forecasting and monitoring system,” in 2019 IEEE international conference on system, computation, automation and networking (ICSCAN), Pondicherry, India, 29-30 March 2019 (IEEE), 1–5.
Aslam, S., Ayub, N., Farooq, U., Alvi, M. J., Albogamy, F. R., Rukh, G., et al. (2021). Towards electric price and load forecasting using cnn-based ensembler in smart grid. Sustainability 13, 12653. doi:10.3390/su132212653
Aslam, S., Khalid, A., and Javaid, N. (2020). Towards efficient energy management in smart grids considering microgrids with day-ahead energy forecasting. Electr. Power Syst. Res. 182, 106232. doi:10.1016/j.epsr.2020.106232
Ayub, N., Javaid, N., Mujeeb, S., Zahid, M., Khan, W. Z., and Khattak, M. U. (2020). “Electricity load forecasting in smart grids using support vector machine,” in Advanced information networking and applications: Proceedings of the 33rd international conference on advanced information networking and applications (AINA-2019) 33 (Cham: Springer), 1–13.
Cabán, C. C. T., Yang, M., Lai, C., Yang, L., Subach, F. V., Smith, B. O., et al. (2022). Tuning the sensitivity of genetically encoded fluorescent potassium indicators through structure-guided and genome mining strategies. ACS sensors 7, 1336–1346. doi:10.1021/acssensors.1c02201
Cai, W., Liu, D., Ning, X., Wang, C., and Xie, G. (2021). Voxel-based three-view hybrid parallel network for 3d object classification. Displays 69, 102076. doi:10.1016/j.displa.2021.102076
Cao, J., Li, Z., and Li, J. (2019). Financial time series forecasting model based on ceemdan and lstm. Phys. A Stat. Mech. its Appl. 519, 127–139. doi:10.1016/j.physa.2018.11.061
Chen, B.-R., Liu, Z., Song, J., Zeng, F., Zhu, Z., Bachu, S. P. K., et al. (2022a). “Flowtele: Remotely shaping traffic on internet-scale networks,” in Proceedings of the 18th International Conference on emerging Networking EXperiments and Technologies, Roma Italy, December 6 - 9, 2022, 349–368.
Chen, Z., Silvestri, F., Tolomei, G., Wang, J., Zhu, H., and Ahn, H. (2022b). Explain the explainer: Interpreting model-agnostic counterfactual explanations of a deep reinforcement learning agent. IEEE Trans. Artif. Intell., 1–15. doi:10.1109/tai.2022.3223892
Cheng, D., Yang, F., Xiang, S., and Liu, J. (2022). Financial time series forecasting with multi-modality graph neural network. Pattern Recognit. 121, 108218. doi:10.1016/j.patcog.2021.108218
Derbentsev, V., Matviychuk, A., Datsenko, N., Bezkorovainyi, V., and Azaryan, A. (2020). Machine learning approaches for financial time series forecasting (CEUR Workshop Proceedings).
Estrella, R., Belgioioso, G., and Grammatico, S. (2019). A shrinking-horizon, game-theoretic algorithm for distributed energy generation and storage in the smart grid with wind forecasting. IFAC-PapersOnLine 52, 126–131. doi:10.1016/j.ifacol.2019.06.022
Gui-xiang, S., Xian-zhuo, Z., Zhang, Y.-z., and Chen-yu, H. (2018). Research on criticality analysis method of cnc machine tools components under fault rate correlation. IOP Conf. Ser. Mater. Sci. Eng. 307, 012023. doi:10.1088/1757-899X/307/1/012023
He, F., and Ye, Q. (2022). A bearing fault diagnosis method based on wavelet packet transform and convolutional neural network optimized by simulated annealing algorithm. Sensors 22, 1410. doi:10.3390/s22041410
Jia, Y., Lyu, X., Xie, P., Xu, Z., and Chen, M. (2020). A novel retrospect-inspired regime for microgrid real-time energy scheduling with heterogeneous sources. IEEE Trans. Smart Grid 11, 4614–4625. doi:10.1109/tsg.2020.2999383
Khalid, R., Javaid, N., Al-Zahrani, F. A., Aurangzeb, K., Qazi, E.-u.-H., and Ashfaq, T. (2019). Electricity load and price forecasting using jaya-long short term memory (jlstm) in smart grids. Entropy 22, 10. doi:10.3390/e22010010
Li, C., Chen, Z., and Jiao, Y. (2023). Vibration and bandgap behavior of sandwich pyramid lattice core plate with resonant rings. Materials 16, 2730. doi:10.3390/ma16072730
Li, Y., Wei, D., Chen, X., Song, Z., Wu, R., Li, Y., et al. (2018). “Dumbnet: A smart data center network fabric with dumb switches,” in Proceedings of the Thirteenth EuroSys Conference, Porto, Portugal, April 23-26, 2018, 1–13.
Liu, Z., Chen, S., and Luo, X. (2013). “Judgment and adjustment of tipping instability for hexapod robots,” in 2013 IEEE International Conference on Robotics and Biomimetics (ROBIO), Shenzhen, China, 12-14 December 2013 (IEEE), 1941–1946.
Livieris, I. E., Pintelas, E., and Pintelas, P. (2020). A cnn–lstm model for gold price time-series forecasting. Neural Comput. Appl. 32, 17351–17360. doi:10.1007/s00521-020-04867-x
Luo, X., Jiang, Y., and Xiao, X. (2022). “Feature inference attack on shapley values,” in Proceedings of the 2022 ACM SIGSAC Conference on Computer and Communications Security, Los Angeles CA USA, November 7 - 11, 2022, 2233–2247.
Mohamed, A. A., Day, D., Meintz, A., and Jun, M. (2020). Real-time implementation of smart wireless charging of on-demand shuttle service for demand charge mitigation. IEEE Trans. Veh. Technol. 70, 59–68. doi:10.1109/tvt.2020.3045833
Ning, X., Duan, P., Li, W., and Zhang, S. (2020). Real-time 3d face alignment using an encoder-decoder network with an efficient deconvolution layer. IEEE Signal Process. Lett. 27, 1944–1948. doi:10.1109/lsp.2020.3032277
Ning, X., Tian, W., He, F., Bai, X., Sun, L., and Li, W. (2023). Hyper-sausage coverage function neuron model and learning algorithm for image classification. Pattern Recognit. 136, 109216. doi:10.1016/j.patcog.2022.109216
Niu, H., Lin, Z., Zhang, X., and Jia, T. (2022). “Image segmentation for pneumothorax disease based on based on nested unet model,” in 2022 3rd International Conference on Computer Vision, Image and Deep Learning and International Conference on Computer Engineering and Applications (CVIDL and ICCEA), Changchun, China, 20-22 May 2022 (IEEE), 756–759.
Papadaki, S., Wang, X., Wang, Y., Zhang, H., Jia, S., Liu, S., et al. (2022). Dual-expression system for blue fluorescent protein optimization. Sci. Rep. 12, 10190. doi:10.1038/s41598-022-13214-0
Peng, H., Huang, S., Chen, S., Li, B., Geng, T., Li, A., et al. (2022). “A length adaptive algorithm-hardware co-design of transformer on fpga through sparse attention and dynamic pipelining,” in Proceedings of the 59th ACM/IEEE Design Automation Conference, San Francisco California, July 10 - 14, 2022, 1135–1140.
Qian, X.-Y., and Gao, S. (2017). Financial series prediction: Comparison between precision of time series models and machine learning methods. arXiv preprint arXiv:1706.00948, 1–9.
Shen, G., Zeng, W., Han, C., Liu, P., and Zhang, Y. (2017). Determination of the average maintenance time of cnc machine tools based on type ii failure correlation. Eksploatacja i Niezawodnosc - Maintenance Reliab. 19, 604–614. doi:10.17531/ein.2017.4.15
Siami-Namini, S., and Namin, A. S. (2018). Forecasting economics and financial time series: Arima vs. lstm. arXiv preprint arXiv:1803.06386.
Song, Z., Johnston, R. M., and Ng, C. P. (2021). Equitable healthcare access during the pandemic: The impact of digital divide and other sociodemographic and systemic factors. Appl. Res. Artif. Intell. Cloud Comput. 4, 19–33.
Song, Z., Mellon, G., and Shen, Z. (2020). Relationship between racial bias exposure, financial literacy, and entrepreneurial intention: An empirical investigation. J. Artif. Intell. Mach. Learn. Manag. 4, 42–55.
Wu, S., Wang, J., Ping, Y., and Zhang, X. (2022). “Research on individual recognition and matching of whale and dolphin based on efficientnet model,” in 2022 3rd International Conference on Big Data, Artificial Intelligence and Internet of Things Engineering (ICBAIE), Xi’an, China, 15-17 July 2022 (IEEE), 635–638.
Xiang, C., Wu, Y., Shen, B., Shen, M., Huang, H., Xu, T., et al. (2019). “Towards continuous access control validation and forensics,” in Proceedings of the 2019 ACM SIGSAC conference on computer and communications security, London United Kingdom, November 11 - 15, 2019, 113–129.
Xu, F., Zheng, Y., and Hu, X. (2020). “Real-time finger force prediction via parallel convolutional neural networks: A preliminary study,” in 2020 42nd Annual International Conference of the IEEE Engineering in Medicine and Biology Society (EMBC), Montreal, QC, Canada, 20-24 July 2020 (IEEE), 3126–3129.
Yan, H., and Ouyang, H. (2018). Financial time series prediction based on deep learning. Wirel. Personal. Commun. 102, 683–700. doi:10.1007/s11277-017-5086-2
Yao, R., Li, J., Zuo, B., and Hu, J. (2021). Machine learning-based energy efficient technologies for smart grid. Int. Trans. Electr. Energy Syst. 31, e12744. doi:10.1002/2050-7038.12744
Zhang, H., Zhang, F., Gong, B., Zhang, X., and Zhu, Y. (2023). The optimization of supply chain financing for bank green credit using stackelberg game theory in digital economy under internet of things. J. Organ. End User Comput. 35, 1–16. doi:10.4018/joeuc.318474
Zhang, R., Zeng, F., Cheng, X., and Yang, L. (2019). “Uav-aided data dissemination protocol with dynamic trajectory scheduling in vanets,” in ICC 2019-2019 IEEE International Conference on Communications (ICC), Shanghai, China, 20-24 May 2019 (IEEE), 1–6.
Zhibin, Z., Liping, S., and Xuan, C. (2019). Labeled box-particle cphd filter for multiple extended targets tracking. J. Syst. Eng. Electron. 30, 57–67. doi:10.21629/JSEE.2019.01.06
Zou, Z., Careem, M., Dutta, A., and Thawdar, N. (2022a). Joint spatio-temporal precoding for practical non-stationary wireless channels. arXiv preprint arXiv:2211.06017.
Keywords: CNN, BiLSTM, bayesian optimization, smart grid, load forecast
Citation: Zhang D, Jin X, Shi P and Chew X (2023) Real-time load forecasting model for the smart grid using bayesian optimized CNN-BiLSTM. Front. Energy Res. 11:1193662. doi: 10.3389/fenrg.2023.1193662
Received: 25 March 2023; Accepted: 10 April 2023;
Published: 05 May 2023.
Edited by:
Xin Ning, Chinese Academy of Sciences (CAS), ChinaReviewed by:
Luyang Hou, Beijing University of Posts and Telecommunications (BUPT), ChinaCopyright © 2023 Zhang, Jin, Shi and Chew. This is an open-access article distributed under the terms of the Creative Commons Attribution License (CC BY). The use, distribution or reproduction in other forums is permitted, provided the original author(s) and the copyright owner(s) are credited and that the original publication in this journal is cited, in accordance with accepted academic practice. No use, distribution or reproduction is permitted which does not comply with these terms.
*Correspondence: XinYing Chew, eGlueWluZ0B1c20ubXk=
Disclaimer: All claims expressed in this article are solely those of the authors and do not necessarily represent those of their affiliated organizations, or those of the publisher, the editors and the reviewers. Any product that may be evaluated in this article or claim that may be made by its manufacturer is not guaranteed or endorsed by the publisher.
Research integrity at Frontiers
Learn more about the work of our research integrity team to safeguard the quality of each article we publish.