 Benxi Liu
 Zihan Peng
 Shengli Liao1
 Tengyuan Liu
 Jia Lu
94% of researchers rate our articles as excellent or good
Learn more about the work of our research integrity team to safeguard the quality of each article we publish.
Find out more
ORIGINAL RESEARCH article
Front. Energy Res. , 10 May 2023
Sec. Process and Energy Systems Engineering
Volume 11 - 2023 | https://doi.org/10.3389/fenrg.2023.1193415
This article is part of the Research Topic Key Technologies for Hybrid Energy System Planning and Operation View all 10 articles
The rapid growth of wind and solar energy sources in recent years has brought challenges to power systems. One challenge is surging wind and solar electric generation, understanding how to consume such generation is important. Achieving the complementarity of hydropower and renewable energies such as wind and solar power by utilizing the flexible regulation performance of hydropower is helpful to provide firm power to help renewable energy consumption. However, the multi-energy complementary operation mode will change the traditional hydropower operation mode, causing challenges to the comprehensive utilization of hydropower. In this paper, a multi-objective optimal scheduling model is built by considering coordinated hydro-wind-solar system peak shaving and downstream navigation. First, the Gaussian mixture model is adopted to quantify the uncertainty of wind and solar power. Then, a hydro-wind-solar coordinated model was built to obtain the standard deviation of the residual load and the standard deviation of the downstream water level. Finally, the ε-constraint method is used to solve for the Pareto optimality. The results demonstrate the following: 1) The proposed model can effectively determine hydropower output schemes that can coordinate wind and solar power output to reconcile peak shaving and navigation; 2) The downstream hydropower stations’ reverse regulation of the upstream hydropower station is a positive factor in reconciling conflicts; and 3) Reasonable planning of wind power and solar power is helpful for hydro-wind solar power complement operation.
With the explosive growth of wind and solar power sources, grid-integrated variable renewable energy (VRE) has become a key part of achieving the “Carbon Peaking and Carbon Neutrality Goals” in China (Department of Resource Conservation and Environmental Protection, 2021). However, the inherent intermittent and random characteristics of wind and solar power seriously challenge the safety and reliability operation of power systems (Albadi and El-Saadany, 2010; Shivashankar et al., 2016; Jabir et al., 2017; Asiaban et al., 2021). Using flexible power sources to mitigate renewable intermittency is a key solution (Shivashankar et al., 2016). Hydropower is a flexible power source that has developed technology, a large scale, and a low cost. Thus, hydropower that complements VREs is important to support the wide-ranging integration of VREs such as wind and solar. However, hydropower that operates in unison with reservoirs usually serves multiple purposes. It not only needs to meet the demand for electricity generation, but also serves navigation, flood control, irrigation, ecological protection, and other comprehensive utilization tasks. Using hydropower to complement VREs will significantly change the operation mode of hydropower, and directly affect the power output, water level, and discharge flow of the reservoir. This may conflict with comprehensive utilization tasks (Jian et al., 2012; Shang et al., 2017). Therefore, exploring a reasonable operation method that considers the hydro-wind-solar complementation mode and comprehensive hydropower utilization is very significant for multi-energy complementation and the large-scale consumption of wind and solar.
Research on the operation of hybrid hydro-wind-solar systems, include studies (Zhu et al., 2018; Hu et al., 2021) that have evaluated the complementarity and united operation reliability of hydro-wind-solar power; moreover, various models suitable for different needs are established. In the literature (Liu et al., 2019a), a united operation strategy of hydro-wind-solar power, which can effectively suppress the intermittency of wind and solar output, is proposed by considering the natural complementarity of wind and solar power. The literature (Xie et al., 2021) shows that the introduction of spinning reserve and regulating reserve in the model can effectively deal with intermittent wind and solar power and improve the practical application ability of the hybrid hydro-wind-solar system. The literature (Jin et al., 2022) shows that properly developed wind and solar power can effectively utilize complementarity and reducing hydropower output fluctuations on multiple time scales. The literature (Wang et al., 2019b) simplifies the system by dividing the subsystems that can be coordinated to operate, and obtains the long-term scheduling scheme of the hydro-wind-solar power complementary system based on the whole basin. The literature (Chen et al., 2019) predicts wind and solar output through environmental conditions such as wind speed, radiation intensity, and temperature. On this basis, a hydro-wind-solar short-term complementary model that minimizes residual load fluctuations and maximizes VRE output is established.
However, with the rapid growth of integrated VREs, problems such as the risk of power output curtailment and the safe operation of high-proportion clean energy systems have become increasingly evident (Ding et al., 2016; Cheng et al., 2017; Luo et al., 2018), and scholars are constantly looking for solutions. The literature (Zhang et al., 2018) aimed to minimize the amount of curtailed wind and solar power and to maximize the stored energy in cascade hydropower stations and then established a short-term optimal scheduling model of hydro-wind-solar power. The literature (Liu et al., 2020) controlled the amount of curtailed wind and solar power by quantifying the uncertainty. The literature (Li et al., 2018) established an expansion planning method for a large-scale hybrid wind-solar multi-objective transmission network, which effectively reduced the amount of abandoned wind and solar energy in the power grid. The literature (Xi’an Jiaotong University et al., 2019) proposed a system for testing the reliability of large-scale renewable electricity integration and long-distance transmission. The literature (Ming et al., 2019) established a water-solar complementary long-term optimization model for large-scale solar power participation, and deduced a scheduling scenario that is superior to traditional rules in terms of energy production and power supply reliability.
Research on multi-energy complementarity with hydropower mostly regards hydropower stations as power production units. However, hydropower stations with reservoirs can also provide multiple benefits, such as ecological protection, irrigation, and navigation. Moreover, existing studies have shown that the participation of hydropower in peak regulation has adverse effects on the comprehensive benefits of reservoirs (Pérez-Díaz and Wilhelmi, 2010; Wan et al., 2020; Halleraker et al., 2022). Therefore, the reasonable operation of hydropower stations must also consider the conflict between different tasks. The literature (Li et al., 2020) used non-dominated sorting genetic algorithm to find the hydropower station scheduling scenario that considered the ecological needs of fish and hydropower generation. The literature (Niu et al., 2016) established a dual-objective model that takes both peak shaving and navigation under the background of demand conflict. The literature (Liu et al., 2019b) established multi-objective optimal dispatching model that considers the power generation of hydropower stations, power generation stability and ecological requirements of downstream rivers. The literature (Wang et al., 2019a) proposes a hydropower station dispatching plan that meets the requirements of hydropower compensation for wind power generation and daily water storage targets during the reservoir storage period.
It can be seen from the above studies that most of the studies regard hydro-wind-solar multi-energy complementary and hydropower multi-objective optimal scheduling as two independent research directions at present. For the power grid companies or power dispatching departments, in the context of the increasing demand for renewable energy consumption, when developing power generation plans for hydropower stations with navigational requirements, they need to consider not only the demand for renewable energy consumption and peak regulation of the power grid, but also the navigational requirements of the hydropower stations. For this situation, the main contributions of this paper are as follows:
(1) This paper proposed a hydro-wind-solar coordinated operation model. In which, two objectives, peak shaving and navigation, are considered.
(2) The model uses Gaussian mixture model to estimate the forecast output error considering the uncertainty of wind and solar output. Using the upper and lower limits of the forecast output error, the chance constraints are transformed into linear constraints that are easy to solve.
(3) The real-world applications are applied to illustrate the effectiveness and applicability of the proposed model, and the influence of wind and solar output on the model is analyzed from the aspects of uncertainty and installed capacity.
The rest of this paper is structured as follows. In Section 2, the analysis method of wind-solar uncertainty and the composition of the multi-objective hydro-wind-solar collaborative scheduling model are described. In Section 3, the Gaussian mixture model, which is used to address uncertainty, and the ε-constraint method, which is used to solve the dual-objective model, are introduced. In Section 4, the model is applied to the Jinghong-Ganlanba cascade hydropower system that complements wind and solar power. In Section 5, the influence of wind and solar factors on the model results are analyzed. The main conclusions of the model analysis are given in Section 6.
It is challenging to forecast the power generation of wind and solar power due to the inherent intermittency, which is affected by environmental factors such as wind speed and light intensity. The literatures (Lingfors and Widén, 2016; Gholami et al., 2017) shows that the wind and solar output will tend to smooth out with the increase in the cluster scale of wind and solar stations. In this paper, since power stations in the same area usually send power via the same transmission channels, all wind stations in the same area are combined into a virtual wind power plant (VWP) and all solar power stations are combined into a virtual solar power plant (VSP).
where
The forecast output error of the wind power plant and solar power plant is converted into the output error coefficient.
where
Describing the uncertainty of wind and solar output reasonably is important for building a hybrid hydro-wind-solar complementary model. The Gaussian mixture model (GMM) is a kind of non-parametric estimation method. Compared with the parameter estimation method, it can theoretically describe any distribution. Compared with the kernel density estimation method, the GMM can avoid the bandwidth setting effect on the accuracy of the results. Therefore, in this paper, the GMM is adopted to describe the output uncertainty of wind and solar power. Given a random variable
The essence of the GMM is a simple linear combination of multiple Gaussian distributions, and its expression can be described as:
where
With large-scale integration, the intermittent wind and solar power and the anti-peaking characteristics of wind power will challenge the peak shaving of the system. To meet the peak shaving requirements and balance the influence of wind and solar uncertainty, the flexible adjustment of hydropower output will cause frequent changes in downstream outflows and water level, which will directly affect navigation. Therefore, in this paper, peak shaving is considered the target of the hybrid hydro-wind-solar hybrid system:
where
where
a) Constraints of hydro-wind-solar complementarity
Since wind and solar power are uncertain and difficult to forecast accurately, chance constraints are introduced to use hydropower flexibility to complement wind and solar power output uncertainty.
Eqs 14, 15 represent positive and negative output complement constraints, respectively. In these equations,
b) Hybrid system reserve capacity requirements are satisfied with hydropower and can be expressed as a percentage of the power demand:
where
a) Mass balance constraints:
where
b) Simultaneous regulation constraints:
For all hydropower stations in the same cascade hydropower system, the output in each period usually has the same trend of change.
c) Reservoir storage constraints:
where
d) Total discharge constraints:
where
e) Turbine discharge constraints:
where
f) Initial storage and expected final storage and constraints:
where
g) Navigation constraints:
where
h) Water level-storage capacity function:
where
i) Downstream water level-discharge function:
where
In this paper, the GMM is used to analyze the distribution of output error coefficients of wind power and solar power plants. The Gaussian mixture model (GMM) is a kind of non-parametric estimation method, it can theoretically describe any distribution. Literature (Pöthkow and Hege, 2013) compared the extract uncertainty contour line effects of the non-parametric models with Gaussian, and observed that Non-parametric models have good feasibility for various data sets. Therefore, it has widely used in uncertainty description for diverse applications (Potter et al., 2009; Mihai and Westermann, 2014), and compactly model relatively complex distributions (Liu et al., 2012).With the historical forecast and actual output coefficient data of the solar and wind power plant, the deviation value between the actual and the forecasted output coefficient can be calculated. The GMM is used to fit the deviation value data of the output coefficient, and the probability density function (PDF)
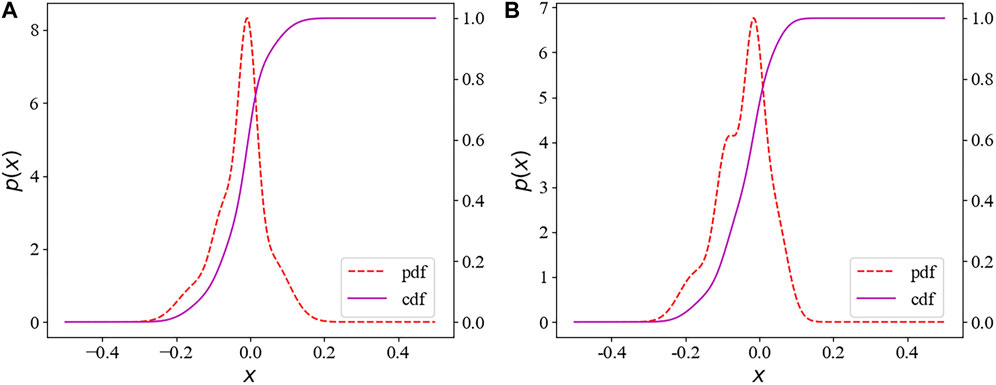
FIGURE 1. The PDF of the wind power plant output forecast error (A) and solar power plant output forecast error (B) of a typical period.
From the PDF graph of the output errors of the solar power plant and the wind power plant, the output coefficient deviation value can be obtained given the confidence interval [0.05, 0.95].
where
Confidence in chance constraints (14) and (15) represents the probability that the power gird can consume all the wind and solar power, and whether the constraints are established is affected by the wind and solar forecast error. The chance constraint (14) means that when the hydropower is at its maximum value, the probability that the actual output of the hydro-wind-solar system is greater than the forecast output should be greater than the confidence. If the actual output of the wind and solar power is too small, the constraint may be destroyed. Therefore, the minimum output
The chance constraint (15) means that when the hydropower is at the minimum value, the probability that the actual output of the hydro-wind-solar system is less than the forecast output should be greater than the confidence. If the actual output of scenery is too large, the constraint may be destroyed. Similarly, the opportunity constraint (15) can be transformed into that when the sum of wind power and photovoltaic output is
The
where
For the dual objective, if Objective
Take
Take
Take
Take
Yunnan Province is located in southwest China. In this region, with sufficient rainfall occurs, and several large rivers travels through, can be found. Yunnan province is endowed with abundant hydropower resources. In late 2022, the hydropower installed capacity in this region surged to 78.02 GW. This value is close to the hydropower installed capacity of Canada, which is the world’s third largest hydropower capacity. In addition, Yunnan Province is rich in renewable energy. In late 2022, wind power and solar power has surged to 8.83 and 4.17 GW respectively. However, there is very large potential for expanding wind and solar power resources, since the developed capacity accounts for only 5% of the developable capacity. According to the “New Energy Construction Plan of Yunnan Province in 2022” issued by Yunnan Province, Yunnan will accelerate the development of wind and solar power in the next few years. Since wind and solar power generation is depend on the weather, Yunnan is facing challenges of broad-scale renewable energy consumption and power grid peak shaving brought by the broad-scale integration of VREs. Therefore, using the flexibility of hydropower to achieve the multi-energy complementation of hydro-wind-solar power is one of the best ways for Yunnan to achieve large-scale consumption of VREs.
As shown in Figure 2, the Jinghong hydropower station and the Ganlanba hydropower station are both located in Jinghong City, Xishuangbanna Prefecture, Yunnan Province. They are the last two hydropower stations in the Lancang/Mekong River before flow out of China. Due to Jinghong’s rated flow and the restriction of downstream channel conditions, Jinghong’s adjustment of power generation flow will cause large fluctuations in downstream water level and flow, which will adversely affect navigation. To solve this problem, the main development task of the yet-to-be-constructed Ganlanba hydropower station is to provide reverse regulation for the Jinghong hydropower station to meet the downstream navigation requirements. Therefore, the Jinghong-Ganlanba cascade hydropwer station must undertake complex comprehensive utilization tasks. Considering Yunnan’s ever-increasing renewable energy construction plan, this cascade system will also undertake the severe task of VRES complementarity. Therefore, it is required to find a reasonable operation mode considering the conflicting objectives of generation and navigation. In this paper, the Jinghong-Ganlanba cascade hydropower stations are taken as the background. The load curve, interval runoff, initial and final water levels, and other conditions involved in the calculation process refer to the actual operating data of the power grid and power station, as shown in Supplementary Table S1.
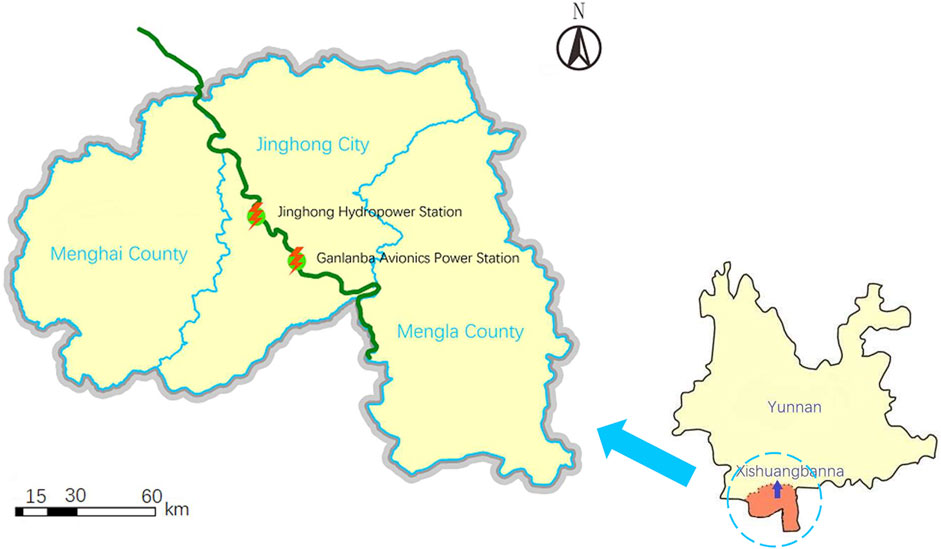
FIGURE 2. Schematic diagram of the hydropower station locations.
In this paper, a non-linear model is built, where a quadratic polynomial fitting function is used to express the water level-storage function and tail water level-discharge function. The model was solved using Lingo18.0.
According to Section 2.1, all wind power plants in the same region are considered as one wind power plant with the installed capacity of 208.5 MW and a solar power plant with the installed capacity of 300 MW. Figure 3 illustrates the typical wind and solar power daily output during the dry season (January, February, and March) of the lower reaches of the Lancang River, which were chosen to evaluate the scheduling situation of cascade hydropower stations under difficult conditions.

FIGURE 3. The typical time output coefficient of solar and wind power plant.
Since Ganlanba has not been constructed, three cases are considered to analyze the impact of the construction of the Ganlanba on the overall results and the impact of the navigation requirements on the separate operation of the Jinghong hydropower station: 1) Case 1: only the Jinghong hydropower plant is considered in the hybrid hydro-wind-solar complement operation model, but does not take navigation constraints into account; 2) Case 2: only the Jinghong hydropower plant is considered and takes navigation constraints into account and 3) Case 3: both Jinghong and Ganlanba are considered, and navigational constraints are also taken into account.
Figure 4 and Supplementary Table S2 show the distribution and range of the Pareto front for the three cases which reflect the conflict between the two objective functions. The rectangular area in Figure 4 marks solutions at the turning part of the Pareto front, which are hydropower output processes that can better meet the requirements of peak shaving and navigation at the same time. Under the experimental conditions, the Pareto front turning of the cascade solution is more obvious, indicating that it can moderate the conflict more effectively. Because the navigation constraints limit the output of Jinghong, the range of feasible solutions is reduced, and even some solutions with good peak-shaving effects turn into infeasible solutions.

FIGURE 4. Comparison of the Pareto front in different cases.
Figure 5 illustrate the differences of solutions on the Pareto front for Case1 and show the changes in the output and water abandonment under Case1, respectively, by selecting different downstream water level variance limits (
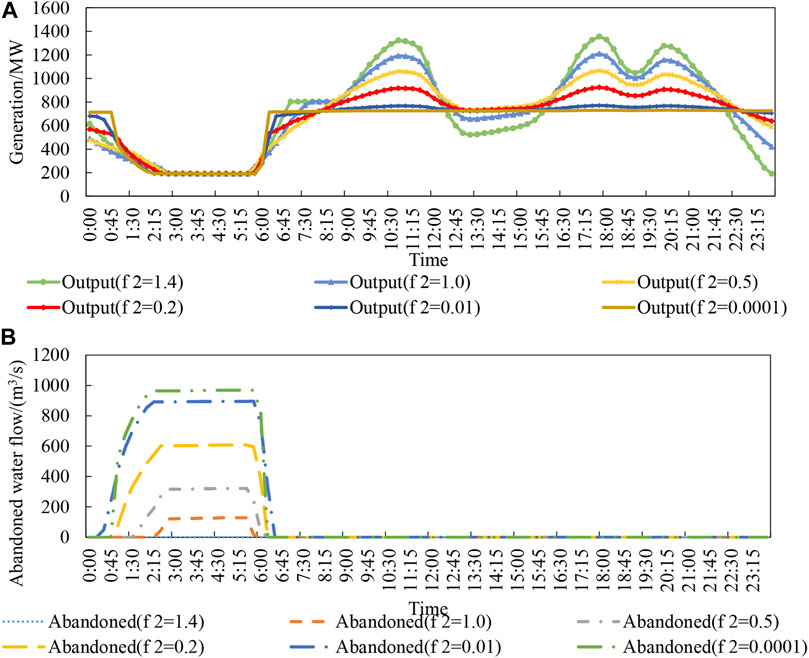
FIGURE 5. Comparison of (A) Jinghong's output and (B) abandoned water without navigation constraint.
In the Pareto front of Case 1, three scenarios of
Supplementary Table S3 summarizes the eigenvalues of each case. It is obvious that under the same
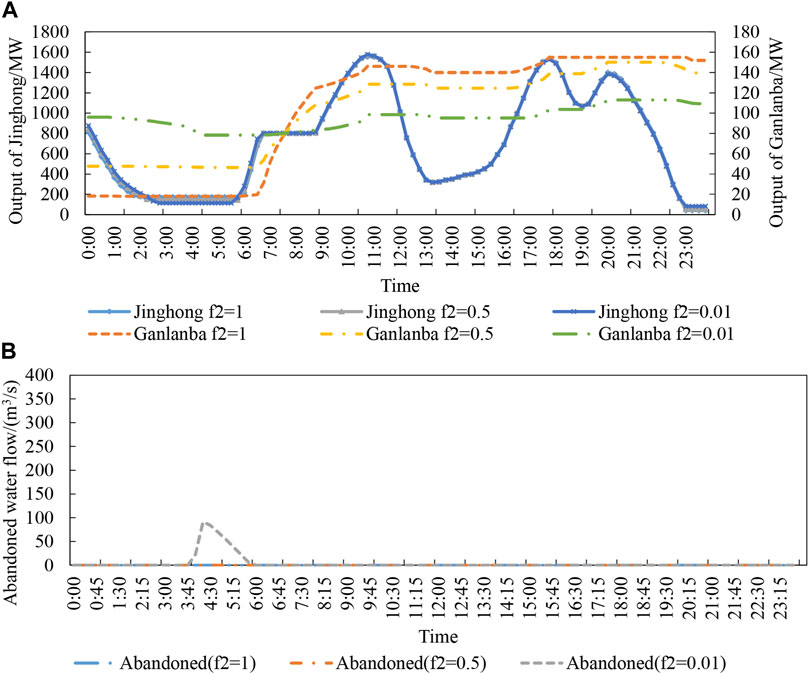
FIGURE 6. Cascade (A) hydropower station output and (B) abandoned water flow under different downstream water level variance targets.
Figure 7 shows the downstream water levels before and after the addition of Ganlanba and displays the affected navigation due to Ganlanba’s involvement. When the downstream water level variance is set to 0.01, the corresponding solution of Case 3 is located at the turning point of the Pareto front. In Figure 7, the Pareto front of Case 2 also has a corresponding solution, which can be compared. Without Ganlanba, the navigable water level is maintained at 537 m for 1/3 of the time, which indicates that the downstream channel barely meets the navigation requirements. For Case 3, the Ganlanba’s addition lowers the expense of maintaining navigation, and it maintains the navigation target’s ideal value between 529.45 m and 529.78 m. The safety of downstream navigation has been further assured compared to the minimum water level requirement of 525 m downstream of the Ganlanba.
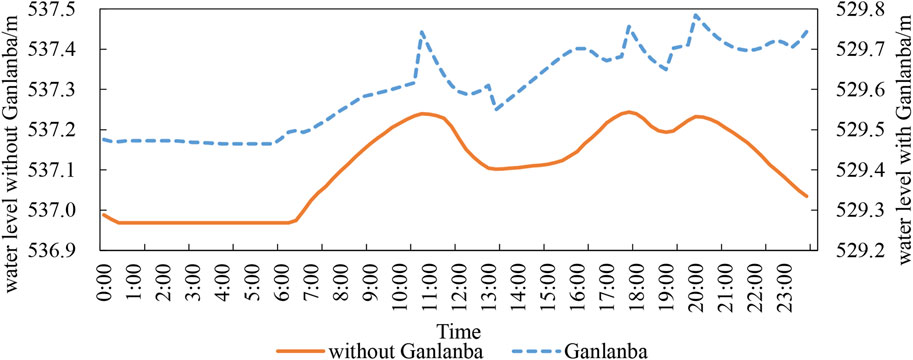
FIGURE 7. Comparison of the downstream water level (navigation) when f2 = 0.01.
In conclusion, the Ganlanba hydropower plant can successfully reduce the tension between peak shaving and navigation, address the issue of water abandonment for peak shaving, and raise the level of safety for downstream navigation.
Due to the randomness and uncontrollability of the wind and solar output, in actual operation, the real output of wind and solar power usually deviates from the predicted value. In this section, to analyze the influence of wind and solar power uncertainty on scheduling, 1) the residual load under various wind and solar output conditions is compared to analyze the influence of with/without considering hydro-wind-solar complementary constraints on the calculation results of the dual-objective model. 2) The hydropower output under various wind and solar capacity scenarios is evaluated to examine the impact of wind and solar power scale on the calculations of the dual-objective model. Therefore, 1,000 wind and solar output scenarios were generated by using the Monte Carlo method. Among the seven cases selected in Section 4.2, Case 3 (
Literature (Shen et al., 2021) proposes that the load fluctuation coefficient can be used to evaluate the peak shaving effect, and the revised index mainly reflects the overall smoothness of the load curve, which is better than the visualization effect of the residual load mean square error. Therefore, in this paper, this index is used to reflect the peak shaving effect in different scenarios:
where,
In Case 3, the actual operation of the cascade is simulated under two conditions: one condition with complementary constraints for the solar and wind output (Eqs 33, 34) and the other condition without such constraints. When there is no hydro-wind-solar complement constraint, the residual load in each scenario is:
where,
When considering the hydro-wind-solar complementary constraint, here are the residual loads for each scenario:
where
Through Eqs 40–45, the residual load under 1,000 simulation scenarios was carried out, and the distribution of the load fluctuation coefficients is shown in Figure 8. It is obvious that considering hydro-wind-solar complementarity can effectively control the residual load fluctuation in real operation where actual wind and solar power deviate from the forecast value. In summary, hydro-wind-solar complement operation can effectively reduce the adverse impact of wind and solar uncertainty on the peak shaving results.

FIGURE 8. Comparison of the residual load fluctuation coefficient under different scenarios.
Under the condition of fixed hydropower output and without providing wind and solar reserve capacity, the navigation effect will not be affected by VRE when actual wind and solar output deviate from the forecast value. In the case of hydro-wind-solar complement operation, the part of the output deviation between the upper and lower limits of the reserve capacity needs to be absorbed by changing the hydropower output. Due to the small adjustment capacity of Ganlanba, in this situation, Jinghong is required to undertake the adjustment tasks. Since the navigation is determined by the discharge of Ganlanba, the picture A of Figure 9 shows the maximum and minimum water levels of the Ganlanba reservoir and the upper limit and lower limit water levels of the Ganlanba reservoir under 1,000 scenarios. In all scenarios, Ganlanba reservoir’s water level will not exceed its limit, which means that when wind and solar forecast errors cause the upper reservoir outflow to change, Ganlanba has sufficient adjustment capacity to address it. The picture B of Figure 9 shows the downstream water level variance of Ganlanba Reservoir under 1,000 scenarios. The mean square deviations of the downstream water level in most scenarios are smaller than the predicted situation, and a few are slightly larger than the predicted situation. However, the difference is small and negligible. This demonstrates that Ganlanba can maintain navigational conditions despite VREs’ forecast errors.
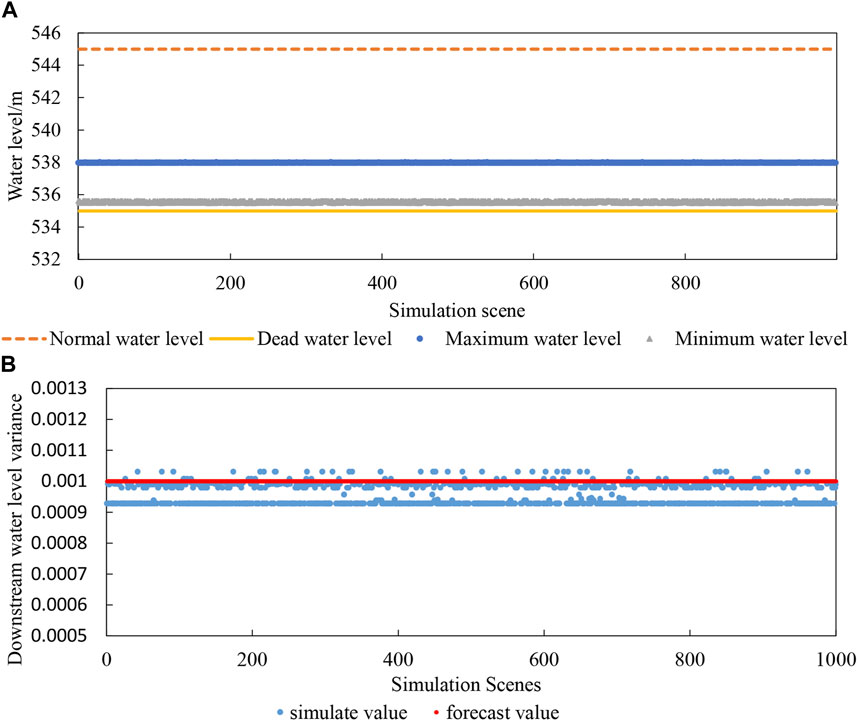
FIGURE 9. (A) Water level extremum and (B) downstream water level variance of the Ganlanba reservoir.
That is, wind and solar uncertainties have little effect on navigation.
In this section, different wind and solar power installed capacity scales are selected to explore their impact on the simulation results. There shows four wind and solar power scales. Scenario 1 elects solar power scales of 300 MW and wind power scales of 208.5 MW, which are the wind and solar installed capacity in 2020. Referring to the “List of New Energy Projects in the 14th Five-Year Plan of Yunnan Province,” Xishuangbanna will add 1.43 GW of solar power during the “14th Five-Year Plan” period. However, no wind power projects are planned. Scenario 2 sets the estimated installed capacity of solar and wind power in 2025 as 1730 and 208.5 MW. Scenario 3 sets the projected installed solar and wind capacity in 2030 as 3160 and 208.5 MW, and the growth rate is consistent with that in Scenario 2. Scenario 4 doubles the wind-power capacity installed based on Scenario 3, and sets the estimated installed capacity of solar and wind power as 3160 and 417 MW.
Figure 10 shows the residual load curves of each scenario, and Figure 11 shows the hydropower output gap between Scenario 1 and Scenario 2, 3 and 4, in which a negative value indicates that hydropower output will decrease as solar/wind power output increases, while a positive value indicates the opposite. As shown in these two figures, for Scenario 2 and 3, when solar power output increases, the residual load reduce from 8:30 to 20:00, and hydropower will reduce output during the load saddle periods and uses the saved water to increase the output during the load peak periods. This is because solar power is mainly generated during the daytime which is the load saddle, and hydropower adapts to achieve hydro-solar complementarity and improve the peak shaving effect. The simulation results of Scenarios 2 and 3 in Supplementary Table S4 also prove that increasing the output of solar power has a positive effect on the peak shaving of the model.
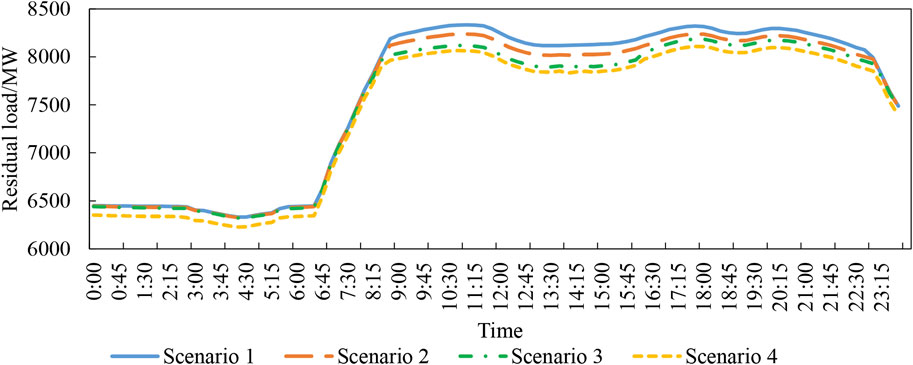
FIGURE 10. Residual load of scenarios.
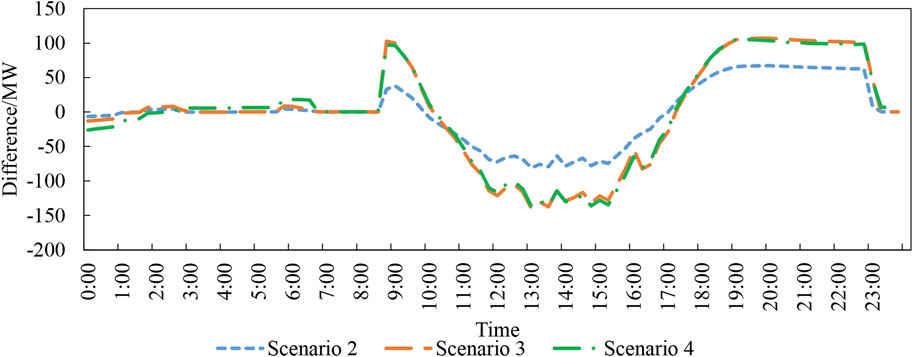
FIGURE 11. Hydropower output difference between scenarios 2,3,4 and 1.
As shown in Table 4, the peak-to-valley difference of the residual load increases from Scenario 3 to Scenario 4. This is because hydropower has reached the best peak shaving performance in Scenario 3. When the wind power capacity is increased from Scenario 3 to Scenario 4, the hydropower output changes little with the change of reserve capacity, as shown in Figure 11, and helps little in further peak shaving. Therefore, with the increase in wind power capacity, although both the residual peak load and valley load decrease, as the anti-peak characteristic of wind power shows in Figure 3., the peak-valley difference will increase.
Figure 11 shows that the hydropower output changes little, which means that the outflow of hydropower changes little. From Scenario 1 to Scenario 4, the increase in wind power and solar power scale will not have a large negative impact on navigation.
In summary, during the dry season, the increase in the scale of solar power output has a positive impact on the peak shaving of the hydro-wind-solar complementarity system; in contrast, wind power tends to have a negative impact on peak shaving.
Grid-connected VRE can be effectively solved by a coordinated development of hydro-wind-solar. However, there are conflicting relationships among the multiple tasks undertaken by hydropower stations. To ease the contradiction between multi-energy complementarity and comprehensive utilization tasks of hydropower stations, a hydro-wind-solar coordination scheduling model that takes both peak shaving and navigation objectives into account is established in this study. Conclusions can be drawn through the verification and analysis of an actual case study:
1) A Pareto front that considers the objectives of peak shaving and navigation is developed by applying the model to Jinghong-Ganlanba cascade hydropower station dispatching. The case study results show that there is an obvious turning point in the Pareto front of the cascade hydropower station, where the solution has a better effect of reconciling contradictions, which means that the conflict between the complement operation with VRE and comprehensive utilization can be reconciled or relieved with an appropriate method.
2) Hydropower station cooperation is very important for achieving multiple objectives. The case studies show that only Jinghong is unable to cope with task conflicts, and it is prone to the problem of water abandonment for peak shaving. The addition of Ganlanba not only eases task conflicts and Jionghong’s peak shaving ability but also helps reduce water abandonment.
3) Reasonable planning of wind power and solar power is important to make full use of hydro-wind-solar power complementary ability. The case study shows that, within the range of hydropower that can offer enough complement reserve capacity for wind and solar power, an increase in the solar power capacity has a positive impact on peak shaving, while an increase in wind power has a negative impact. To reconcile the needs of peak regulation and navigation, the development of wind and solar power within the range of complementary reserve capacity offered by hydropower is very important.
The original contributions presented in the study are included in the article/Supplementary Material, further inquiries can be directed to the corresponding author.
BL: Conceptualization, Methodology, Software, Funding acquisition, Supervision, and Resources. ZP: Software, Visualization, and Writing—original draft. SL: Supervision and Investigation. TL: Data curation and Software. JL: Formal analysis. All authors contributed to the article and approved the submitted version.
This study is supported by the National Natural Science Foundation of China (Grant No. 51979023) and the Open Research Fund of Hubei Key Laboratory of Intelligent Yangtze and Hydroelectric Science (Grant No. ZH2102000108).
Author JL is employed by China Yangtze Power Co Ltd.
The remaining authors declare that the research was conducted in the absence of any commercial or financial relationships that could be construed as a potential conflict of interest.
All claims expressed in this article are solely those of the authors and do not necessarily represent those of their affiliated organizations, or those of the publisher, the editors and the reviewers. Any product that may be evaluated in this article, or claim that may be made by its manufacturer, is not guaranteed or endorsed by the publisher.
The Supplementary Material for this article can be found online at: https://www.frontiersin.org/articles/10.3389/fenrg.2023.1193415/full#supplementary-material
Albadi, M. H., and El-Saadany, E. F. (2010). Overview of wind power intermittency impacts on power systems. Electr. Power Syst. Res. 80, 627–632. doi:10.1016/j.epsr.2009.10.035
Asiaban, S., Kayedpour, N., Samani, A. E., Bozalakov, D., De Kooning, J. D. M., Crevecoeur, G., et al. (2021). Wind and solar intermittency and the associated integration challenges: A comprehensive review including the status in the Belgian power system. Energies 14, 2630. doi:10.3390/en14092630
Biswas, P. P., Suganthan, P. N., Qu, B. Y., and Amaratunga, G. A. J. (2018). Multiobjective economic-environmental power dispatch with stochastic wind-solar-small hydro power. Energy 150, 1039–1057. doi:10.1016/j.energy.2018.03.002
Chen, S., Fang, G., Huang, X., and Yan, M. (2019). A joint optimal dispatching method of wind-solar-hydro generation system. IOP Conf. Ser. Earth Environ. Sci. 227, 032004. doi:10.1088/1755-1315/227/3/032004
Cheng, C., Yan, L., Mirchi, A., and Madani, K. (2017). China’s booming hydropower: Systems modeling challenges and opportunities. J. Water Resour. Plann. Manage. 143, 02516002. doi:10.1061/(ASCE)WR.1943-5452.0000723
De Santis, M., Eichfelder, G., and Patria, D. (2022). On the exactness of the ε-constraint method for biobjective nonlinear integer programming. Operations Res. Lett. 50, 356–361. doi:10.1016/j.orl.2022.04.007
Department of Resource Conservation and Environmental Protection, (2021). Action plan for carbon dioxide peaking before 2030. Available at: https://en.ndrc.gov.cn/policies/202110/t20211027_1301020.html.
Ding, M., Xu, Z., Wang, W., Wang, X., Song, Y., and Chen, D. (2016). A review on China׳s large-scale PV integration: Progress, challenges and recommendations. Renew. Sustain. Energy Rev. 53, 639–652. doi:10.1016/j.rser.2015.09.009
Fathipour, F., and Saidi-Mehrabad, M. (2018). A multi-objective energy planning considering sustainable development by a TOPSIS-based augmented e-constraint. J. Renew. Sustain. Energy 10, 034901. doi:10.1063/1.5008545
Gholami, M., Fathi, S. H., Milimonfared, J., Chen, Z., and Deng, F. “The effect of turbulence and wake on the power fluctuation in the wind farms,” in 2017 Iranian Conference on Electrical Engineering (ICEE), Tehran, Iran, March, 2017 (IEEE), 1148–1153. doi:10.1109/IranianCEE.2017.7985214
Halleraker, J. H., Kenawi, M. S., L’Abée-Lund, J. H., Bakken, T. H., and Alfredsen, K. (2022). Assessment of flow ramping in water bodies impacted by hydropower operation in Norway – is hydropower with environmental restrictions more sustainable? Sci. Total Environ. 832, 154776. doi:10.1016/j.scitotenv.2022.154776
Hu, W., Wang, Y., Sun, Y., Nie, Q., Ding, R., and Zhang, X. “Research on comprehensive complementary characteristics evaluation technology of wind-solar-hydro combined power generation system,” in 2021 International Conference on Power System Technology (POWERCON), Haikou, China, September, 2021 (IEEE), 1017–1022. doi:10.1109/POWERCON53785.2021.9697711
Jabir, M., Azil Illias, H., Raza, S., and Mokhlis, H. (2017). Intermittent smoothing approaches for wind power output: A review. Energies 10, 1572. doi:10.3390/en10101572
Jian, Z., Shiqiang, Z., and Xizhang, C. (2012). Impact upon navigation conditions of river reach between the two dams by peak shaving at three gorges hydropower station. Procedia Eng. 28, 152–160. doi:10.1016/j.proeng.2012.01.698
Jin, X., Liu, B., Liao, S., Cheng, C., Li, G., and Liu, L. (2022). Impacts of different wind and solar power penetrations on cascade hydroplants operation. Renew. Energy 182, 227–244. doi:10.1016/j.renene.2021.10.022
Li, F.-F., Wang, H.-R., Wu, Z.-G., and Qiu, J. (2020). Maximizing both the firm power and power generation of hydropower station considering the ecological requirement in fish spawning season. Energy Strategy Rev. 30, 100496. doi:10.1016/j.esr.2020.100496
Li, H., Gao, H., Zhang, Y., and Ai, X. (2018). Expansion planning of large scale hybrid wind\-photovoltaic transmission network considering correlation. Power Syst. Technol. 42, 2120–2127. doi:10.13335/j.1000-3673.pst.2018.0144
Lingfors, D., and Widén, J. (2016). Development and validation of a wide-area model of hourly aggregate solar power generation. Energy 102, 559–566. doi:10.1016/j.energy.2016.02.085
Liu, B., Lund, J. R., Liao, S., Jin, X., Liu, L., and Cheng, C. (2020). Optimal power peak shaving using hydropower to complement wind and solar power uncertainty. Energy Convers. Manag. 209, 112628. doi:10.1016/j.enconman.2020.112628
Liu, J., Shen, W., Yang, H., Su, K., and Zhou, H. “Operation strategy of a combined system consists of multi-type hydropower and wind-solar,” in 2019 IEEE 3rd Conference on Energy Internet and Energy System Integration (EI2), Changsha, China, November, 2019a (IEEE), 369–374. doi:10.1109/EI247390.2019.9062166
Liu, S., Levine, J. A., Bremer, P., and Pascucci, V. (2012). “Gaussian mixture model based volume visualization,” in IEEE symposium on large data analysis and visualization (LDAV) (Seattle, WA: IEEE), 196, 73–77. doi:10.1109/LDAV.2012.6378978
Liu, W., Zhu, F., Chen, J., Wang, H., Xu, B., Song, P., et al. (2019b). Multi-objective optimization scheduling of wind–photovoltaic–hydropower systems considering riverine ecosystem. Energy Convers. Manag. 196, 32–43. doi:10.1016/j.enconman.2019.05.104
Luo, G., Dan, E., Zhang, X., and Guo, Y. (2018). Why the wind curtailment of northwest China remains high. Sustainability 10, 570. doi:10.3390/su10020570
Mavrotas, G. (2009). Effective implementation of the ε-constraint method in multi-objective mathematical programming problems. Appl. Math. Comput. 213, 455–465. doi:10.1016/j.amc.2009.03.037
Mihai, M., and Westermann, R. (2014). Visualizing the stability of critical points in uncertain scalar fields. Computers & Graphics 41, 13–25. doi:10.1016/j.cag.2014.01.007
Ming, B., Liu, P., Guo, S., Cheng, L., and Zhang, J. (2019). Hydropower reservoir reoperation to adapt to large-scale photovoltaic power generation. Energy 179, 268–279. doi:10.1016/j.energy.2019.04.209
Niu, W., Shen, J., Cheng, C., Wu, X., Feng, Z., and Guo, Y. (2016). A hybrid search method for multi-objective optimization operations of cascaded hydropower plants with peak load regulation and navigation demands. Proc. Chin. Soc. Electr. Eng. 36, 2331–2341. doi:10.13334/j.0258-8013.pcsee.2016.09.003
Pérez-Díaz, J. I., and Wilhelmi, J. R. (2010). Assessment of the economic impact of environmental constraints on short-term hydropower plant operation. Energy Policy 38, 7960–7970. doi:10.1016/j.enpol.2010.09.020
Pöthkow, K., and Hege, H.-C. (2023). Nonparametric models for uncertainty visualization. Computer Graphics Forum 32, 131–140. doi:10.1111/cgf.12100
Potter, K., Wilson, A., Bremer, P.-T., Williams, D., Doutriaux, C., Pas, V., et al. (2009). Ensemble-vis: a framework for the statistical visualization of ensemble data," in. 2009 IEEE international conference on data mining workshops (Miami, FL: IEEE), 233–240. doi:10.1109/ICDMW.2009.55
Shang, Y., Li, X., Gao, X., Guo, Y., Ye, Y., and Shang, L. (2017). Influence of daily regulation of a reservoir on downstream navigation. J. Hydrol. Eng. 22, 05017010. doi:10.1061/(ASCE)HE.1943-5584.0001522
Shen, J., Chen, G., Wei, W., Cheng, C., and Wang, L. (2021). Short-term optimal scheduling model with multiple peak shaving indexes based on linkage analysis. Journal of Hydraulic Engineering 52, 936–947.
Shivashankar, S., Mekhilef, S., Mokhlis, H., and Karimi, M. (2016). Mitigating methods of power fluctuation of photovoltaic (PV) sources – a review. Renew. Sustain. Energy Rev. 59, 1170–1184. doi:10.1016/j.rser.2016.01.059
Wan, Z., Li, Y., Wang, X., An, J., Dong, B., and Liao, Y. (2020). Influence of unsteady flow induced by a large-scale hydropower station on the water level fluctuation of multi-approach channels: A case study of the three gorges project, China. Water 12, 2922. doi:10.3390/w12102922
Wang, X., Virguez, E., Kern, J., Chen, L., Mei, Y., Patiño-Echeverri, D., et al. (2019a). Integrating wind, photovoltaic, and large hydropower during the reservoir refilling period. Energy Convers. Manag. 198, 111778. doi:10.1016/j.enconman.2019.111778
Wang, X., Virguez, E., Xiao, W., Mei, Y., Patiño-Echeverri, D., and Wang, H. (2019b). Clustering and dispatching hydro, wind, and photovoltaic power resources with multiobjective optimization of power generation fluctuations: A case study in southwestern China. Energy 189, 116250. doi:10.1016/j.energy.2019.116250
Xi’an Jiaotong University, , Wang, J., Wei, J., Xi’an Jiaotong University, , Zhu, Y., Xi’an Jiaotong University, , et al. (2019). The reliability and operation test system of power grid with large-scale renewable integration. CSEE JPES. doi:10.17775/CSEEJPES.2017.01300
Xie, J., Zheng, Y., Pan, X., Zheng, Y., Zhang, L., and Zhan, Y. (2021). A short-term optimal scheduling model for wind-solar-hydro hybrid generation system with cascade hydropower considering regulation reserve and spinning reserve requirements. IEEE Access 9, 10765–10777. doi:10.1109/ACCESS.2021.3049280
Zhang, X., Ma, G., Huang, W., Chen, S., and Zhang, S. (2018). Short-term optimal operation of a wind-PV-hydro complementary installation: Yalong river, sichuan province, China. Energies 11, 868. doi:10.3390/en11040868
Keywords: hydro-wind-solar, generation scheduling, multi-objective, peak shaving, navigation
Citation: Liu B, Peng Z, Liao S, Liu T and Lu J (2023) A multi-objective optimization model for the coordinated operation of hydropower and renewable energy. Front. Energy Res. 11:1193415. doi: 10.3389/fenrg.2023.1193415
Received: 24 March 2023; Accepted: 25 April 2023;
Published: 10 May 2023.
Edited by:
Yongxin Xiong, Aalborg University, DenmarkReviewed by:
Shichang Cui, Huazhong University of Science and Technology, ChinaCopyright © 2023 Liu, Peng, Liao, Liu and Lu. This is an open-access article distributed under the terms of the Creative Commons Attribution License (CC BY). The use, distribution or reproduction in other forums is permitted, provided the original author(s) and the copyright owner(s) are credited and that the original publication in this journal is cited, in accordance with accepted academic practice. No use, distribution or reproduction is permitted which does not comply with these terms.
*Correspondence: Benxi Liu, YmVueGlsaXVAZGx1dC5lZHUuY24=
Disclaimer: All claims expressed in this article are solely those of the authors and do not necessarily represent those of their affiliated organizations, or those of the publisher, the editors and the reviewers. Any product that may be evaluated in this article or claim that may be made by its manufacturer is not guaranteed or endorsed by the publisher.
Research integrity at Frontiers
Learn more about the work of our research integrity team to safeguard the quality of each article we publish.