 Tao Liu
 Zeyun Wu
 Michelle Bensi2
 Zhegang Ma
- 1Department of Mechanical and Nuclear Engineering, Virginia Commonwealth University, Richmond, VA, United States
- 2Department of Civil and Environmental Engineering, University of Maryland, College Park, MD, United States
- 3Idaho National Laboratory, Idaho Falls, ID, United States
Natural hazard-induced nuclear accidents, such as the Fukushima Daiichi Accident that occurred in Japan in 2011, have significantly increased reactor safety studies in understanding nuclear power plant (NPP) responses to external hazard events such as earthquakes and floods. Natural hazards could cause the loss of offsite power in nuclear power plants, potentially leading to a Station Blackout (SBO) accident that significantly contributes to the overall risk of nuclear power plant accidents. Despite the fact that extensive research has been conducted on the station blackout accident for nuclear power plant, further understanding of these events is needed, particularly in the context of the dynamic nature of external hazards such as external flooding. This paper estimates the progression of station blackout events for a generic pressurized water reactor (PWR) in response to external flooding events. The original RELAP5-3D model of the Westinghouse four-loop design pressurized water reactor was adopted and modified to simulate the external flood-induced station blackout accident, including the short-term and long-term station blackout scenarios. A sensitivity analysis of long-term station blackout, examining reactor operation times and analyzing key parameters over time, was also conducted in this work. The results of the analyses, especially the critical timing parameters of key event sequences, provide useful insights about the time during the external flooding event, which is important for plant operators to make timely decisions to prevent potential core damage. This paper represents significant progress toward developing an integrated risk assessment framework for further identifying and assessing the effects of the critical sources of uncertainties of nuclear power plant under external hazard-induced events.
1 Introduction
External hazards such as floods, storms, and hurricanes will generate significant safety and risk concerns to the operation of nuclear power plants (NPPs). The 2011 Fukushima Daiichi Accident increased the focus placed on the safety of NPPs under external hazards. While the potential effects of external hazards may vary by plant, almost all hazards have the potential to cause a loss of offsite power (LOOP) events. In turn, LOOP events could potentially be followed by a station blackout (SBO) if the onsite emergency power sources such as emergency diesel generators fail to supply backup power.
According to the Reactor Safety Study (WASH-1400) (U.S. NRC, 1975), SBO events could significantly contribute to the overall risk of accidents at NPPs. Risk-informed plant models have also demonstrated that SBO can account for up to 70% or more of the total core damage frequency (CDF). Thus, the LOOP frequency, the estimated time required for restoring offsite power, and the reliability of onsite emergency power sources are essential factors that must be considered for conducting plant probabilistic risk assessments (PRA) of a nuclear power plant (Eide et al., 2005). Therefore, there is a need to understand better the SBO accident scenarios caused by external hazards and the risks associated with plant responses during SBO accidents.
The existing literature has extensively studied LOOP and SBO events at NPPs. Refs. (Ma et al., 2019; Ma and Johnson, 2022) provide a history of the associated studies conducted by the United States Nuclear Regulatory Commission (NRC) and its contractor, Idaho National Laboratory (INL). NUREG-1032 (Baranowsky, 1988), published in 1988, provides a detailed evaluation of SBO event sequences and associated plant responses. In a follow-on study, NUREG/CR-6890 (Eide et al., 2005), published in 2005, reevaluated the LOOP events and associated SBO core damage risks for operating NPPs in the United States. Afterwards, updates analyses were performed annually based on the United States operating experience data available when the analyses were conducted (Schroeder, 2015; Bower and Schroeder, 2016; Johnson and Schroeder, 2016; Johnson et al., 2017; Johnson et al., 2018; Johnson and Ma, 2019; Johnson and Ma, 2020; Johnson and Ma, 2021). These annual updates provide the latest results on the LOOP frequency, LOOP recovery time, and other associated analyses for the United States nuclear industry. In addition to these NRC and INL reports, many thermal-hydraulic safety analyses of SBO accidents were conducted using various reactor safety analysis codes. Fletcher et al. (2009) performed thermal-hydraulic evaluations of the extended SBO severe accident sequences in a Westinghouse four-loop PWR using SCDAP/RELAP5 code. Wang (2013) performed the simulation of the Maanshan PWR SBO accident using TRACE code. Ma et al. (2018) and Ma et al. (2020) performed a risk-informed analysis for the enhanced resilient nuclear power plant that included initiatives such as accident-tolerant fuel using the generic PRA and RELAP5-3D model for both PWR and boiling water reactors, respectively. Furthermore, Zubair et al. (2017) presented a simulation of an SBO accident with additional Pilot Operated Relief Valve (PORV) failure for the Advanced Pressurized Water Reactor (APR-1400). The research analyzes various parameters to understand the effects of the PORV failure in the pressurizer during SBO accident. Our previous study (Liu et al., 2021) developed a best estimate plus uncertainty framework using RELAP5-3D for transient safety analysis of the research reactor. In recent years, particularly after the Fukushima accident, using Diverse and Flexible Coping Strategies (FLEX) strategies to mitigate the effects of external hazards has become a new popular research topic in the LOOP and SBO studies (Xu and Zhang, 2022). For instance, Yang et al. (2019) describe the use of TRACE code to simulate the postulated Extended Loss of AC Power accident and assesses the effectiveness of FLEX strategies. Considering the primary study purpose of this paper, the FLEX strategies are not discussed in the present mechanistic model developed under this work.
Despite extensive research on the impact of LOOP and SBO events at NPPs, there is still a need to understand these events further, particularly in the context of external hazards such as external flooding. Current approaches to external flooding risk assessment for NPPs are mainly deterministic. There are limited models and tools to support the probabilistic assessment of external flooding events. Additionally, the conventional event tree and fault tree method in a static PRA may not be sufficient to address these challenges and accurately represent the plant behavior due to the spatially and temporally dynamic nature of the external hazard event.
This paper presents an early-stage research effort to develop an integrated risk assessment framework (Bensi et al., 2022). It focuses on the mechanistic model development for estimating the NPP system’s event progressions in response to external flooding events. This work is an indispensable step towards the integrated risk assessment framework development and can provide valuable insights into the behavior of NPPs under external hazard conditions. In this paper, we employed the reactor safety analysis code RELAP5-3D (The RELAP5-3D Code Development Team, 2015) to perform a series of thermal-hydraulic evaluations and safety studies of external hazard-induced SBO scenarios for a generic Westinghouse Four-loop design PWR. To differentiate our work from other studies mentioned above, this paper aims for multiple objectives as follows by carrying out safety and sensitivity studies. The first objective is to realize a computational model to simulate the behavior of the plant during the external hazard-induced SBO accident. The predicted performance of the plant will be verified with existing results in the literature. Secondly, the computational model can complement the static PRA model to improve the analysis of external flooding events. For example, it will be utilized to assess the significance of specific components, such as the turbine-driven pump of the auxiliary feedwater pump (TDAFWP), which are critical for SBO scenarios. Some important timing parameters, such as the time at which steam generator dryout occurs and core uncovery and potential damage time, will be predicted and discussed. Additionally, a sensitivity study will be carried out to examine the impact of the reactor’s operating time on the SBO scenario. Moreover, the simulation results offer valuable insights into the significance of flooding assumptions and the consequences of external flooding events on NPPs. This enables operators to evaluate and prioritize mitigation strategies to reduce the risks associated with external flooding events. This work is an essential step towards the integrated risk assessment framework development and can provide valuable insights into the behavior of NPPs under external hazard conditions.
For demonstration, a generic PWR model of a Westinghouse-design four-loop PWR was employed in this study. The original RELAP5-3D model, which was developed mainly for the loss of coolant accident (LOCA), was modified and customized to simulate the SBO accident. To verify the results by the modified RELAP5-3D model, the steady-state behaviors of the generic PWR model were established, and key performance parameters yielded by the model were compared to the values obtained from a final safety analysis report (FSAR) of a PWR plant. The simulation started with the LOOP to the generic PWR that eventually initiated short-term SBO (STSBO) and long-term SBO (LTSBO) scenarios. We then examined the responses of various thermal-hydraulic performance parameters. For both STSBO and LTSBO, the main feedwater (MFW) system and emergency core cooling systems (ECCS) are unavailable due to the loss of onsite and offsite alternating current (AC) power. The notable difference between those two scenarios is that during STSBO, the turbine-driven auxiliary feedwater pump (TDAFWP) fails at the beginning of the accident. In contrast, for LTSBO, the TDAFWP is assumed to be working to provide feedwater to cool the reactor core until the batteries fully deplete. To better understand this situation with different external intervening parameters, a sensitivity study of the LTSBO with respect to reactor operation time is also performed in this study. The results of these analyses will further demonstrate the effectiveness of the safety analysis code RELAP5-3D for analyzing the SBO accidents until the start of core damage. Additionally, the important timing parameters of key event sequences predicted by RELAP5-3D will offer plant operators insights regarding the time to restore emergency AC power (diesel generator) or TDAFW pump to prevent potential core damage. These information will also be helpful for risk-informed decision-making processes (Bensi et al., 2022).
The rest of the paper will be organized as follows: Section 2 describes the generic PWR model, the original RELAP5-3D input, and the implemented modifications. Section 3 gives a brief introduction to both LTSBO and STSBO scenarios. Section 4 details the simulation procedures for both SBO scenarios using RELAP5-3D. The simulation results are also presented in this section. Section 5 summarizes the sensitivity study of the LTSBO with respect to the reactor operation time and discusses the meaningful impact of the sensitivity study. Section 6 offers some concluding remarks on the current study as well as some perspectives on future studies.
2 Computational models
This section provides an overview of the selected generic PWR model and the original RELAP5-3D input deck. It summarizes the implemented modifications of the original RELAP5-3D model to make it suitable for the simulation and analysis of SBO scenarios in our research.
2.1 Generic PWR model overview
The generic PWR model employed in this study was based on Zion Unit 1 nuclear power plant (The RELAP5-3D Code Development Team, 1990), which is located in Zion, Illinois. It is a typical Westinghouse-design four-loop PWR with a rated thermal power of 3,250 MWth. This plant was selected for our study as it is a representative four-loop PWR plant. The schematic of this four-loop PWR is shown in Figure 1. Since it’s hard to get detailed plant data for the Zion plant, the main design parameters of the plant, which are summarized in Table 1, were mainly obtained from the FSAR of the reactor (Commonwealth Edison Company, 1993). Similar conditions were employed in the RELAP5-3D model as the ones shown in the FSAR, simply for the model verification and benchmarking purposes for steady-state calculations, which are at full power operating conditions. The reason for using these comparable steady-state conditions was to ensure the accuracy and quality of our model by verifying its performance against the information provided in the FSAR report.
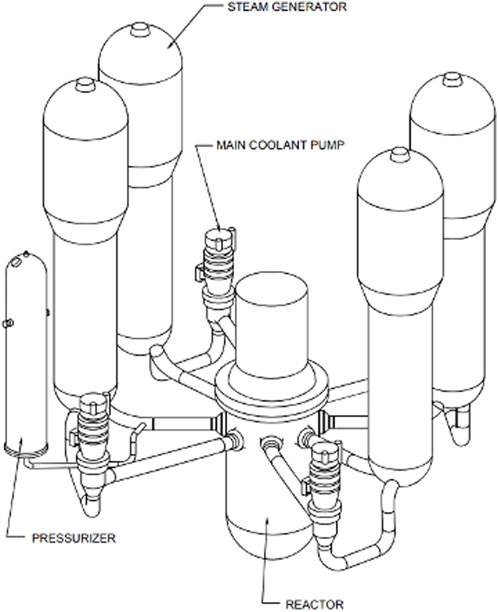
FIGURE 1. Schematic of a typical Westinghouse four-loop PWR (U.S. NRC, 2015).
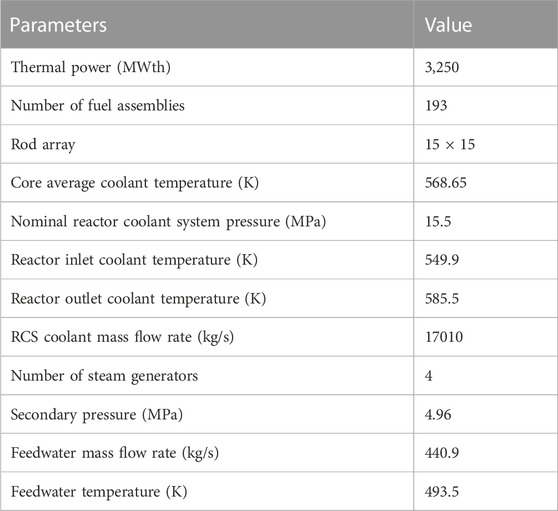
TABLE 1. Main parameters for the Zion Unit 1 plant (Commonwealth Edison Company, 1993).
2.2 Original RELAP5-3D model
In this study, the computational thermal-hydraulic analysis was performed using RELAP5-3D, a state-of-the-art best estimate system-level thermal-hydraulic code developed by the INL. The original RELAP5-3D input deck of the Zion Unit 1 plant (hereinafter referred to as the “generic PWR model”) that was included in the RELAP5-3D installation package has been adapted as a starting point for our study. Some important plant data has been removed or modified for proprietary reasons. This model was originally developed by the INL for simulating a cold leg small break LOCA (The RELAP5-3D Code Development Team, 1990).
Figure 2 depicts the nodalization diagram of the generic PWR RELAP5-3D model. This model represents the PWR using two primary coolant loops, a single coolant loop (right side of Figure 2) with a modeled small break in the cold leg, and a triple coolant loop (left side of Figure 2) representing the other three intact coolant loops. Each primary loop contains hot leg piping, cold leg piping, a U-tube type steam generator (SG), and a reactor coolant pump (RCP). The pressurizer (PZR) is connected to the hot leg of one primary coolant loop. In total, this original RELAP5-3D model consists of 139 control volumes, 142 junctions, and 83 heat structures.
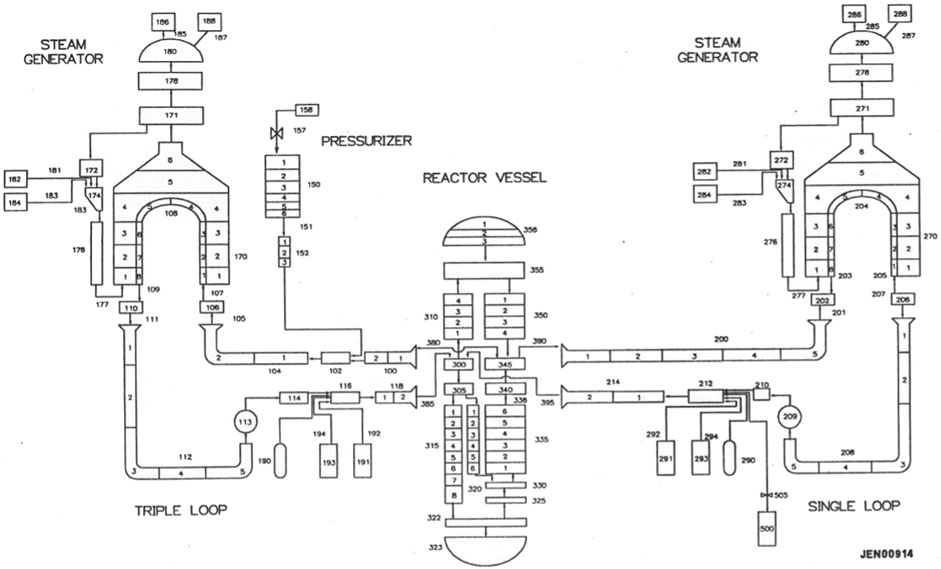
FIGURE 2. Nodalization for the Generic PWR RELAP5-3D model (The RELAP5-3D Code Development Team, 1990).
The major systems and components included in this generic PWR model are summarized as follows:
• Reactor pressure vessel (RPV).
• Reactor coolant system (RCS).
• PZR and power-operated relief valves (PORVs).
• SG and PORVs.
• MFW system.
• Auxiliary feedwater (AFW) system.
• Main steam (MS) system and main steam isolation valves (MSIVs).
• ECCS including a high-pressure safety injection (HPSI) system, a low-pressure safety injection (LPSI) system, and accumulators.
Apart from the systems and components, some control variables and general tables are also implemented in the model to simulate the control systems such as SG water level control system, PZR pressure control and level control system.
2.3 RELAP5-3D model modifications
As mentioned earlier, the original PWR model was developed by INL primarily for modeling and simulation of a cold leg small break LOCA. The availability of dedicated documentation on the model is limited. In order to improve the reliability of the RELAP-3D-based PWR model and particularly to make the model suitable for the simulation and analysis of SBO scenarios, some modifications have been made to the original RELAP5-3D model.
The first modification is the removal of the input cards that were used to simulate the small break LOCA. In the original input deck, the break was accomplished by a trip valve connecting the cold leg and containment atmosphere. It was set to open by a trip statement to initiate the LOCA transient. To avoid adverse effects of this condition on the SBO scenario simulation and analysis, the trip valve component cards and associated trip logic cards in the original input deck were identified and removed. The second modification involves the extension of the AFW system. The AFW system is normally used to maintain a heat sink by supplying feedwater to the steam generators in the case of loss of MFW, reactor trip and LOOP, and a small break LOCA. It is typically composed of two motor-driven AFW pump (MDAFWP) trains and one TDAFWP train. In the original input deck, only the MDAFWP train was modeled in the AFW system, which is reasonable for the original model as LOOP was not considered in the previous study, and the MDAFWP train is sufficient to provide feedwater. However, for SBO simulation, the MDAFWP would stop working due to the complete loss of onsite and offsite AC power, which means the TDAFWP train would be needed to supply feedwater for removing the decay heat from the primary loop until station batteries deplete. With the extension of the AFW system, the impact of the TDAFWP in preventing the core uncover and potential core damage during SBO accidents was analyzed. Moreover, the SBO-related trip logic cards were added, and some control system cards were defined and added to compute additional desired quantities in this SBO study.
To verify the prediction capability of the modified RELAP5-3D model, the steady-state operation conditions of the generic PWR were established with the model. The notable performance parameters of the reactor were compared to the values obtained from the FSAR of the Zion Unit 1 reactor. Furthermore, the short-term SBO simulations were performed using the modified RELAP5-3D model. The results obtained were compared with a reference study to ensure the model could estimate the STSBO behavior correctly. These results are discussed in Section 4 of the paper.
3 Overview of SBO scenario
The station blackout (i.e., SBO) in a nuclear power plant, as defined by the Code of Federal Regulations, Title 10, Part 50, Section 2 (10 CFR 50.2), means the total loss of AC electricity to both essential and nonessential switchgear buses at the plant. This indicates both the offsite electric power system and the onsite emergency AC power sources are unavailable during SBO. However, an SBO does not include the loss of AC power to buses that are powered by station batteries or alternate AC sources that are used for mitigation (U.S. NRC, 1988). As a result, many safety systems that are necessary for removing decay heat from the reactor may not be available in an SBO accident, which potentially leads to a core damage accident.
For NPPs, the SBO scenarios are usually initiated by a LOOP condition and the reactor scram associated with it. This is followed by the failure of the emergency diesel generators (or gas turbines, if applicable) to start and load. The LOOP accident could be initiated by external events such as earthquakes, tornadoes, high winds, external flooding, etc., or by internal events in which a grid voltage or frequency disturbance is generated to upset the grid.
SBO sequences are further classified into LTSBO and STSBO (Eide et al., 2005):
• For the LTSBO in a PWR, the ECCS, including the high and LPSI systems, are lost due to the loss of onsite and offsite AC power. The MFW pumps stop working as well as the MDAFWPs. At the same time, the TDAFWP is available to supply water to the SG secondary side for removing the decay heat from RCS until the batteries are depleted.
• For the STSBO in a PWR, the ECCS is lost, and the TDAFWP fails to start or run at the beginning of the accident. In this case, the loss of an adequate heat sink for the transport of decay heat loads from RCS causes the reactor coolant systems to boil off, and therefore core damage occurs earlier.
Based on the insights from a probabilistic risk assessment that has been performed (U.S. NRC, 2012), the LTSBO contributes to CDF with an estimated frequency of 1 × 10⁻⁵ to 2 × 10⁻⁵ per reactor year, while STSBO has a lower estimated frequency of 1 × 10⁻⁶ to 2 × 10⁻⁶ per reactor year.
4 SBO analysis and results
The steady-state and SBO transient simulations were performed using the modified RELAP5-3D model described in Section 2. The steady-state reactor operation conditions were used as initial conditions for SBO scenarios. For the purpose of model verifications, the steady-state performance parameters of the reactor were compared to the values obtained from the FSAR of the Zion Unit 1 reactor. An overall good agreement was achieved. The analysis effort was followed by simulations of the STSBO and LTSBO scenarios for the generic PWR-based modified RELAP5-3D model. The obtained results of the STSBO simulations were compared to the ones presented in one reference study (Xia and Zhang, 2012) to ensure that the model could predict the SBO behavior correctly, which partially warranted the LTSBO simulation in the continuous analysis efforts. The event sequence assumptions and detailed analysis results for the SBO scenarios are discussed in this section.
4.1 Steady-state calculation
The steady-state calculation results obtained from RELAP5-3D are compared with the Zion nuclear power plant’s full power operation conditions from its FSAR. The quantitative comparison of the main parameters is summarized in Table 2. The deviation for most of the steady-state parameters obtained by RELAP5-3D and from the parameters presented in the FSAR is less than one percent. This indicates that the results calculated by RELAP5-3D are in good agreement with the plant values during full-power operation. The achieved steady-state conditions will be used as the initial conditions for the later SBO scenario simulations.
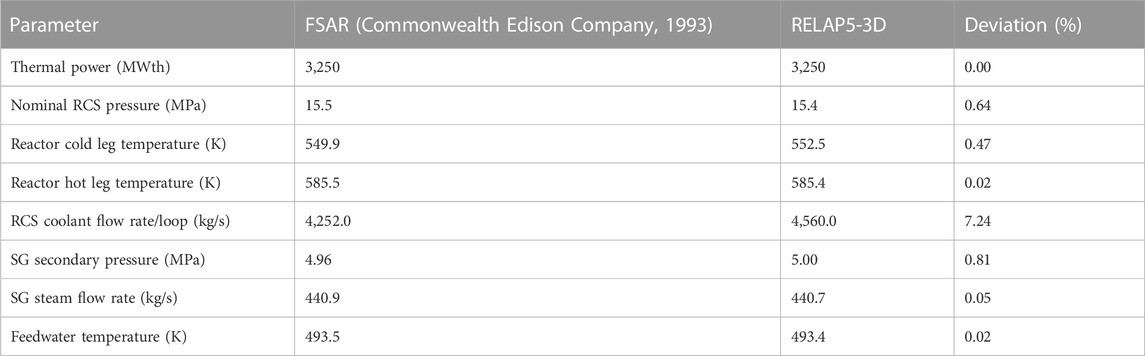
TABLE 2. Comparison of operation conditions at steady-state for Zion power plant.
4.2 Short-term SBO
The STSBO event sequence in this study was assumed to begin with external flooding caused by heavy rainfall and the overtopping of nearby river dikes. The floodwaters would breach the perimeter and inundate the plant site, despite the activation of flood protection measures, including sandbags, temporary barriers, and pumps. As a result of the flooding, offsite power is lost when the floodwaters inundate the electrical switchyard. The onsite emergency diesel generators (EDGs) located in the EDG building are intended to provide backup power in the event of a LOOP. However, the EDGs would fail due to flooding in the EDG building, leading to a Station Blackout. Additionally, the TDAFWP would also fail due to flooding damage caused by floodwaters entering the turbine building.
To simulate the STSBO scenario, the reactor is assumed to be at full power operation at the beginning of the scenario. The accident is assumed to take place at 100 s elapsed into the event. The accident is initiated by a LOOP concurrent with the failure of onsite emergency AC power systems. The LOOP event will result in an automatic turbine trip signal and reactor scram signal. Then the control rods are assumed to be inserted immediately for the reactor trip (SCRAM). The ANS 79-1 decay heat curve (The RELAP5-3D Code Development Team, 2015) is employed in the generic PWR model to describe the rate at which decay heat decreases over time after the reactor has been shut down. The reactor coolant pumps coast down due to the loss of AC power. The MSIVs automatically close to isolate the secondary steam flow. The MFW pumps trip and the MDAFWPs fail to start due to loss of AC power. The TDAFWP is assumed to fail at the beginning of the accident due to flooding damage.
To better illustrate the behavior of the generic PWR model in STSBO scenarios, we presented the response of several key thermal-hydraulic parameters as functions of time in the following paragraphs. The RCS flow rate and pressure, SG water level and pressure, and the average temperature of coolant are the main parameters considered in the STSBO study. The STSBO results for the generic PWR obtained from RELAP5-3D are compared with the results presented in Ref. (Xia and Zhang, 2012) to ensure that the model could represent the behavior correctly during the STSBO accident. Those comparisons of the selected parameters of interest are shown in Figure 3.
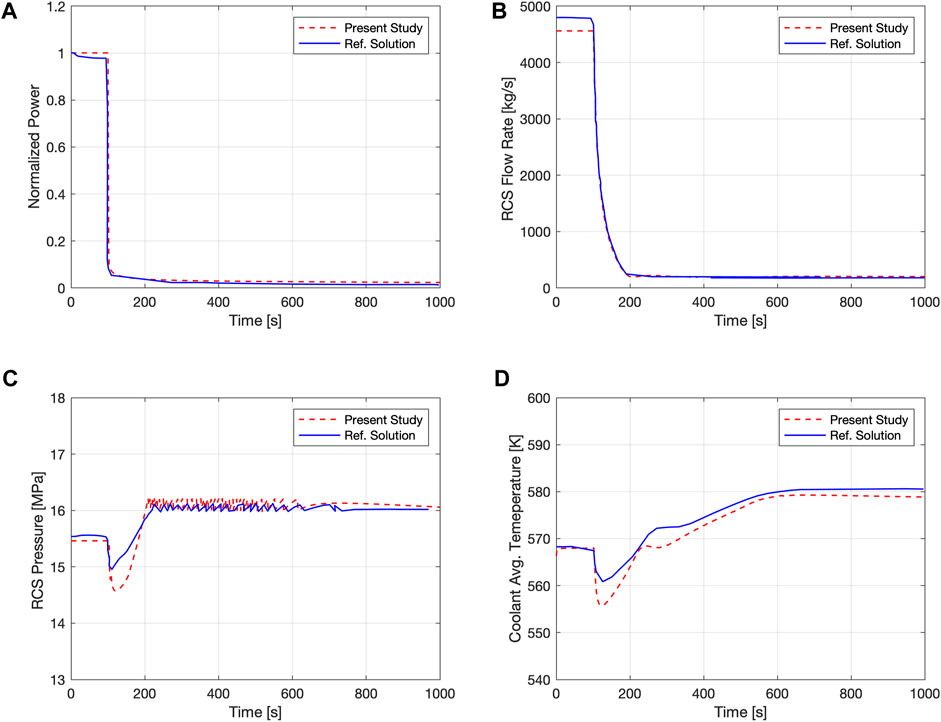
FIGURE 3. (A) Normalized reactor power, (B) RCS flow rate, (C) RCS pressure, and (D) reactor coolant average temperature during STSBO.
Figure 3A shows that the normalized reactor power was reduced to the decay heat power level rapidly following the reactor shutdown during the STSBO. Figure 3B indicates the corresponding RCS flow rate response gradually decreases due to the RCPs coast-down and stops at t = 204 s when natural circulation is established to remove the decay heat. Figure 3C shows the RCS pressure transient behavior. The pressure initially decreases sharply from the nominal value to 14.8 MPa in response to the reactor trip. It increases again due to insufficient heat removal and decay heat accumulation in the core. The pressure later oscillates near 16.1 MPa because of the frequent opening and closing of PORVs and stabilizes toward the end of the simulation. Figure 3D shows the RCS average temperature behavior in the transient, which exhibits a similar trend as the RCS pressure. The temperature starts with a sharp fall down due to the reactor scram, followed by a steady rise resulting from the coast-down of pumps and decay heat accumulation in the reactor core.
Figures 4A, B show the SG level and pressure, respectively. As there is no feedwater provided by the MFW system or AFW system, the water level of SG drops from 12 to 8 m quickly and continues to decline because the water on the secondary side is boiled off, and steam is released from the SG PORVs. Due to the isolation of the MS line and the failed supply of feedwater, the heat starts accumulating in the SG secondary side, and the pressure rapidly increases to the set point of the SG safety relief valve and stabilizes until the end.
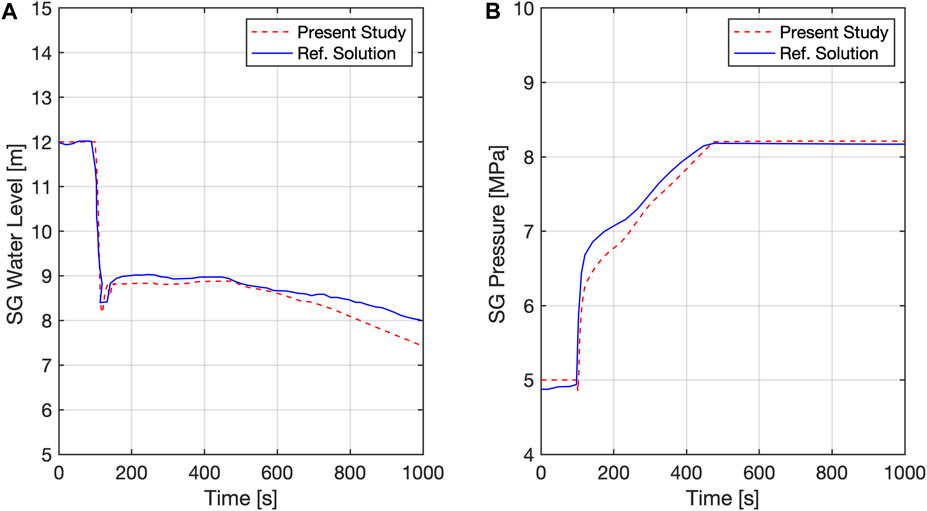
FIGURE 4. (A) SG water level and (B) SG pressure during STSBO.
As can be seen from the above results for the STSBO scenarios, the results produced by the RELAP5-3D code have a generally good agreement with the ones presented in Ref. (Xia and Zhang, 2012). It should be noted that apart from the results presented, the other two important quantities that need to be investigated in the STSBO scenario are 1) the timing parameters of the occurrence of SG secondary dryout and 2) the time at which reactor core uncovery begins. Both times will provide valuable information for the plant operator to perform corrective action in time to prevent and mitigate the core damage. However, the above bench-marking simulations only last for 1,000 s, which is insufficient to explore these two issues. As a result, more extended period simulations are performed to investigate the timing of SG dryout and core uncovery.
Figures 5A, B show the SG and collapsed core levels in the STSBO with longer simulation times, respectively. The collapsed core level is commonly used to indicate the core’s uncovery condition during accidents. Since no feedwater is provided from the MFW or AFW system, the water on the secondary side is boiled off, and steam is released from the SG PORVs. The water level of SG drops from 12 to 8 m quickly and continues to decline until dryout at 4,080 s. After losing the heat sink, due to the decay heat accumulation, the pressure and temperature in RCS increase rapidly, the core uncovery begins at 5,200 s, and the core is fully uncovered at 8,000 s. Additionally, the important timing parameters of these key event sequences predicted by RELAP5-3D provide plant operators with insights regarding the time to restore emergency alternating current power or turbine-driven auxiliary feedwater pump to prevent potential core damage.
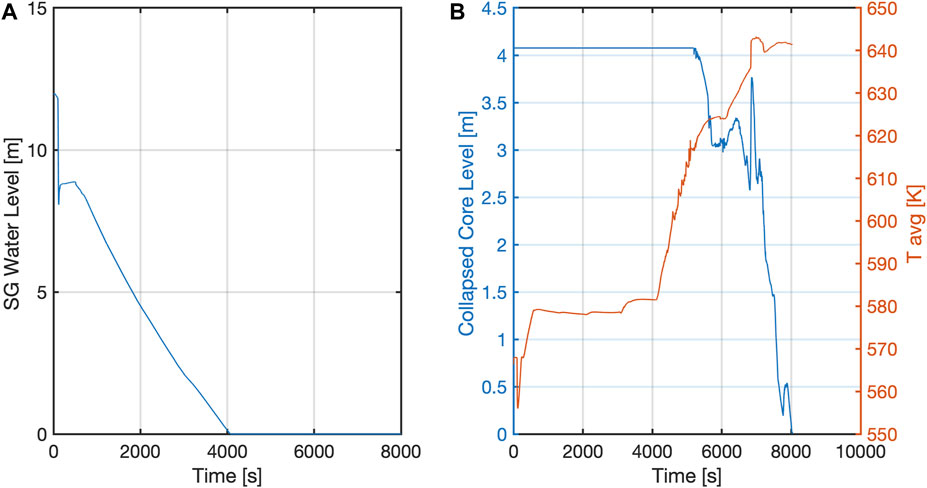
FIGURE 5. (A) SG water level, (B) collapsed core level and the corresponding coolant average temperature (T avg) during STSBO with a longer simulation time.
4.3 Long-term SBO
Both the STSBO and LTSBO scenarios involve the loss of both offsite and onsite power due to external flooding. However, certain key factors differentiate the two scenarios and must be treated distinctly while the accident progresses. The duration and height of the external flood, the efficacy of flood protection measures, and the vulnerability of essential risk-significant components are all crucial factors in this regard. One such significant difference considered in this study is the availability and failure time of the TDAFWP during an external flooding event. In the STSBO scenario, the TDAFWP fails due to flooding damage resulting from floodwaters entering the turbine building. In contrast, the LTSBO scenario assumes that the turbine building has adequate flood protection or lower flood heights, which prevent flooding of the TDAFWP and allow it to continue operating to provide feedwater for core cooling. As a result, the TDAFWP is assumed to be available to provide feedwater for cooling the reactor core until the batteries deplete. In general, station batteries typically last for approximately 2–8 h under normal loading conditions, depending on the batteries’ life cycle (U.S. NRC, 2012).
Similar to the STSBO scenario simulation, the reactor is assumed to be in full power operation at the beginning of the simulation, and the LTSBO accident is assumed to occur with 100 s elapsed into the event. LOOP and the failure of the onsite emergency AC power systems initiate the accident. Then the control rods are assumed to be inserted immediately following the reactor trip, and the ANS 79-1 decay heat curve is employed in the generic PWR model. The reactor coolant pumps coast down due to the loss of AC power. The MSIVs are closed to isolate the secondary steam flow. The MFW pumps trip, and the MDAFWPs fail to start due to loss of AC power. The TDAFW pump automatically starts 14 s later in response to the trip of the MFW system, and it will provide feedwater to SG to ensure the adequate heat sink is established to transport the decay heat loads until the battery exhaustion. The battery life is assumed to be 4 h in the LTSBO study.
To better demonstrate the behavior of the generic PWR model during LTSBO scenarios, the response of several key thermal-hydraulic parameters as functions of time are presented time in the following paragraphs. The RCS pressure, SG water level, pressurizer level, average temperature of the coolant, the collapsed core level, and the peak clad temperature are the main parameters analyzed in this LTSBO study. Those LTSBO results are compared with the STSBO results discussed in the previous section. Those comparisons of the selected parameters of interest are shown in Figures 6, 7.
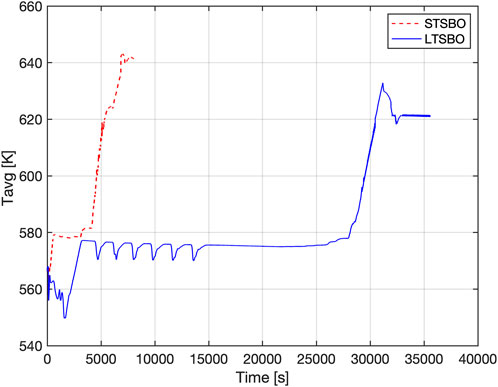
FIGURE 6. Reactor coolant average temperature during STSBO and LTSBO.
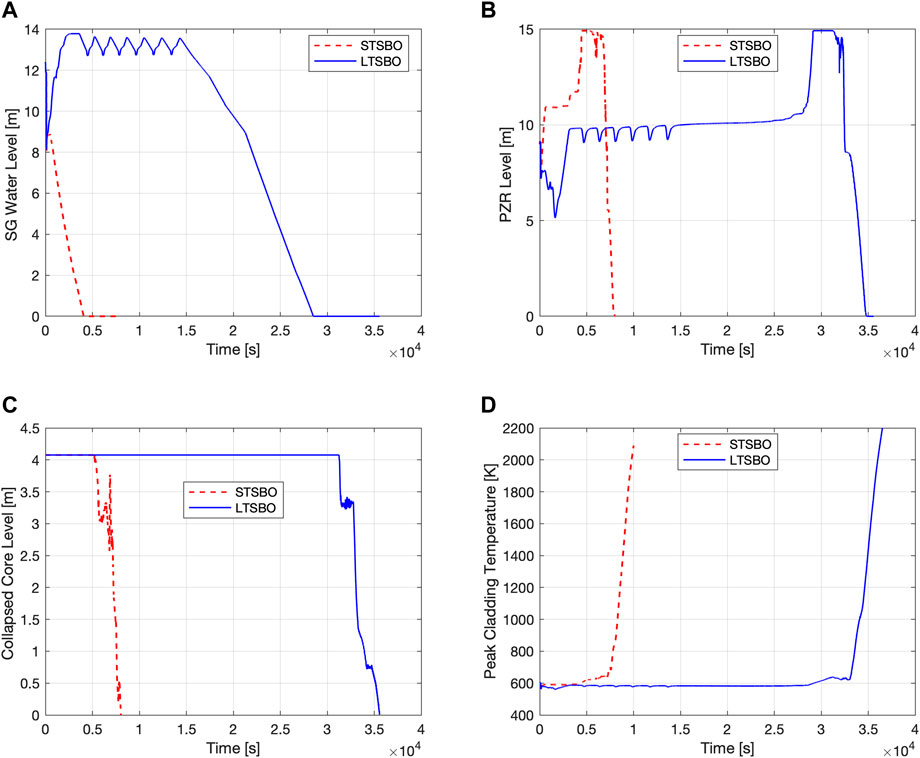
FIGURE 7. (A) SG water level, (B) pressurizer level, (C) collapsed core level, and (D) peak cladding temperature during STSBO and LTSBO.
In Figure 6, the average temperature of reactor coolant initially decreases following the reactor shutdown at t = 100 s, then starts to increase at t = 970 s due to the coast-down of pumps and accumulation of decay heat in the reactor core. This behavior is distinct from that of STSBO because the TDAFW pump is available to supply feed water to the SG for the first 4 h in the LTSBO case, which indicates an adequate heat sink is maintained during this period. The simulation shows that the coolant temperature experiences some fluctuations due to frequent opening and closing of the relief valves and then stabilizes at 575 K until 28,500 s. After the loss of the heat sink, the RCS temperature increases rapidly due to decay heat accumulation.
For the STSBO scenario, as there is no feedwater provided from the MFW system or AFW system, the water on the secondary side is boiled off, and steam is released from the SG PORVs. The water level of SG drops quickly and declines until dryout at 4,080 s, as shown in Figure 7A. For the LTSBO scenario, with the TDAFW pump working to provide feed water to the SG for the first 4 h, the SG water level fluctuates as shown in Figure 7A. During this time, the decay heat is successfully removed from the RCS to the secondary side. After the batteries are depleted at 4 h, the TDAFW pump stops. There is no water supply to the SG’s secondary side, and the water on the secondary side is boiled off. Steam is released from the SG PORVs hence the water level of the steam generator drops and continues to decline until dry out at t = 28,500 s. The loss of the heat sink results in the reduction of heat transfer and accumulation of decay heat in the RCS. Then the temperature increases, as shown in Figure 6; the rise in temperature causes the RCS water to expand, and the water level in the pressurizer reaches the maximum. Later, the coolant is discharged through the pressurizer relief valves, as shown in Figure 7B. Due to core boiling and loss of reactor coolant through the pressurizer relief valve, the pressurizer empties by t = 34,796 s, the reactor core level drops continually, and the core is fully uncovered at 35,564 s as shown in Figure 7C. As the drop of reactor core level, the cladding temperature increases and reaches 1,477 K (maximum cladding temperature safety limit) at 35,064 s.
By comparing the selected performance parameters of interest shown in Figures 6, 7, it is observed the two SBO scenarios demonstrate a similar trend. The main difference between those two scenarios is the timing of the occurrence of key event sequences. The quantitative comparison of the event sequences for both STSBO and LTSBO transients is summarized in Table 3. The results show that core damage, defined in this study as the point at which the peak cladding temperature reaches the safety limit of 1,477 K, occurs around 2.5 h after the initiation of the SBO transient during STSBO. For the LTSBO accident, the TDAFWP is assumed to be available to provide feedwater to cool the reactor core during the first 4 h after reactor shutdown, which causes the core damage occurs around 7.2 h later than in the STSBO transients. In general, the significance of specific components, such as the TDAFWP, which are critical for an external flooding event, was assessed for two different SBO scenarios induced by external flooding. The simulation results provide insights into the significance of flood assumptions and the consequences of external flooding events on NPPs. This enables operators to evaluate and prioritize mitigation strategies to reduce the risks associated with external flooding events. This is an essential step towards developing an integrated risk assessment framework for better identifying and assessing the effects of the critical sources of uncertainties of NPPs under external hazard-induced events.
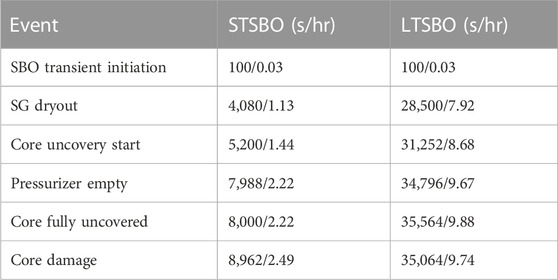
TABLE 3. Comparison of event sequence for STSBO and LTSBO.
5 SBO sensitivity to reactor operation time
To better understand this SBO scenario with different external intervening parameters, a sensitivity study of the LTSBO with respect to reactor operation time is also performed in this study. The responses of various thermal-hydraulic parameters of interest as functions of time during long-term SBO scenarios are monitored in the study.
The decay power ratio generated by the fission product decay in the fuel assembly at any time after reactor shutdown can be approximately determined by using the Wigner-Way formula (Todreas and Kazimi, 2012).
where
Figure 8 shows the decay power ratio after reactor shutdown with various operation times predicted by the Wigner-Way formula. As shown in Figure 9, the longer the reactor operated before the shutdown, the more decay power was generated. For the different operation times, the difference between values of the decay power ratios is larger with longer periods of time after shutdown; however, as the time after shutdown increases, the magnitude of the decay power ratio is relatively low in all cases.
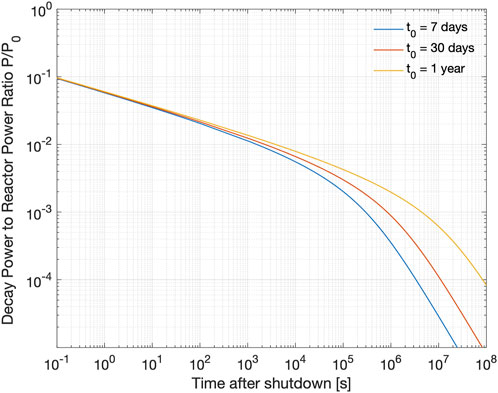
FIGURE 8. Fractional decay power with various operation times.
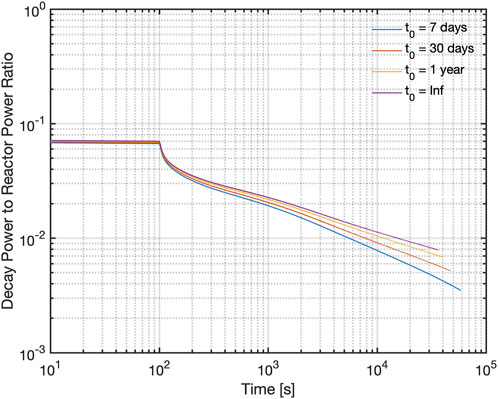
FIGURE 9. Fractional decay power with various operation times during LTSBO.
In this section, to better understand the difference in generic PWR behavior due to various operation times before the shutdown, the response of different thermal-hydraulic parameters of interest as functions of time during long-term SBO scenarios are analyzed.
The operation time of 1 week, 1 month, 1 year, and infinite time [1,350 effective full power days (Todreas and Kazimi, 2012), which was used to generate the results described in Section 4] were considered in this study. The fractional decay power, SG water level, pressurizer level, collapsed core level, and peak clad temperature are the main parameters analyzed.
By comparing the selected variables of interest shown in Figures 9, 10, it is noted that those variables with various operation times during LTSBO scenarios show a similar trend. The main difference between those scenarios is the timing of the occurrence of key event sequences, for example, the timing of the pressurizer dry out, the steam generator secondary dryout, the beginning of reactor core uncover and the possible core damage occurs earlier if the reactor has a longer operation time before the shutdown. The quantitative comparison of the core damage occurrence time with various operation times during LTSBO transients is summarized in Table 4.
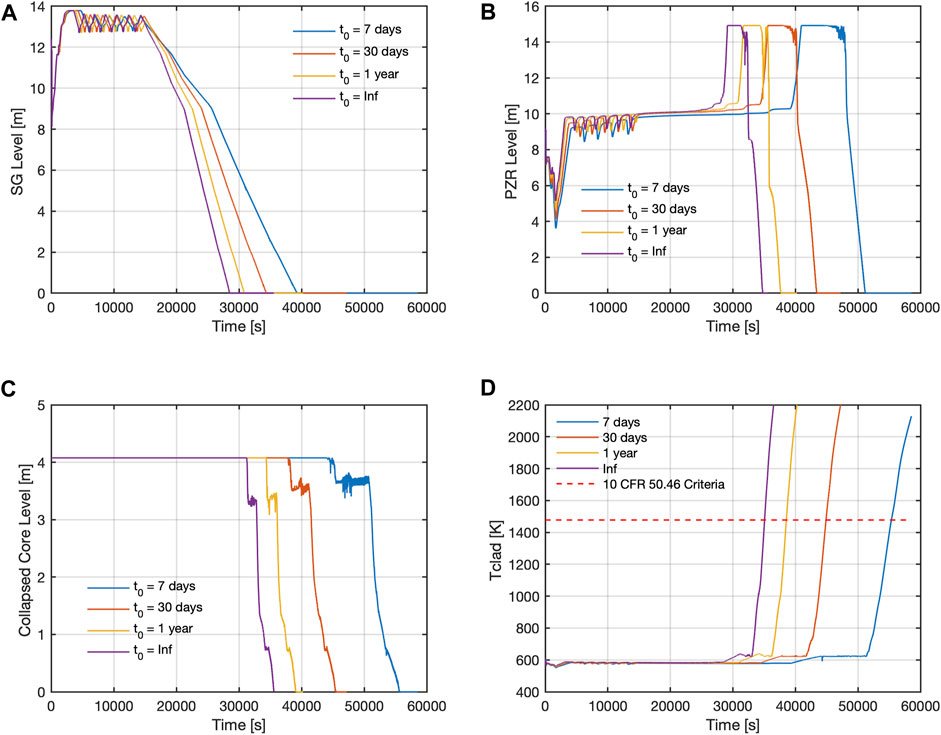
FIGURE 10. (A) SG water level, (B) pressurizer level, (C) collapsed core level, and (D) peak cladding temperature with various operation times during LTSBO.
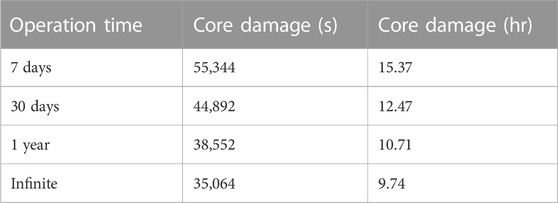
TABLE 4. Comparison of core damage occurring times with different operation times.
The quantitative comparison results show that the occurrence of core damage in an LTSBO with an operation time of 1 week is around 15.37 h after the initiation of the SBO transient. For the operation time of 1 month, the core damage occurs approximately 3 h earlier. For longer operation periods such as 1 year and infinite operation time, the occurring times are approximately 5–6 h earlier compared to the times calculated for the operation time of 1 week. This difference suggests the reactor operation time is important and should likely be considered for preventing potential core damage during SBO accidents. The analyses indicate that the timing of these event sequences under various operation times calculated by RELAP5-3D could aid plant operators in making timely decisions and taking appropriate actions to prevent and mitigate potential severe accidents.
6 Conclusion and future work
As one of the critical stages in developing this integrated risk assessment framework to address the challenges associated with external hazards and their potential impact on NPPs, this paper focuses on estimating the event progressions in response to external flooding events for a generic PWR by employing the safety analysis code RELAP5-3D. The original generic PWR RELAP5-3D model, which was developed mainly for analyzing LOCAs, was revised and customized to simulate the SBO accident. To verify the results of the modified RELAP5-3D model, the steady-state operation behaviors of the generic PWR model were established and compared to the ones obtained from the FSAR of one standard PWR plant. The dynamic simulation started with the LOOP-initiated short-term and long-term SBO scenarios for the generic PWR by examining the responses of various thermal-hydraulic performance parameters. Furthermore, to better understand this effect of different external intervening parameters, a sensitivity study of the LTSBO with different reactor operation times was also performed in this study, and the responses of various thermal-hydraulic parameters of interest as functions of time during long-term SBO scenarios were analyzed.
The results show that the core damage during STSBO occurs about 2.5 h after the initiation of the SBO transient (assuming an operation time of 1,350 effective full power days). For the LTSBO accident, the TDAFWP is assumed to be available to provide feedwater to cool the reactor core during the first 4 h after the reactor shutdown. This causes core damage to occur around 7.2 h later than in the STSBO transients. This suggests the availability of the TDAFW system is important to prevent potential core damage. This information will also be helpful for risk-informed decision-making processes. The results of LTSBO sensitivity to operation time show that the core damage could occur hours earlier with longer reactor operation time before the shutdown, which indicates the effect of operation time during the long-term scenario. The results of the analyses further showed that the safety analysis code RELAP5-3D is effective in analyzing SBO accidents. The insights provided by analyses could be valuable for plant operators in making timely decisions to prevent or manage severe accidents.
It is noted that the work presented in this paper is only part of the research effort for identifying and assessing the effects of the key sources of uncertainties through an integrated risk assessment framework to improve nuclear power plant safety during an external hazard-induced event. More simulations of hypothetical scenarios with different event timings incorporated will be conducted to assess plant behavior and to evaluate the effect of timing constraints on the probability and timing of core damage. In the next step, the developed mechanistic model will be integrated with an external flooding PRA model to take into account the uncertainties associated with various input parameters. The integration will facilitate the identification of the areas of uncertainty associated with physical flooding characterization and potential approaches for reducing those uncertainties.
Data availability statement
The original contributions presented in the study are included in the article/supplementary material, further inquiries can be directed to the corresponding author.
Author contributions
All authors listed have made a substantial, direct, and intellectual contribution to the work and approved it for publication.
Funding
This research is supported by the research grant from the United States Department of Energy’s Nuclear Energy University Program under grant/cooperative agreement DE-NE0008974. Any opinions, findings, and conclusions expressed in this manuscript are those of the authors and do not necessarily reflect the views of the funding agency or any other organization.
Conflict of interest
The authors declare that the research was conducted in the absence of any commercial or financial relationships that could be construed as a potential conflict of interest.
Publisher’s note
All claims expressed in this article are solely those of the authors and do not necessarily represent those of their affiliated organizations, or those of the publisher, the editors and the reviewers. Any product that may be evaluated in this article, or claim that may be made by its manufacturer, is not guaranteed or endorsed by the publisher.
References
Baranowsky, P. W. (1988). Evaluation of station blackout accidents at nuclear power plants,” NUREG-1032. Idaho Falls, Idaho: U.S. Nuclear Regulatory Commission.
Bensi, M., Groth, K., Wu, Z., Ma, Z., Schneider, R., Al-Douri, A., et al. (2022). Identifying and prioritizing sources of uncertainty in external hazard probabilistic risk assessment: project activities and progress. 16th Probabilistic Safety Assessment and Management Conference (PSAM16), Honolulu, HI.
Bower, G. R., and Schroeder, J. A. (2016). Analysis of loss-of-offsite-power events 1997–2014,” INL/EXT-16-37873. Idaho Falls, Idaho: Idaho National Laboratory.
Commonwealth Edison Company Zion station updated final safety analysis report, ” Commonwealth Edison Company (1993). Illinois, U.S.
Eide, S. A., Gentillon, C. D., Wierman, T. E., and Rasmuson, D. M. (2005). Reevaluation of station blackout risk at nuclear power plants: Analysis of station blackout risk,” NUREG/CR-6890. Maryland, United States: U.S. Nuclear Regulatory Commission.
Fletcher, C., Beaton, R., Palazov, V., Caraher, D., Shumway, R., and Falls, I. (2009). SCDAP/RELAP5 thermal-hydraulic evaluations of the potential for containment bypass during extended station blackout severe accident sequences in a Westinghouse four-loop PWR,” NUREG/CR-6995. Maryland, United States: U.S. Nuclear Regulatory Commission.
Johnson, N., and Ma, Z. (2019). Analysis of loss-of-offsite-power events 1987–2018,” INL/EXT-19-54699. Idaho Falls, Idaho: Idaho National Laboratory.
Johnson, N., and Ma, Z. (2020). Analysis of loss-of-offsite-power events 1987–2019,” INL/EXT-20-59589. Idaho Falls, Idaho: Idaho National Laboratory.
Johnson, N., and Ma, Z. (2021). Analysis of loss-of-offsite-power events 2020 update,” INL/EXT-21-64151. Idaho Falls, Idaho: Idaho National Laboratory.
Johnson, N., Ma, Z., and Schroeder, J. A. (2018). Analysis of loss-of-offsite-power events 1987–2017,” INL/EXT-18-45359. Idaho Falls, Idaho: Idaho National Laboratory.
Johnson, N., and Schroeder, J. A. (2016). Analysis of loss-of-offsite-power events 1987–2015,” INL/EXT-16-39575. Idaho Falls, Idaho: Idaho National Laboratory.
Johnson, N., Schroeder, J. A., and Ma, Z. (2017). Analysis of loss-of-offsite-power events 1987–2016,” INL/EXT-17-42376, rev. 1. Idaho Falls, Idaho: Idaho National Laboratory.
Liu, T., Wu, Z., Lu, C., and Martin, R. P. (2021). A best estimate plus uncertainty safety analysis framework based on RELAP5-3D and RAVEN platform for research reactor transient analyses. Prog. Nucl. Energy 132, 103610. doi:10.1016/j.pnucene.2020.103610
Ma, Z., Johnson, N., and Schroeder, J. A. (2019). Analysis of loss of offsite power events 1987–2017,” international topical meeting on probabilistic safety assessment and analysis (PSA) 2019. Charleston, South Carolina: American Nuclear Society.
Ma, Z., and Johnson, N. (2022). U.S. Nuclear power plants loss of offsite power analysis 2020 update. Idaho Falls, Idaho: Idaho National Laboratory.
Ma, Z., Parisi, C., Zhang, H., Mandelli, D., Blakely, C., Yu, J., et al. (2018). Plant-level scenario-based risk analysis for enhanced resilient PWR – SBO and LBLOCA,” INL/EXT-18-51436. Idaho Falls, Idaho: Idaho National Laboratory.
Ma, Z., Zhang, S., Zhang, H., Park, J., Yu, J., Blakely, C., et al. (2020). Risk-informed ATF and FLEX analysis for an enhanced resilient BWR under design-basis and beyond-design-basis accidents,” INL/EXT-20-59906. Idaho Falls, Idaho: Idaho National Laboratory.
Schroeder, J. A. (2015). Analysis of loss-of-offsite-power events 1998–2013,” INL/EXT-15-34443. Idaho Falls, Idaho: Idaho National Laboratory.
The RELAP5-3D Code Development Team (2015). RELAP5-3D code manual (revision 2.3). Idaho Falls, Idaho: Idaho National Laboratory.
The RELAP5-3D Code Development Team (1990). RELAP5/MOD3 code manual, volume III: Developmental assessment problems,” NUREG/CR-5535. Idaho Falls, Idaho: Idaho National Laboratory.
Todreas, N. E., and Kazimi, M. S. (2012). Nuclear systems. Volume I, thermal hydraulic fundamentals. United Kingdom: Taylor & Francis.
U.S. NRC (1975). Reactor safety study: An assessment of accident risks in U. S. commercial nuclear power plants. Maryland, United States: U.S. NRC.
U.S. NRC (1988). “Title 10, Part 50.2,” in Code of federal Regulations (United States: Office of the Federal Register).
U.S. NRC (2012). “State-of-the-Art reactor consequence analyses project,” in Surry integrated analysis, NUREG/CR-7110 (Maryland, United States: U.S. Nuclear Regulatory Commission).
U.S. NRC (2015). Reactor concepts manual: Pressurized water reactor (PWR) systems. Maryland, United States: U.S. Nuclear Regulatory Commission.
Wang, J.-R. (2013). TRACE simulation of SBO accident and mitigation strategy in Maanshan PWR. Maryland, United States: U.S. Nuclear Regulatory Commission.
Xia, Z., and Zhang, D. (2012). The analysis of PWR SBO accident with RELAP5 based on linux. Phys. Procedia. 24, 1329–1334. doi:10.1016/j.phpro.2012.02.198
Xu, H., and Zhang, B. (2022). Diverse and flexible coping strategy for nuclear safety: Opportunities and challenges. Energies 15 (17), 6275. doi:10.3390/en15176275
Yang, J., Wang, J. R., Shih, C., Huang, C. F., and Chen, S. W. (2019). The simulation and study of ELAP event with URG and FLEX mitigation strategies for PWR by using TRACE code. Kerntechnik 84 (2), 72–83. doi:10.3139/124.110999
Keywords: pressurized water reactor, safety analysis, external hazard, station blackout, RELAP5-3D
Citation: Liu T, Wu Z, Bensi M and Ma Z (2023) A mechanistic model of a PWR-based nuclear power plant in response to external hazard-induced station blackout accidents. Front. Energy Res. 11:1191467. doi: 10.3389/fenrg.2023.1191467
Received: 22 March 2023; Accepted: 25 May 2023;
Published: 07 June 2023.
Edited by:
Jun Wang, University of Wisconsin-Madison, United StatesReviewed by:
Ivo Kljenak, Institut Jožef Stefan (IJS), SloveniaMuhammad Zubair, University of Sharjah, United Arab Emirates
Copyright © 2023 Liu, Wu, Bensi and Ma. This is an open-access article distributed under the terms of the Creative Commons Attribution License (CC BY). The use, distribution or reproduction in other forums is permitted, provided the original author(s) and the copyright owner(s) are credited and that the original publication in this journal is cited, in accordance with accepted academic practice. No use, distribution or reproduction is permitted which does not comply with these terms.
*Correspondence: Zeyun Wu, end1QHZjdS5lZHU=