 Chen Junli1
 Zou Chongzhe
 Xiao Yulong
- 1Zhongnan University of Economics and Law, Wuhan, China
- 2Huazhong University of Science and Technology, Wuhan, China
- 3China University of Geosciences, Wuhan, China
The implementation of single-tank thermocline storage systems in concentrating solar power systems is a promising solution to improve their stability and continuity. However, flow uniformity within the tank is crucial for achieving optimal thermal efficiency. Distributors have been used to homogenize flow uniformity, and their geometrical parameters significantly impact the thermal performance. In this study, a transient three-dimensional model was developed to investigate the effect of annular distributor gaps on temperature and velocity distribution during the charging and discharging processes. The results showed that the use of annular distributors prevented maldistribution of the thermocline layer, resulting in improved flow uniformity. Furthermore, the discharging efficiency initially decreased and then increased as the gap increased from 30 mm to 80 mm. The minimum discharging efficiency of 72.8% was observed at a gap of 50 mm. Therefore, this study provides an effective method for optimizing the design of annular distributors and presents a creative approach for improving the flow uniformity in thermocline storage tanks.
1 Introduction
The energy crisis and greenhouse effect are serious environmental problems. As an effective solution, the development and utilization of renewable energy have been highly valued (Khare et al., 2016; Javed et al., 2020). Among the various types of renewable energy, Concentrating Solar Power (CSP) generation technology holds great development potential as it possesses advantages of environmental friendliness, freedom from greenhouse-gas emissions, and sustainability (Ahmed et al., 2020; Pata, 2021). However, CSP systems suffer from a mismatch between power generation and electricity demand. Besides, sudden changes in the weather lead to drastic disturbances in the system. To improve the stability and continuity of power output of CSP systems, it is necessary to add Thermal Energy Storage (TES) system. The system can continuously generate electrical power without compromising its efficiency or incurring additional costs (Kraemer et al., 2016; Ahmadi et al., 2018).
Currently, two-tank thermal energy storage systems are widely used in CSP applications (Liu et al., 2016). However, due to their high cost and unsuitability for large-scale construction, single-tank thermocline systems have become increasingly important. Research has shown that a single-tank thermocline system can reduce costs by up to35% compared to a two-tank system (Bellan et al., 2015). Given these advantages, single-tank thermocline systems have received significant attention, with numerous numerical and experimental studies being conducted (Elsihy et al., 2021) (Niedermeier et al., 2018). However, early numerical studies on single-tank thermocline systems used over-idealized assumptions when setting boundary conditions. While these assumptions simplified certain parameters, such as inlet flow rate and porosity (Li et al., 2021) (Mojtaba Hosseinnia et al., 2021), they obscured the authenticity and accuracy of other parameters, such as flow uniformity.
To reduce costs, single-tank energy storage systems have been proposed instead of double-tank systems (EPRI, 2010), (Kolb et al., 2011). During thermal line storage, hot fluid from the solar field is injected into the tank from the top, where it replaces the existing cold fluid in the tank, forcing it out of the bottom and back into the solar field. During the exothermic process, the hot fluid exits the top of the tank, goes through an energy extraction cycle, and returns to the bottom of the tank as a cold fluid. The stratification of the hot and cold fluids in the hydrothermal tank prevents convective mixing and thus maximizes the utilization of the individual tanks (Lew et al., 2011).
Lou et al. (2020a) conducted a numerical study that demonstrated the positive impact of optimized perforated baffles in the manifolds on flow maldistribution in single-medium thermocline storages. The results showed that the optimized baffles significantly improved the charging/discharging efficiency and capacity ratio of the tank. Afrin et al. (2014) proposed a pipe flow distributor with numerous sub-pipes to homogenize fluid velocity distribution on the horizontal surface of a cylindrical TES tank. The effects of the number of sub-pipes and the locations/number of holes on the sub-pipes were numerically studied. In a separate experimental study, Kim et al. (2017) tested a multiport jet-type inlet diffuser combined with a simple return outlet tube (without a diffuser) in a single-medium TES for CSP application. They found that the diffuser was required for both inlet and outlet to alleviate temperature deviation. Additionally, researchers have focused on simulating the effect of distributor geometric arrangements. Wang et al. (2015) conducted a numerical study to investigate the influence of annular distributors of varying radii at the bottom of the thermocline TES tank on thermal performance. They found that the tank with central fluid injection showed the thinnest thermocline thickness and best thermocline performance compared to other distributors.
Numerical and experimental studies on the effect of fluid distribution orientation were conducted by Bellenot et al. (2019), Bellenot (2020). They compared two types of radial ports with diameters of 0.102 and 0.026 m, respectively, and investigated the impact of both axial and radial ports on flow field distribution. The experiments showed that the energy stored during charging was consistent, but the amount of energy extracted during discharging varied with different distributors. The results indicated that energy collected axially was not recovered as efficiently as that collected radially. However, since the radial ports were located further away from the packed bed than the axial ports, it was easier for radial ports to draw in the fluid during discharging. Thus, it is unclear whether the difference in results was solely due to the orientation of fluid distribution.
Vannerem et al. (2022) conducted experimental studies to investigate the impact of three different injection methods on the thermal performance of packed bed thermocline storage. They compared uniform, central, and peripheral distributors, which were placed at the top of the tank, with the same inlet fluid velocity. The results showed that the distributor had an initial effect on the uniformity of the radial temperature of the tank. However, over time, the radial temperature became more homogeneous as the solid filler acted as a distributor and evened out the velocity field. As a result, the authors concluded that the distributors had only a slight impact on the overall storage performance of packed bed thermocline systems. Nevertheless, the effect of injection method on flow field distribution at higher velocities remains unclear.
Based on the literature review, considerable research efforts have been focused on improving the thermal performance of distributors. These efforts include investigating the thermal performance of single tanks with different distributor shapes, studying the arrangement and orientation of distributors, and optimizing distributors. However, the available studies lack a detailed analysis of the effect of annular distributor geometry on temperature distribution in TES tanks. Therefore, this paper aims to quantitatively investigate the influence of annular distributor geometrical parameters on the performance of packed bed thermocline storage tanks. To achieve accurate and rigorous research, a two-media energy balance equation is proposed to simulate the heat charging and discharging processes of annular distributors with four different gaps (30, 50, 60, and 80 mm). The main objectives of this paper are to: 1) analyze the effect of annular distributor gap on the smoothness of the flow field to improve the thermal performance of thermocline storage tanks; and 2) quantify the impact of annular distributor gap on global storage performance in a reference case and provide new directions for improving distributors’ performance.
2 Modeling methodology
2.1 Model figuration and assumptions
The present numerical investigation builds on previous experimental work by Fasquelle et al. (2016) and focuses on the use of annular distributors in a cylindrical thermocline tank filled with alumina spheres as solid filler materials and rapeseed oil as a heat transfer fluid (HTF). The design of using annular distributors is innovative and not present in Fasquelle’s prototype. The geometric modeling is shown in Figure 1, and the following assumptions are made (Fasquelle et al., 2016):
(1) Salt flow in the packed-bed region can be treated as laminar and incompressible.
(2) The storage tank is well-insulated, so heat loss caused by heat transfer between the tank body and the outside is negligible and can be ignored.
(3) The thermal properties of the solid filler are constant, and the solid particles are thermally thin (Bi < 0.1). Thus, the solid filler material is modeled as a continuous, homogeneous, and isotropic porous medium.
(4) During the charging and discharging process, the injected temperature is constant, and the temperature profile is initially homogeneous in the storage tank.
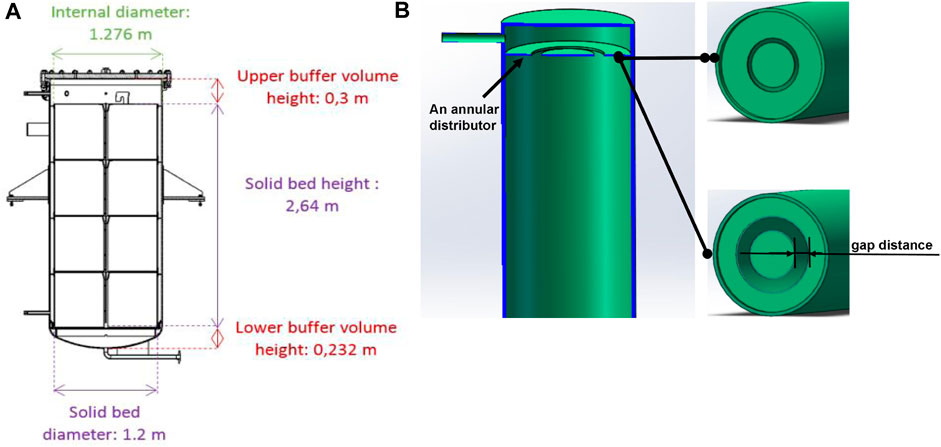
FIGURE 1. The TES tank size (A) (Wang et al., 2015) and the distributor sketch (B).
2.2 Governing equations
To accurately model a single-tank thermal storage system for rapeseed oil, which exhibits axis-symmetric behavior in three dimensions, it is essential to consider the varying physical properties of the oil, the impact of bulk forces, and axial thermal conductivity. The model’s governing equations are expressed in Eqs 1–5 (Fasquelle et al., 2016), with the following details:
Continuity equation for rapeseed oil:
where ε is the porosity of the packed-bed region,
Momentum equation for rapeseed oil:
where
Energy equation for rapeseed oil:
Energy equation for solid filler:
Energy equation for the tank wall and insulation layers:
Where
3 Numerical simulation
3.1 Flow area setting and grids meshing
The tank is filled with oil at the beginning of the charging and discharging processes. Both the
The governing equations were solved using the finite volume method in ANSYS FLUENT 21.0 software, with the pressure-velocity coupling field solved using the SIMPLE algorithm. The ANSYS Fluent 21.0 solver was used to couple the fluid energy source, solid energy source, unsteady solid energy term, and equations of turbulent kinetic energy to compute the model equations. The pressure equations, momentum equations, and energy equations were discretized using the second-order upwind scheme, while the equations of turbulent kinetic energy and turbulent diffusivity were discretized using the first-order upwind scheme. A time step of 1 s and a maximum of 90 iterations per step were employed during the calculation.
The model is characterized by several physical properties. The upper and lower buffer volumes are considered as normal fluid domains, while the solid bed is treated as a porous media area. The viscous resistance coefficient (

TABLE 1. Physical properties of the fluid and solid fillers.
In order to reduce calculation costs, a fine mesh was used within the tank, and a coarse mesh was used for the outside region. This was considered good compromise between time cost and accuracy. ANSYS 21.0 was used to build the mesh. Non-uniform grid systems were built using ICEM, as shown in Figure 2.
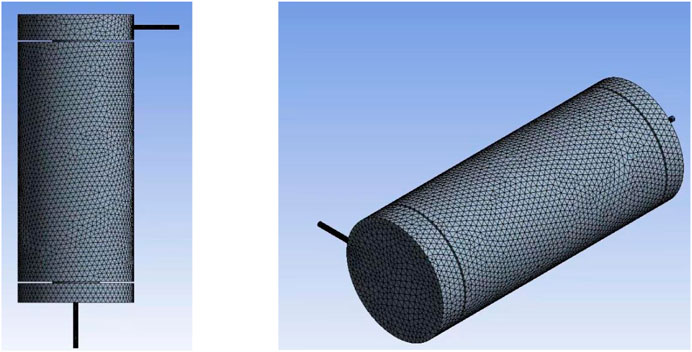
FIGURE 2. The model meshing for TES tank.
3.2 Boundary conditions
The wall of the packed-bed region (0 < Height < H, r = 0) is made of alumina, the same material as the solid filler. The wall is modeled using a standard roughness model with no slippage on stationary walls. For the bottom of the packed-bed region (x = 0, 0 ≤ r ≤ D/2), the cold oil enters through the boundary during the discharging process. The inlet condition of constant velocity (
For the top of the packed-bed region (i.e., x = H, 0 ≤ r ≤ D/2), the heated oil flows out of this boundary during a discharging process, and the fully developed in Eq. 8 is employed. During a charging process, the hot oil enters through this boundary, and the inlet condition of
For the top of the packed-bed region (i.e., x = H, 0 ≤ r ≤ D/2), the heated oil flows out of this boundary during a discharging process, and the fully developed condition is employed in Eq. 8. During a charging process, the hot oil enters through this boundary, and the inlet condition of constant velocity and constant temperature are determined by Eq. 9.
3.3 Gird independence test
To investigate the influence of grid size on the accuracy of the simulation, the axial variation of temperature at the same discharging time was compared for three different grid systems: 74,799, 134,000, and 180,000. The comparison is shown in Figure 3. As can be observed, there is little difference in temperature profiles among the three grid systems. Therefore, considering the computational accuracy and time cost, a grid system with 134,000 cells was chosen for the simulation.
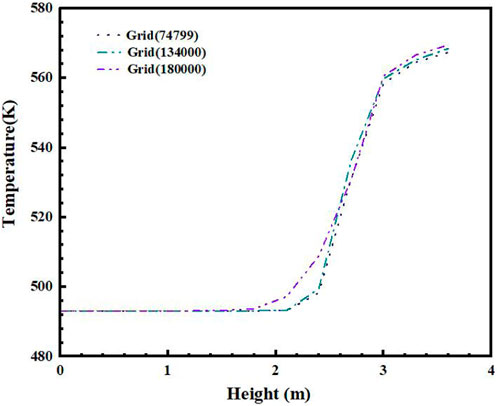
FIGURE 3. Grid independence Test.
4 Results and discussions
4.1 Model validation
The axial variation of the molten salt temperature in the model at successive discharging time points (0.25, 0.5, 0.75, 1.0, and 1.25) was compared with the experimental results reported by Pacheco et al. (Li et al., 2018) in which the molten salt temperature axis chosen was R = 0. Figure 4 shows the comparison between the present numerical results and the experimental results. Although there is a certain deviation between the simulation and experiment at t = 0.25 due to the uncontrolled experimental environment and the existence of certain assumptions in the simulation process, the temperature profile is generally similar to the experimental results. Overall, the agreement between the present numerical results and the experimental results is satisfactory considering the uncertainties in the experimental tests and the assumptions in the numerical calculations. This good agreement indicates that the numerical model is accurate and reliable.
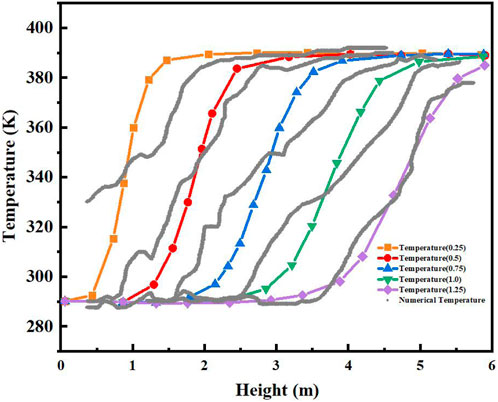
FIGURE 4. Comparison between present numerical result of the axial molten temperature and the experimental results from Pacheco et al. (Li et al., 2018).
4.2 The function of annular distributor
Figure 5 presents a comparison of the temperature profiles in the packed bed with and without annular distributors from t = 0.25 to t = 1.0. It was observed that the temperature in the center of the packed bed was significantly higher than the temperature on the periphery in the case without annular distributors (Pacheco et al., 2002). In contrast, the temperature distribution was more uniform in the case with annular distributors. These results indicate that single tanks with annular distributors exhibit better flow uniformity than tanks without annular distributors.
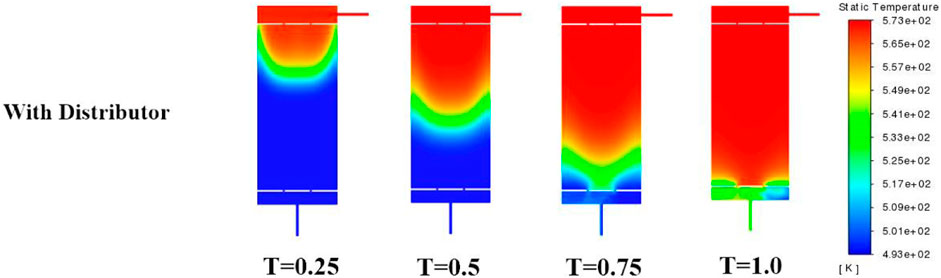
FIGURE 5. Comparison on the evolution of the temperature profiles in the TES tank from t = 0.25 to t = 1.0 during the charging process. The temperature contour without distributor comes from Lou et al. (2020b).
The addition of the annular distributor provides additional resistance to fluid flow and prevents the downward jet flow of hot HTF, which results in a reduced velocity peak in the middle of the TES tank. This leads to a more uniform fluid flow distribution and temperature stratification, improving the heat storage capacity of a single tank and avoiding radial diffusion of hot fluid that disturbs temperature stratification. However, it should be noted that the temperature near the wall of the tank is lower than the corresponding horizontal temperature, and stagnation occurs in the thermocline layer near the wall.
The observed phenomenon is attributed to the imposition of heat dissipation boundary conditions on the external surface of the tank, leading to a rapid temperature decline of the heat transfer fluid (HTF) in close proximity to the tank wall. Nonetheless, the influence of such boundary conditions dissipates rapidly over time as the solid particles within the tank function as a natural distributor, culminating in a more homogenous distribution of temperature throughout the field.
4.3 Discharging performance with gap variation
Figure 6 presents the evolution of thermoclines and temperature contours for various discharge time (time steps in hours) cases (Distributor Gap = 30, 50, 60, 80 mm), aimed at examining the impact of the distributor gap distance on the distribution of flow field morphology. It is noteworthy that values exceeding 80 mm were excluded from the current study due to the likelihood of an excessively wide annular distributor gap, which could ultimately impair flow uniformity. Similarly, values below 30 mm were also omitted, as they could lead to a reduction in flow velocity, negatively impacting the charging and discharging process time.
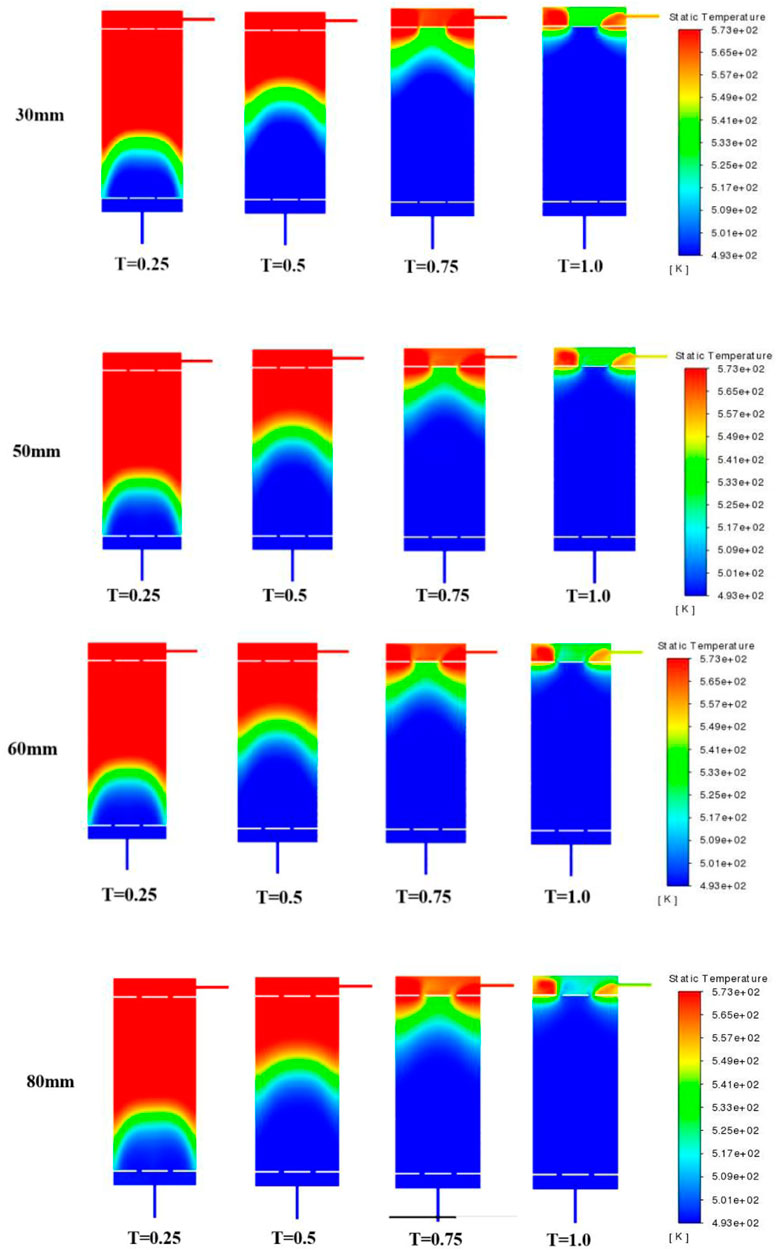
FIGURE 6. Evolution of the temperature profiles in the TES tank from t = 0.25 to t = 1.0 during the discharging process for different distributor gap.
During the discharging process, the thermocline layer gradually ascends and eventually exits the single tank. Concomitantly, the thickness of the thermocline layer increases gradually while the temperature gradient decreases, rendering the thermocline layer increasingly gentle and the temperature distribution more homogeneous with longer discharging times. This is attributed to the greater participation of the heat transfer medium inside the tank over time and the increase in the thermal conductivity of the oil, resulting in more heat transfer from the hot fluid to the cold fluid and ultimately leading to a thicker thermocline layer. Furthermore, it was observed that near the wall, the thermocline layer exhibited a large gradient of change, which gradually diminished with time due to the buffer effect of the filled particles.
Simultaneously, as the gap size increases, the flow field temperature distribution becomes more uniform, and the thermocline layer is smoother, indicating that the annular distributor gap positively affects the flow field uniformity of the single tank. This is because the increase in the distributor gap results in a higher flow rate of the blended hot fluid into the tank while enabling a wider range of reflux above the annular distributors, thereby preventing the formation of localized high temperatures. These factors in tandem contribute to a more uniform fluid flow into the tank.
Figure 7 presents the temperature distribution along the height direction at various discharging moments (t = 0.25, t = 0.5, t = 0.75, t = 1.0) when using alumina as the porous material. It can be observed that at different discharging moments, the temperature declines from 573.15 to 493.15 K along the height direction. As the discharging time exceeds 0.75, the outlet temperature of the single tank gradually decreases to the fluid domain inlet temperature (T = 493.15 K), ultimately filling the tank with a low-temperature fluid at 493.15 K and completing the discharging process.
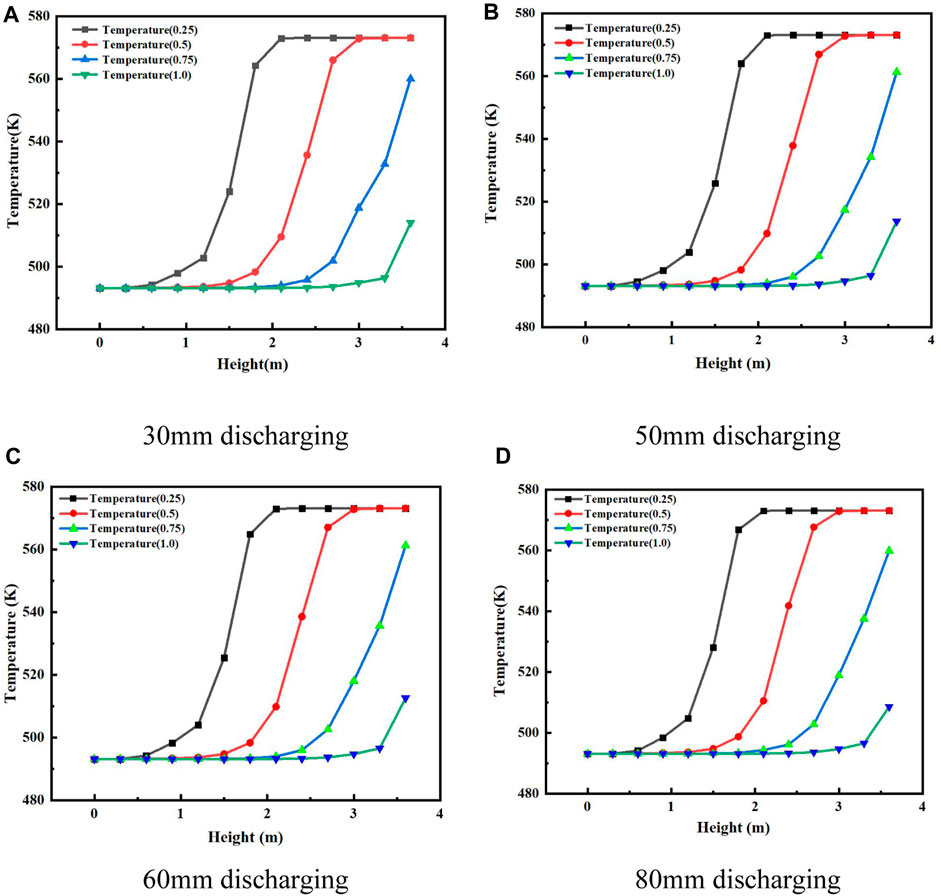
FIGURE 7. Axial temperature distribution profiles at different discharging moments during the discharging process. (A) Distributor gap = 30 mm. (B) Distributor gap = 50 mm. (C) Distributor gap = 60 mm. (D) Distributor gap = 80 mm.
As the heat exchange between the cold and hot fluids increases over time, the thickness of the thermocline layer gradually increases, leading to a decrease in the slope of the temperature curve. It was observed that the distributor gap did not significantly affect the trend of the temperature curve during the discharging time, indicating that the gap size did not have a significant impact on the heat exchange inside the tank. Rather, it primarily affected the uniformity of the flow field.
4.4 Charging performance with gap variation
Figure 8 depicts the time-evolution of the temperature distribution inside a tank containing rapeseed oil. The temperature contours were generated during the charging phase, covering a temperature range of 573.15–493.15 K. The tank is a packed-bed configuration, where alumina particles with a spherical size of 0.05 m and a porosity of 0.2 are used as filler material.
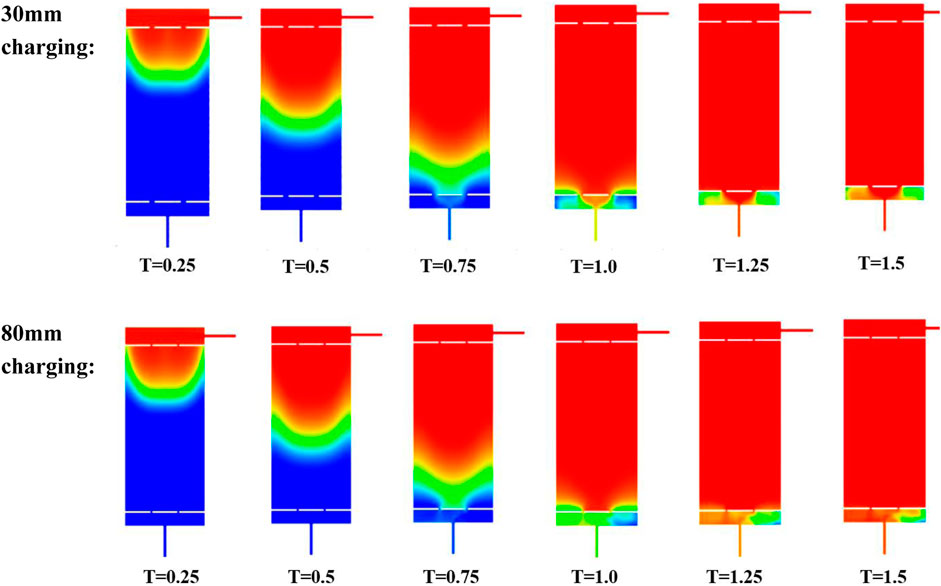
FIGURE 8. Evolution of the temperature profiles in the TES tank from t = 0.25 to t = 1.5 during the charging process for different distributor gap.
The presented data shows that the temperature inside the tank increases gradually over time, as expected during the charging process. Additionally, the temperature distribution is not uniform throughout the tank, with the center of the tank having a higher temperature compared to the edges. This non-uniformity is likely due to the heat transfer between the packed-bed and the tank walls.
Overall, the data presented in Figure 8 provides valuable insights into the temperature profile of rapeseed oil during the charging phase in a packed-bed tank configuration.
With an increase in the heat storage time, the thermocline layer gradually shifts downwards and eventually exits the heat storage tank, which is filled with a high-temperature fluid to complete the heat storage process. Additionally, the thickness of the thermocline layer gradually increases, while the temperature gradient gradually decreases. By comparing the temperature contours at different times, it is observed that the thermocline layer becomes increasingly gentle and the temperature distribution becomes more uniform.
Furthermore, a large return vortex disturbance is formed above the annular distributors just before the hot fluid enters the hole, leading to a more uniform temperature distribution at the entrance. However, a large temperature gradient persists near the wall. Solid filler particles also play a role in homogenizing the fluid.
The observed trends indicate that the proposed heat storage system exhibits an improvement in thermal performance with increasing heat storage time. The observed reduction in the temperature gradient and increase in thermocline layer thickness suggest that the system is becoming more stable and efficient. These results highlight the potential for using such a system as a viable energy storage solution.
Figure 9 presents the temperature distribution along the height direction of the heat storage tank at different charging moments (t = 0.25, t = 0.5, t = 0.75, t = 1.0, t = 1.25, and t = 1.5) when the porous material used is alumina.
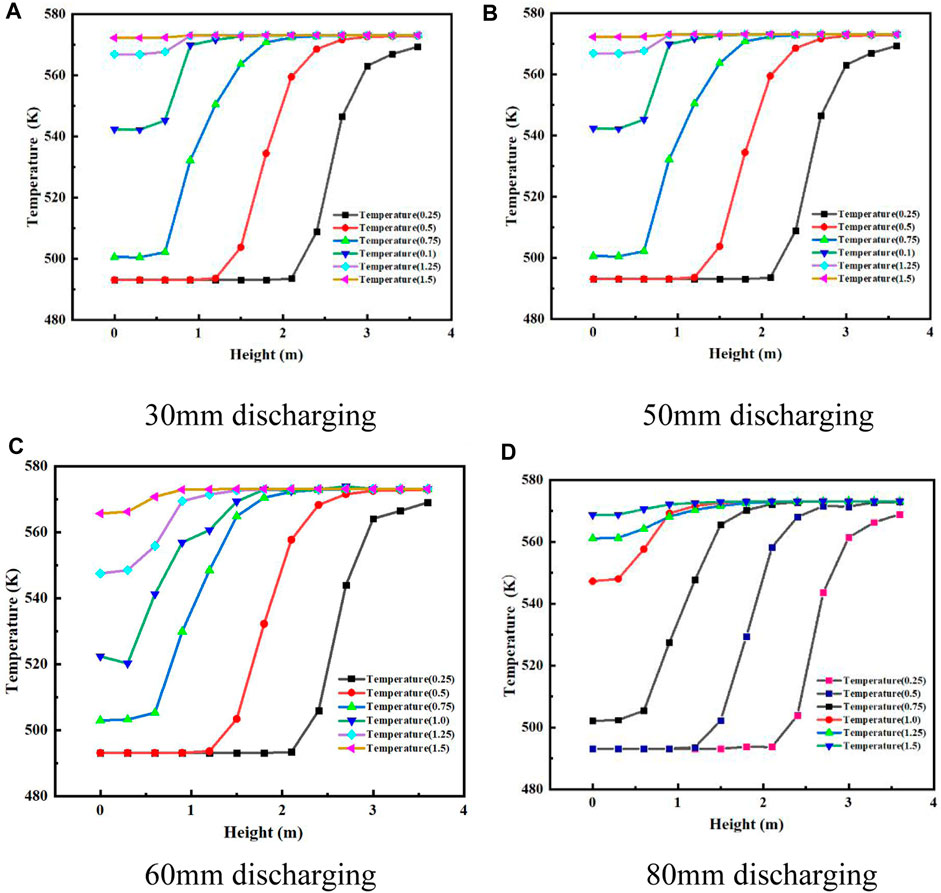
FIGURE 9. Axial temperature distribution profiles at different discharging moments during the charging process. (A) Distributor gap = 30 mm. (B) Distributor gap = 50 mm. (C) Distributor gap = 60 mm. (D) Distributor gap = 80 mm.
The data shows that at different exothermic moments, the temperature transitions from 493.15 to 573.15 K along the height direction of the tank. As the charging time increases, the outlet temperature gradually approaches the fluid domain inlet temperature (T = 573.15 K). Eventually, the tank is filled with a high-temperature fluid at 573.15 K, completing the charging process.
The presented data provides insights into the temperature distribution inside the heat storage tank during the charging process. It demonstrates that the system is capable of achieving the desired high-temperature storage through the use of porous alumina as filler material.
The data analysis reveals that with the passage of time, there is an increase in the heat exchange between the cold fluid and the hot fluid. This results in the expansion of the thermocline layer, which in turn leads to a decrease in the slope of the temperature curve.
These observations are indicative of the dynamic behavior of the heat exchange process between the two fluids. The results have implications for the design and optimization of heat exchange systems in various applications, where the focus is on achieving optimal performance with respect to time and efficiency.
4.5 Thermal efficiency analysis
In order to analyze the thermal efficiency of the system, the discharging efficiency of the single tank was evaluated as shown in Figure 10. The purpose was to investigate the effect of the annular distributor gap on the efficiency of the single tank.

FIGURE 10. Discharging efficiencies with different distributor gap.
The charge efficiency is defined as the ratio between the charged energy when the chosen temperature threshold is reached, and the maximum energy that could be charged in the tank between TL and TH (Eq. 10). Charge efficiency corresponds to the final state of charge of the tank (Fasquelle et al., 2016).
Discharge efficiency corresponds to the ratio between the energy that has been discharged, and initial energy that was charged in the tank before discharging Eini (Eq. 11). Energy that has been discharged is calculated from the beginning of the discharge to the time when the chosen temperature threshold is reached (Fasquelle et al., 2016).
The results indicate that the discharging efficiency is the lowest when the distributor gap is 50 mm, with a value as low as 72.8%. However, as the distributor gap increases to 60 mm or greater, both discharging efficiency and thermal storage efficiency show an increasing trend. When the gap size reaches 80 mm, the efficiency is as high as 75.8%.
The analysis reveals that the annular distribution gap of 50 mm resulted in the lowest thermal efficiency. This might be attributed to the compromise between the flow velocity and the liquidity of the system. The results have implications for the optimization of the design of thermal energy storage systems, where the annular distributor gap size can be adjusted to achieve optimal efficiency.
The findings of this study provide useful guidelines for the design of annular distributors within thermal energy storage (TES) tanks. It is recommended that the gap value be selected carefully to avoid the lowest thermal efficiency point.
In particular, our analysis reveals that a larger gap value above the lower limit can lead to the highest thermal efficiency. However, it should be noted that a gap value over 80 mm was not investigated in this study because such a large annular distributor gap would result in maldistribution, despite a potential minor improvement in thermal efficiency.
Likewise, gap values less than 30 mm were also not investigated due to their potential to reduce the flow velocity, which would negatively impact the charging and discharging process over time. Therefore, it is important to carefully consider the annular distributor gap value in the design of TES tanks to optimize their thermal efficiency.
5 Conclusion and future directions
This paper presents a study on the charging and discharging processes of a rapeseed oil-packed bed TES tank. A transient three-dimensional model based on equilibrium thermal theory with a porous medium was used to investigate the system’s behavior. To enhance flow uniformity, the study investigated the influence of the gap distance of annular distributors, which is a novel approach. The gap distance was varied from 30 to 80 mm during both charging and discharging processes, and the results were compared.
Compared to a single tank without annular distributors, the tank with annular distributors showed superior thermal stratification and prevented maldistribution. As the gap between the distributors increased, the smoothness of the thermocline layer depicted in the temperature contour also improved. This suggested that increasing the distributor’s gap could further enhance flow uniformity. At a gap distance of 50 mm, the discharging efficiency of the annular distributors was at its lowest point (72.8%), while the thermal storage efficiency increased as the gap distance between the distributors expanded. When the gap distance of the annular distributors reached 80 mm, the discharging efficiency of the tank improved to 75.8%.
When the gap in the ring distributor is 30 mm, there is basically no backflow of HTF through the distributor, which leads to localised high temperature phenomena or localised low temperature phenomena in the buffer zone of the TES, which is detrimental to the uniform distribution of the flow field. When the gap in the ring distributor is 50 and 60 mm, a small amount of backflow occurs when the HTF passes through the distributor, and the flow field distribution in the buffer zone is better than that in the case of a 30 mm gap. In the case where the gap of the ring distributor measures 80 mm, a significant amount of HTF will flow back through the distributor. This reflux action facilitates the mixing of HTF in the porous media area with that in the buffer zone, leading to a homogeneous distribution of the flow field within the buffer zone. Consequently, the temperature distribution in the TES buffer zone becomes relatively uniform, thereby minimizing the occurrence of local high-temperature or low-temperature phenomena.
This indicated that increasing the gap distance was advantageous for the flow characteristics within the TES tank and provided valuable guidance for improving distributor performance. These findings would be useful for the design and optimization of TES systems in various applications.
Future research efforts could focus on exploring alternative types of geometrical distributors and examining their various geometrical parameters. This would allow for more comprehensive guidance in the design of effective distributors, ultimately leading to the development of more efficient and reliable TES systems. In future research work, topological optimization methods will be further introduced to investigate the optimal design of the geometrical parameters of different distributors.
Data availability statement
The raw data supporting the conclusion of this article will be made available by the authors, without undue reservation.
Author contributions
CJ: supervision, investigation, and conceptualization. ZY: supervision, data curation, and preparation. ZC: writing- original draft, writing- reviewing and editing. OY: writing- original draft XY: methodology and software. All authors contributed to the article and approved the submitted version.
Conflict of interest
The authors declare that the research was conducted in the absence of any commercial or financial relationships that could be construed as a potential conflict of interest.
Publisher’s note
All claims expressed in this article are solely those of the authors and do not necessarily represent those of their affiliated organizations, or those of the publisher, the editors and the reviewers. Any product that may be evaluated in this article, or claim that may be made by its manufacturer, is not guaranteed or endorsed by the publisher.
References
Afrin, S., Kumar, V., Bharathan, D., Glatzmaier, G. C., and Ma, Z. W. (2014). Computational analysis of a pipe flow distributor for a thermocline based thermal energy storage system. J. Sol. Energy Engineering-Transactions Asme. 136 (2). doi:10.1115/1.4024927
Ahmadi, M. H., Ghazvini, M., Sadeghzadeh, M., Nazari, M. A., Kumar, R., Naeimi, A., et al. (2018). Solar power technology for electricity generation: A critical review. Energy Sci. Eng. 6 (5), 340–361. doi:10.1002/ese3.239
Ahmed, R., Sreeram, V., Mishra, Y., and Arif, M. D. (2020). A review and evaluation of the state-of-the-art in PV solar power forecasting: Techniques and optimization. Renew. Sustain. Energy Rev. 124, 109792. doi:10.1016/j.rser.2020.109792
Bellan, S., Alam, T. E., Gonzalez-Aguilar, J., Romero, M., Rahman, M. M., Goswami, D. Y., et al. (2015). Numerical and experimental studies on heat transfer characteristics of thermal energy storage system packed with molten salt PCM capsules. Appl. Therm. Eng. 90, 970–979. doi:10.1016/j.applthermaleng.2015.07.056
Bellenot, G., Bentivoglio, F., Marty, P., Bruch, A., and Coudrais-Duhamel, M. “Thermocline energy storage: Influence of fluid distribution into porous media,” in Proceedings of the SOLARPACES 2019: International Conference on Concentrating Solar Power and Chemical Energy Systems, Daegu, South Korea, October 2019.
Bellenot, G. (2020). Etude de l’influence de la distribution de fluide sur le comportement thermodynamique d’un réservoir de stockage thermique mono-cuve dual-media Universit´e Grenoble Alpes. Grenoble, France: Université Grenoble Alpes.
Elsihy, E. S., Liao, Z., Xu, C., and Du, X. (2021). Dynamic characteristics of solid packed-bed thermocline tank using molten-salt as a heat transfer fluid. Int. J. Heat Mass Transf. 165, 120677. doi:10.1016/j.ijheatmasstransfer.2020.120677
Epri, (2010). “Solar thermocline storage systems: Preliminary design study,”. Technical Report 1019581 (Washington, DC, United States: Electric Power Research Institute).
Fasquelle, T., Falcoz, Q., Neveu, P., Lecat, F., Boullet, N., and Flamant, G. “Operating results of a thermocline thermal energy storage included in a parabolic trough mini power plant,” in Proceedings of the SOLARPACES 2016: International Conference on Concentrating Solar Power and Chemical Energy Systems, Abu Dhabi, United Arab Emirates, October 2016.
Javed, M. S., Ma, T., Jurasz, J., and Amin, M. Y. (2020). Solar and wind power generation systems with pumped hydro storage: Review and future perspectives. Renew. Energy 148, 176–192. doi:10.1016/j.renene.2019.11.157
Khare, V., Nema, S., and Baredar, P. (2016). Solar-wind hybrid renewable energy system: A review. Renew. Sustain. Energy Rev. 58, 23–33. doi:10.1016/j.rser.2015.12.223
Kim, D. H., Yoon, S. H., Kim, Y., Song, C. H., Lee, K. H., and Choi, J. S. (2017). Experimental studies of the discharge performance of single-medium TES for CSP applications. Appl. Therm. Eng. 127, 499–507. doi:10.1016/j.applthermaleng.2017.08.057
Kolb, G., Ho, C., Mancini, T., and Gary, J. (2011). “Power tower technology roadmap and cost reduction plan,”. Technical Report SAND2011-2419 (Albequerque, NM, USA: Sandia National Labora-tories).
Kraemer, D., Jie, Q., McEnaney, K., Cao, F., Liu, W., Weinstein, L. A., et al. (2016). Concentrating solar thermoelectric generators with a peak efficiency of 7.4. Nat. Energy 1, 1–8.
Lew, J. V., Li, P., Chan, C., Karaki, W., and Stephens, J. (2011). Analysis of heat storage and delivery of a thermocline tank having solid filler material. J. Sol. Energy Eng. 133, 021003. doi:10.1115/1.4003685
Li, M. J., Qiu, Y., and Li, M. J. (2018). Cyclic thermal performance analysis of a traditional Single-Layered and of a novel Multi-Layered Packed-Bed molten salt Thermocline Tank. Renew. Energy 118, 565–578. doi:10.1016/j.renene.2017.11.038
Li, Q., Huang, X., Tai, Y., Gao, W., Wenxian, L., and Liu, W. (2021). Thermal stratification in a solar hot water storage tank with mantle heat exchanger. Renew. Energy 173, 1–11. doi:10.1016/j.renene.2021.03.105
Liu, M., Tay, N. H. S., Bell, S., Belusko, M., Jacob, R., Will, G., et al. (2016). Review on concentrating solar power plants and new developments in high temperature thermal energy storage technologies. Renew. Sustain. Energy Rev. 53, 1411–1432. doi:10.1016/j.rser.2015.09.026
Lou, W., Fan, Y., and Luo, L. (2020b). Single-tank thermal energy storage systems for concentrated solar power: Flow distribution optimization for thermocline evolution management. J. Energy Storage 32, 101749. doi:10.1016/j.est.2020.101749
Lou, W. R., Fan, Y. L., and Luo, L. G. (2020a). Single-tank thermal energy storage systems for concentrated solar power: Flow distribution optimization for thermocline evolution management. J. Energy Storage 32, 101749. doi:10.1016/j.est.2020.101749
Mojtaba Hosseinnia, S., Akbari, H., and Sorin, M. (2021). Numerical analysis of thermocline evolution during charging phase in a stratified thermal energy storage tank. J. Energy Storage, 40.
Niedermeier, K., Marocco, L., Flesch, J., Mohan, G., Coventry, J., and Wetzel, T. (2018). Performance of molten sodium vs. molten salts in a packed bed thermal energy storage. Appl. Therm. Eng. 141, 368–377. doi:10.1016/j.applthermaleng.2018.05.080
Pacheco, J. E., Showalter, S. K., and Kolb, W. J. (2002). Development of a molten-salt thermocline thermal storage system for parabolic trough plants. J. Sol. Energy Engineering-Transactions Asme 124 (2), 153–159. doi:10.1115/1.1464123
Pata, U. K. (2021). Linking renewable energy, globalization, agriculture, CO2 emissions and ecological footprint in bric countries: A sustainability perspective. Renew. Energy 173, 197–208. doi:10.1016/j.renene.2021.03.125
Vannerem, S., Neveu, P., and Falcoz, Q. (2022). Experimental investigation of the impact of fluid distribution on thermocline storage performance. J. Energy Storage 52, 104864. doi:10.1016/j.est.2022.104864
Wang, L. T., Yang, Z., and Duan, Y. Y. (2015). Influence of flow distribution on the thermal performance of dual-media thermocline energy storage systems. Appl. Energy 142, 283–292. doi:10.1016/j.apenergy.2014.12.024
Nomenclature
Keywords: thermocline energy storage, annular distributors, gap distance, flow uniformity, temperature distribution, thermal efficiency
Citation: Junli C, Yanping Z, Chongzhe Z, Yulong X and Yuming O (2023) Thermal performance analysis of a thermocline storage tank with integrated annular distributors. Front. Energy Res. 11:1190760. doi: 10.3389/fenrg.2023.1190760
Received: 21 March 2023; Accepted: 07 July 2023;
Published: 25 July 2023.
Edited by:
Tingxian Li, Shanghai Jiao Tong University, ChinaCopyright © 2023 Junli, Yanping, Chongzhe, Yulong and Yuming. This is an open-access article distributed under the terms of the Creative Commons Attribution License (CC BY). The use, distribution or reproduction in other forums is permitted, provided the original author(s) and the copyright owner(s) are credited and that the original publication in this journal is cited, in accordance with accepted academic practice. No use, distribution or reproduction is permitted which does not comply with these terms.
*Correspondence: Zou Chongzhe, em91Y2hvbmd6aGVAY3VnLmVkdS5jbg==