 Ameh A. Attabo
 Oluseyi O. Ajayi
 Sunday O. Oyedepo
 Sunday A. Afolalu
- 1Mechanical Engineering Department, Covenant University, Ota, Nigeria
- 2Mechanical & Mechatronics Engineering Department, Afe Babalola University, Ado, Nigeria
- 3Mechanical Engineering Science Department, University of Johannesburg, Johannesburg, South Africa
Wind energy is a promising sector in the power generation industry because it is renewable and globally available. In this research work, the wind energy potential and the economic viability of using wind turbines to generate electricity in some selected sites along Nigeria’s coastline and offshore locations were evaluated. Using the statistical two-parameter Weibull probability density function method, wind speed data retrieved from an indigenous oceanography company and global information system (GIS) were analyzed for wind energy harvest. The energy output, unit cost of electricity generated by three commercially available wind turbine models (3 MW, 4 MW, and 6 MW), net present value (NPV), and payback period were evaluated. Levelized cost of electricity (LCOE) sensitivity to the discount rate, foundation cost, and turbine lifespan were also examined. The findings from the study showed that the offshore sites have four times greater wind power potential than the coastal sites. The offshore sites can be categorized as “class IIIb” wind sites, making the locations suitable for wind energy harvest. The techno-economic analysis showed that the net gains from investing in a 60-MW wind farm in the region can be as high as $62,000,000.00, while the project payback time can be as low as 5.74 years. Two of the offshore sites are recommended for the development of an offshore wind farm in the country because of their relatively low LCOE (0.04 $/kWh), higher NPV, and lower investment payback time. The Vesta-117 model wind turbine is the most suitable wind turbine system and recommended for use in the region because of its low cut-in speed (3 m/s). Sensitivity analysis showed that the LCOE of offshore-01 was reduced by 31% when the lifespan of the V117 turbine was increased from 20 to 25 years. The results also showed that reductions in the discount rate and foundation cost positively affect the LCOE.
1 Introduction
Due to the growing population and knowledge of sustainable development and environmental protection, the use of renewable energy sources has received considerable attention during the last few decades. Wind energy, one of the most well-known renewable energy sources, has been widely used in various parts of the world. Wind power is virtually limitless, clean, and environmentally friendly. Countries like China, the United States of America, Germany, Denmark, Spain, and India are constantly increasing their installed wind power capacities on an annual basis. The increasing level of growth and development of wind energy technology is made possible by the efforts of researchers across the globe. These efforts are geared toward seeking ways to improve the system’s generation capacity by enhancing the aerodynamic performance of the blade shape; for example, Göçmen and Özerdem (2012) optimized for the noise emission reduction, Zhang et al. (2018) demonstrated power-trade-off for aeroacoustics, and Ajayi et al. (2019) improved the startup capacity of low-speed wind turbines. Other efforts are also focused on the proper understanding and analysis of the flow dynamics around wind turbine rotors, especially at the wakes, as it concerns the wind farm layout design (Fan et al., 2023).
Adopting wind energy for power generation, however, requires the knowledge of its resource availability in a particular space and time. This is because wind power potentials are location-specific due to the nonlinearity of its availability in space and time (Ajayi et al., 2014). Hence, before the commitment of huge investment associated with renewable energy projects, resource evaluation to determine the feasibility of the project is considered the first step. Most important also is the economic–environmental viability of the project. Based on this, several researchers focused on the first step of resource assessment of siting wind energy and other renewable energy projects in a place to determine the potential and economic viability of such projects. For instance, Kohole et al. (2023) examined the wind energy potential, as well as electricity and hydrogen generation, for the cities of Kousseri, Kaele, Maroua, Mokolo, Mora, and Yagoua in the far northern region of Cameroon using wind speed data recorded at heights of 10 m, 40 m, and 70 m. The Enercon E-48/800 turbine has the highest capacity factor in all of the locations studied, with the energy cost ranging from 0.0578 $/kWh in Kousseri to 0.0838 $/kWh in Mora. If the power plants that burn oil or natural gas as fuel are replaced with wind turbines, CO2 emission will be reduced by up to 885.36 tons or 641.60 tons in the far northern region of Cameroon. Asamoah et al. (2023) examined the financial, technical, and environmental impact assessment of a 50-MW wind farm in four locations in Ghana, using the net present value as the main financial metric to analyze the profitability of the projects. The study established that a potential utility-scale wind project is feasible in all locations. To fulfill energy demands in Thailand, Khan et al. (2022) used the Wind Atlas Analysis and Application Program (WAsP) to simulate the wind potential in the northern part of the country; the cities studied are Lamphun, Chiang Rai, Mae Hong Son, Mae Sariang, Phayao, Thung Chang, and Theon. The results from the study recommended two out of seven cities to be viable for the establishment of wind farms because the two cities (Phayao and Mae Sariang) have wind power densities higher than 400 W/m2.
Many studies have also used the global information system (GIS) method to estimate the wind potential in other countries, most especially where physical data collection may not be feasible. For example, Harrucksteiner et al. (2022) employed a GIS-based technique to assess the suitability of using renewable energy generators in some sites in Mongolia; thereafter, an energy tool was deployed to calculate the technical and economic potential obtainable from these locations. The study estimated that the combined technical wind and solar potential is 7.25 TW, of which 2.13 TW can be generated from wind turbines. Tuy et al. (2022) used WRF and Sentinel-1 level 2 to predict offshore wind potential in Cambodia. Martinez and Iglesias (2021) employed a multiparameter analysis for a case study to discern the effects of specific elements on the levelized cost of electricity (LCOE) of floating wind farms located in the Mediterranean Sea. Assumptions were formulated as functions of site-specific variables (distance to shore, water depth, and annual energy production). Shu et al. (2022) worked on optimizing offshore wind farm output using a non-centralized approach. The study evaluated a wind farm comprising 36 wind turbines.
1.1 The case for Nigeria
Currently, Nigeria does not produce a relatively large amount of wind energy; however, the demand for energy occasioned by increased population and industrialization has pushed the limits for the country to critically examine sites suitable for wind energy harvest. At the end of 2021, Nigerian power plants have an installed capacity of 13.5 GW, with natural gas plants accounting for 84.6%, large hydro plants accounting for approximately 14.5%, off-grid small hydro plants accounting for 0.7%, and off-grid distributed PV accounting for 0.2%, and an onshore wind project in Kastina has an installed capacity of 10.2 MW (Climatescope, 2021). With an optimistic gross domestic product (GDP) growth rate of 11.5%, the Energy Commission of Nigeria (ECN) conducted an energy demand and supply study, taking into account economic vision, demography, available energy resources, and modern developmental path. The result shows that Nigeria would need 31,210 MW of energy per day (Ale and Adeyemi, 2022). Furthermore, a 2022 USAID report estimated that there are more than 20 million homes without electricity in Nigeria, and the power plants generate a daily average of 4,100 MW of energy per day between 2020 and 2021 (USAID, 2022). This suggests that there is a significant energy deficit which is responsible for load shedding, power outages, and low voltage in the supply of electricity experienced in most parts of the country (Salakhetdinov and Agyeno, 2020; Chanchangi et al., 2022). This has been a deep concern to both the government and the people of Nigeria for many years. One of the actions taken by the federal government to finding a long-term answer to this problem is the adoption of the National Renewable Energy Action Plans (NREAP) which targets that Nigeria should generate at least 30% of their energy from renewable energy sources before 2030 (NREAP, 2015).
Considering the energy deficit in Nigeria, some studies have reported that the use of wind energy is marginal and can be used for water pumping and electricity generation. For instance, Ayodele et al. (2018) carried out a study using 16 years of wind data obtained from NIMET for a techno-economic analysis of wind energy to pump water in some selected communities in Oyo State, Nigeria. The results from the study showed that the wind power densities in the communities range from 165.75 to 207.2 W/m2. The Polaris P50 wind turbine was selected as the most suitable wind turbine, with a rated power and wind speed of 50 kW and 9 m/s, respectively. Amole et al. (2023) carried out a comparative analysis of using a hybrid energy system (PV and grid connection) in a rural location in South West Nigeria. The study examined the monthly grid purchase, unmet electric load, and net present cost of energy. Recommendation from the studies encouraged the use of a PV–grid system, achieving an LCOE as low as USD $ 0.1904. Oladigbolu et al. (2021) used Homer software to analyze hybrid power-generating systems comprising solar PV, wind turbines, and diesel generator to supply power to a rural healthcare facility. The results also showed that the optimized solution is environmentally friendly, with an acceptable carbon dioxide emission of 1,304 kg/year. The emission rate was approximately 80% less than when only fossil fuel was used in the location.
To estimate wind characteristics, variation pattern, wind power potential, and the performance of various estimation tools in Nigeria, Ben et al. (2021) evaluated 10 years of daily mean wind speed data from 13 cities in Central and Southern Nigeria using six different methods of estimating Weibull parameters (graphical, empirical methods of Justus and Lysten, method of moment, maximum likelihood method, and energy pattern factor). They reported that the cities in the southern and central parts of the country have power classes ranging between 1 and 4. Ozioko et al. (2022) evaluated the impact of wind energy penetration on the Nigerian power grid, especially when replacing the conventional fossil fired generator with doubly-fed induction generator (DFIG)-based wind turbine generators. Their study focused on the connection of power generated from wind turbines to the national grid and not on actual wind power generation or assessment.
1.2 Present study
Although there are some wind power classification studies across Nigeria, all the existing studies have focused mainly on onshore sites (Fatigun, et al., 2017; Ben et al., 2021; Richard and Eseosa, 2022). Those that assessed and exposed the potential and economic viability of wind power variability along the coastal and offshore locations are scanty or non-existent. At best, what exist are mere mentions of the possible potential capacity of generating wind power around coastal and offshore locations without any efforts geared toward its assessment and econometrics (Ajayi et al., 2014; Olaofe, 2017). Therefore, the aim of this paper is to evaluate and showcase the wind energy potential of some sites around the coastal and offshore locations in Nigeria using in-situ and GIS-retrieved wind data to determine prospective sites for the adoption of wind energy generation in the region. The econometrics of using commercially available wind turbines to generate power at the sites was also considered. The result from this study may draw public attention to the untapped renewable energy source along some coastal towns and offshore locations in the country; it will also serve as a tool for the federal government and other stakeholders in the decision-making process of investing in wind energy projects around the selected sites.
2 Data collection
The wind speed data for the selected locations were obtained from Ines Oceanography Resources (a marine data acquisition firm), covering a 10-year period between 2010 and 2019. Wind data were captured at a height of 10 m above the ground using a cup-generator anemometer; other parameters such as atmospheric pressure and dominant wind direction were also measured. The satellite data used to estimate wind energy in this study were obtained from the National Centers for Environmental Prediction (NCEP) Climate Forecast System Reanalysis (CFSR) platform based in the United States of America. Satellite observations were used in radiance form and were bias-corrected with “spin up” runs at full resolution, taking into account variable CO2 concentrations. The coordinates of the six locations are given in Table 1, and Figure 1 shows the map of the location of the selected sites. The four offshore sites were tagged “offshore-01 to offshore-04” because these locations are arbitrary locations selected off the shores of Nigeria and within 50 km from the country’s shoreline. Figure 1 displays the map locations of the two coastal and four offshore sites.
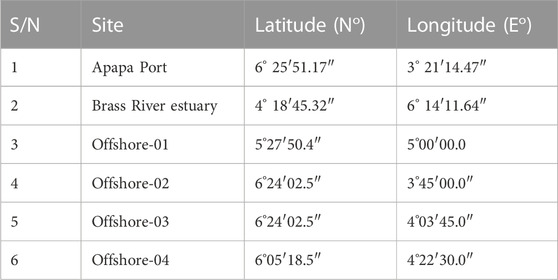
TABLE 1. Coordinates of the selected coastal and offshore locations.

FIGURE 1. Nigeria shoreline map showing coastal and offshore locations of interest.
3 Methods of analysis
3.1 Power law
The wind speed measurements were adjusted to the requisite turbine hub height because the heights of the meteorological towers were significantly lower than the turbine hub heights; hence, all the wind speed data from the sites were adjusted to 100 m in this study. The hub height of 100 m was chosen to enable an unbiased comparison for the various sites as the average heights of selected turbines also fall within this range. Previous research showed that wind shear decreases with height, causing wind speeds to increase with height, h, depending on the ground friction coefficient α (Crippa et al., 2021). The wind speed at the hub height can be calculated using the following expression (Sasser et al., 2022):
where v2 is the wind speed at the hub height; v1 is the wind speed at the meteorological mast height; α is the surface roughness coefficient; h1 is the metrological mast height; and h2 is the turbine hub height. According to the existing literature, the surface roughness coefficient for various terrains ranges between 0.1 and 0.4, with the smoother terrains having lower magnitudes while the higher range is for rougher terrains. The surface roughness coefficient is calculated using Eq. 2 (Adaramola et al., 2014):
3.2 Weibull distribution function
The prediction of wind energy is relatively complex because wind is a variable resource (Imani et al., 2021). In most cases, the prediction of wind speed is carried out using probability distribution functions, and various models have been used in previous works to predict wind speed with various accuracies (Shu et al., 2015). However, the Weibull and Rayleigh probability distributions have been found to provide a fitting representation of the variation of the mean wind speed (Al-Mhairat and Al-Quraan, 2022; Sumair et al., 2022). Thus, this study employed the Weibull probability distribution function to classify and analyze the wind characteristics of the sites.
Eq. 3 gives the expression for the Weibull probability distribution function (Jabbar, 2021):
where f(v) is the probability of observed wind speed v. k and c are known as the Weibull shape parameter and Weibull scale parameter, respectively. The scale parameter c is measured in m/s and describes the abscissa scale of the data distribution plot; a higher value of c indicates a higher wind energy potential in that location. The dimensionless shape parameter k, on the other hand, determines the width of the data distribution plot, which reflects the maximum wind distribution.
The moment method was used to calculate both the k and c parameters.
The mean wind speed (vm) and variance (σ2) of the wind data are determined using Eqs 4, 5 (Usta, 2016):
while the Weibull parameters (k and c) are estimated using Eq. 6, 7, respectively:
The gamma function is estimated using the standard Eq. 8:
3.3 Wind turbine operating probability
There are two important wind speed parameters to consider when estimating wind power potentials: the cut-in and cut-out wind speeds (Klerk and Venter, 2017). The cut-in wind speed is the minimum wind speed required for turbines to generate usable power, whereas the cut-out wind speed is the wind speed at which turbines will be shut down to prevent damage. The cut-in speed for most available wind turbines is in the range of 3–5 m/s, while the cut-out speed can be as high as 25 m/s (Mansi and Aydin, 2022). As a result, wind speed frequencies occurring in the range of “cut-in and cut-out” wind speeds are valuable for the accurate assessment of the operability and economic feasibility of offshore wind turbines in the region. Therefore, the operating probability of the turbines is calculated using the cumulative Weibull distribution function, as shown in Eq. 9 (Ahmed, 2018):
where V1 and V2 represent the cut-in and cut-out wind speeds of the turbines, respectively.
3.4 Most probable wind speed and wind speed carrying maximum energy
The peak of the Weibull probability distribution function represents the most probable wind speed, while the wind speed carrying the most energy is the speed at which the most power is generated based on the available wind profile. The most probable wind speed (Vmp) and wind speed carrying maximum energy (VmaxE) are calculated using Eqs 10, 11, respectively. To improve the overall efficiency of wind farms, it is recommended that the rated wind speed and wind speed carrying maximum energy should be as close as possible, since a wind turbine generator produces maximum power at its rated wind speed (Oyewole et al., 2019).
3.5 Wind power density
The wind power density (WPD) is an indicator that has been widely adopted to demonstrate the capacity of wind resources at a specific site (Li et al., 2022). The WPD from the Weibull distribution parameters is estimated using Eq. 12 (Sumair, 2021):
where ρ is the air density (kg/m3) and c and k are the Weibull scale and shape factors mentioned previously.
3.6 Annual energy yield
The annual energy yield from the wind turbines is calculated by multiplying the probability of having that speed in a year with the power output of the turbine at a certain speed. Eq. 13 (Ahmed, 2018) is used for the calculation of the annual energy yield from each site.
where Pe(v) is the power output at speed v and f(v) is the probability of having v.
3.7 Capacity factor
The ratio of the average output power to the rated output power is referred to as the capacity factor (CF). The annual CF is given by Eq. 14 (Mattar and Guzman-Ibarra, 2017):
where Prated is the turbine rated power output.
3.8 Levelized cost of electricity
The LCOE is estimated using Eq. 15 (Chancham and Gagnon, 2017):
where CI is the total investment cost; 8760PratedCf is the annual energy output from the wind turbine in kWh; CRF is the capital recovery factor which is the equivalent of the annual revenue throughout the lifetime of the wind turbines; and Com(esc) is the annual operations and maintenance cost escalated as given in Eqs 16, 17 (Martinez and Iglesias, 2022).
where Com, eom, n, and
where the apparent escalation rate is designated as ea, and the discount rate can be calculated as follows:
where i is the interest rate.
3.9 Net present value
The net present value (NPV) uses the time value of the money concept to convert future cash flow into a present value at a certain discount rate. Mathematically, the present value of future cash flow is calculated using Eq. 20 (Schweizer et al., 2016; Jang et al., 2022):
where PV is the present value of the recurring annuity, Aa. dr is the discount rate, and n is the number of years in the future. In this study, n was set at 20 years as most wind turbines have an estimated lifespan ranging between 20 and 25 years.
3.10 Simple payback time
The simple payback time is a technique for analyzing energy costs that determines how long it will take for energy savings (profit for the farm) to equal the project’s initial investment cost (Dai et al., 2022). When determining the wind farm’s viability, the payback period is calculated by contrasting the initial investment cost with the project’s yearly returns. The more cost-effective the investment, the shorter the payback period. Eq. 21 is used for the calculation of the simple payback time (Ramadhan, 2021).
where SPT is the simple payback time in years; CI is the total investment cost; Ea is energy produced annually (kWh/year); Pr/kWh is the price of energy or price obtained for energy generated; FCR is the fixed charge rate per year; and AOM is the annual operations and maintenance cost per year.
3.11 Cost estimation methods
Due to the difficulty in obtaining the exact costs for the wind farm component at various stages of the project, cost parameters for foundation costs, electrical grid connections, and operations and maintenance costs were estimated.
3.11.1 Foundation cost
A cost function for offshore wind turbine foundations was developed and expressed as a linear function in terms of water depth (Srensen and Larsen, 2021). Eq. 22 provides the relationship between the foundation cost and water depth.
where Cf and d denote the foundation cost ($/MW) and water depth (m), respectively.
3.11.2 Electrical cost
Moller et al. (2012) developed a cost function for estimating electrical expenditures, as shown in Eq. 23, which expressed the cost in terms of the shortest land and subsea distances to the offshore turbines.
where ds denotes the shortest subsea distance (km), the shortest land distance (km) is denoted as dl, and CE is the electrical cost in $/MW. In this study, two types of cable lengths are considered, viz., land cables that are required to connect the OWF to the high-voltage national grid and subsea cables that are required to connect the OWF to the shoreline.
3.11.3 Operations and maintenance costs
The cost function used is expressed in terms of distance to the port, as shown in Eq. 24 (Jacquemin et al., 2011; Rinaldi et al., 2021):
where Com represents the operations and maintenance cost ($/MW) and dp denotes the shortest distance from the harbor or service port (km) to the OWT.
3.12 Selection of reference wind turbines and wind farm layout
For the econometric assessment, three wind turbines with different power ratings (3, 4, and 6 MW) were analyzed, and their economic viabilities were evaluated. The three turbines used for the assessment are V90 (3.0 MW) and Vesta V117 (4.0 MW) manufactured by Vesta and SWT-6.0-154 (6 MW) manufactured by Siemens. Table 2 shows the technical specification of the selected wind turbines.
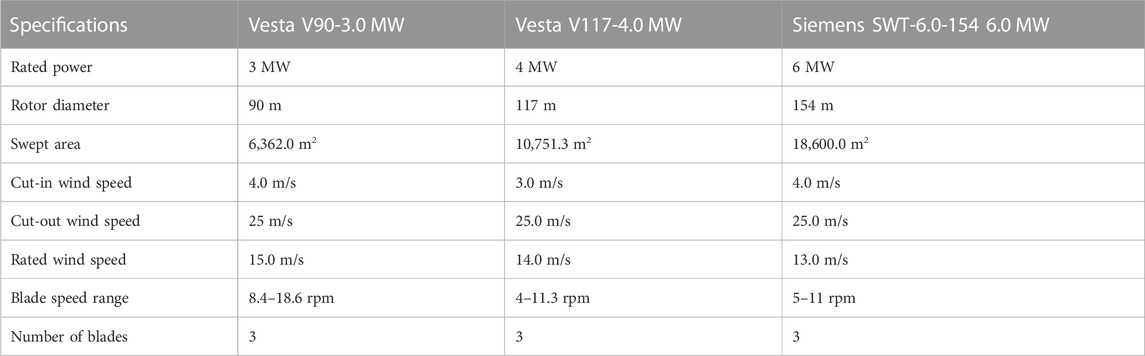
TABLE 2. Specifications of the wind turbines employed in this study (Vestas Americas, 2014; 2017; and Siemens-Gemesa, 2016).
For each of the sites in this study, a 60-MW wind farm was simulated using the aforementioned three models of wind turbines. For the 3.0-MW wind farm, 20 wind turbines were positioned at least 4 rotor diameters apart from one another (Noel et al., 2022) in the x- and y-planes (using a 5 row by 4 column matrix). Successive turbine rows were offset to the previous rows to minimize the wake effect from upstream turbines. Wind farm simulation for the 4-MW and 6-MW wind farms was carried out using 15 units (i.e., 5 rows by 3 columns) and 10 units (i.e., 5 rows by 2 columns) of wind turbines, respectively, instead of 20 units as used in the case of the 3-MW wind farm setup.
4 Results and discussion
4.1 Wind potentials
The wind potential in the region was assessed by evaluating the average wind speed, power density, and wind directions for each site. Figure 2 shows the 10-year mean wind speeds for coastal and offshore sites interpolated to a hub height of 100 m. Brass had the least magnitude in terms of the annual mean wind speed profile of 4.89 m/s, and offshore-02 had the highest speed of 7.95 m/s. Offshore-01 and offshore-03 (7.61 m/s and 7.32 m/s, respectively) also had an impressive average wind speed compared with the wind data of the other sites. The wind speed in Brass is in the range of 3.02 m/s–6.52 m/s (mean 4.89 m/s), while offshore-02 has a range between 6.91 m/s and 8.25 m/s (mean 7.95 m/s).
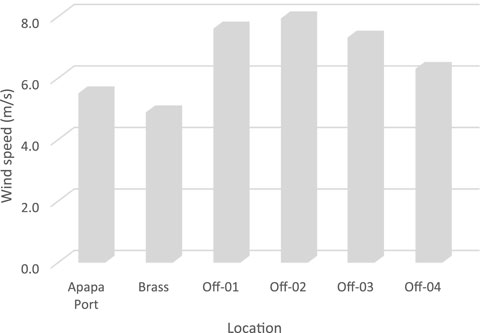
FIGURE 2. Mean wind speeds along the selected Nigerian coastal and offshore locations.
Examining the variation in wind speed across the years (Figure 3) shows that there was a decrease in the values of the wind speed profiles across the years for offshore-04, Apapa, and offshore-01. Offshore-04 had an approximately 15% decline in wind speeds when comparing the most recent years with preceding years. However, Brass and offshore-02 and -03 were observed to have a slight increase (less than 5% increase) in their mean wind speed in 2019 when compared to the preceding years.
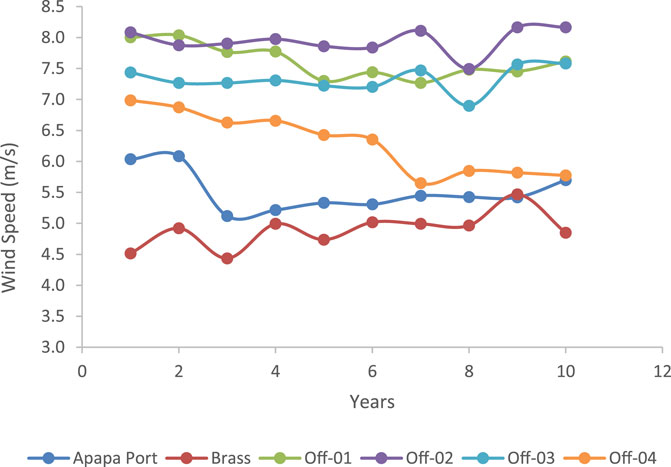
FIGURE 3. Annual variations in wind speeds of some sites along the Nigerian shoreline and offshore location.
4.2 Weibull analysis for shoreline sites
The indicators required for the generation of wind energy were deduced using the Weibull (moment method) and are presented in Table 3. The highest annual scale parameter of 8.72 m/s was observed at offshore-04, while the least value of 5.17 m/s was recorded in Brass; the values for Apapa, offshore-01, -02, and -03 are 5.81 m/s, 8.18 m/s, 8.53 m/s, and 7.90 m/s, respectively. The annual most probable wind speeds for the sites ranges from 5.08 m/s to 8.44 m/s. The estimated values for k across all the sites in the region were in the range of 5.7 ≤ k ≤ 8.18 m/s. These high values of k (k ≥ 2) indicate a data spread similar to the normal distribution (Kumar and Gaddada, 2015) and also show that the data have a narrow data spread. In some cases, a relatively high k factor is desirable at higher mean speeds (Thambain and Storm, 2012), which is an indication that the data spread is concentrated at a higher modal wind speed.
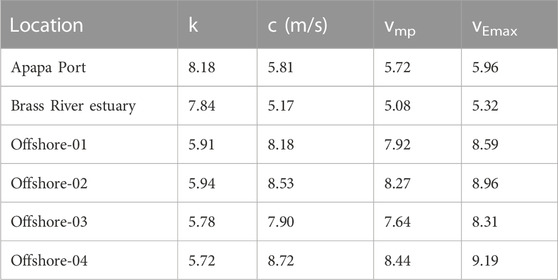
TABLE 3. Turbine selection parameter for some selected locations in the Nigeria shoreline.
The result of the most probable wind speed (Vmp) is slightly lower than the wind speed carrying maximum wind energy (i.e., maximum likelihood wind speeds) at all the sites. Similar to the other parameters previously considered, the highest VEmax was noticed at offshore-04 (9.19 m/s), which is closely followed by offshore-02 with 8.96 m/s and Brass with the lowest value of 5.32 m/s.
4.3 Wind power density
The WPD is a function of the mean wind speed in that location, as shown in Figure 4. The WPD ranges from 62 W/m2 to 361 W/m2, with offshore-04 having the highest wind power density of 361 W/m2, closely followed by offshore-02 with a potential of 337 W/m2. The Brass River estuary has the lowest WPD of 62 W/m2.
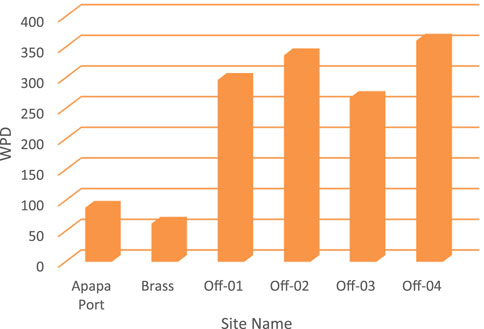
FIGURE 4. Mean WPD for some Nigerian sites along the shoreline.
4.4 Wind energy cumulative distribution and probability density functions for shoreline sites
The cumulative distribution function (CDF) and probability density function (PDF) for the six sites studied in Nigeria are shown in Figures 5, 6, respectively. Apapa Port and Brass had a steeper slope for the CDF and PDF than the four offshore locations. This is an indication that the coastal sites (Apapa and Brass) follow the same cumulative distribution pattern, while the four offshore sites have a wider spread. The steep CDF plots at these locations indicate that the energy produced over the period is contained within a narrower range, resulting in a plot that is slightly inclined to the left side of the graph. Offshore-01 to offshore-04 have higher potentials; hence, the shape of their CDFs is tilted to the right, indicating a higher energy potential. The PDF plots of both the coastal locations showed high peaks, inferring that the majority of the data were densely packed around the mean values. For Apapa and Brass, 80% of the WPD ranged between 75 and 110 W/m2, while 50% of the data series ranged between 80 and 105 W/m2. At offshore-01, 80% of the data series ranged from 220 W/m2 to 330 W/m2, while up to 50% of the data series ranged from 250 W/m2 to 305 W/m2. Offshore-04 had a higher wind energy potential than the other sites, resulting in a plot that is slightly skewed to the right.
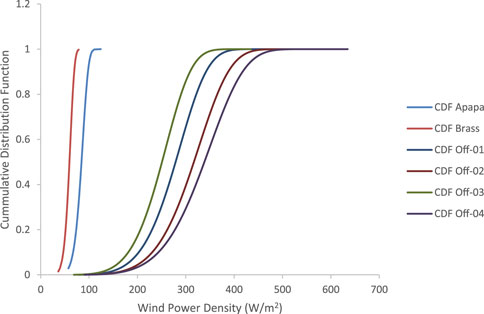
FIGURE 5. Wind energy CDF for some Nigerian sites along the shoreline.
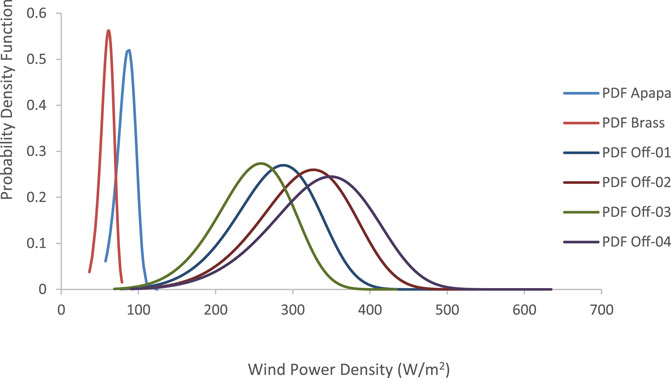
FIGURE 6. Wind energy PDF for some Nigerian sites along the shoreline.
4.5 Prevailing wind directions at the sites
In this study, wind roses were developed from the wind speeds and directions for all the locations for a period of 10 years, and the details are shown in Figures 7, 8. The wind rose for Apapa (Figure 7A) reveals that 202.50 (i.e., the south-south-western direction) was the dominant direction, with frequencies of 36.47% for the various wind speed ranges. In this direction, the most likely wind speed magnitude is 4.65 m/s (29% occurrence). The fetch area for the Brass River estuary (Figure 7B) is also from the south-south-west direction, with wind magnitudes ranging from 3.6 to 5.7 m/s occurring approximately 26% of the time and wind speeds greater than 5.7 m/s occurring only 2% of the time. The wind direction from the south-western directions had a 25% prevalence, while other directions in Brass had less than 12% occurrence.
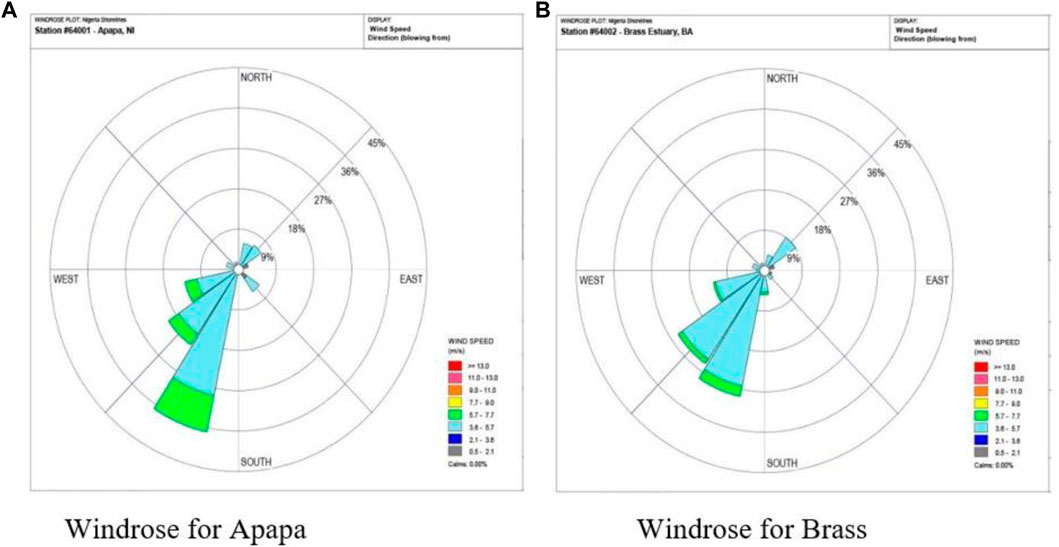
FIGURE 7. Wind roses for the coastal sites. Wind roses for (A) Apapa Port; (B) Brass River estuary.
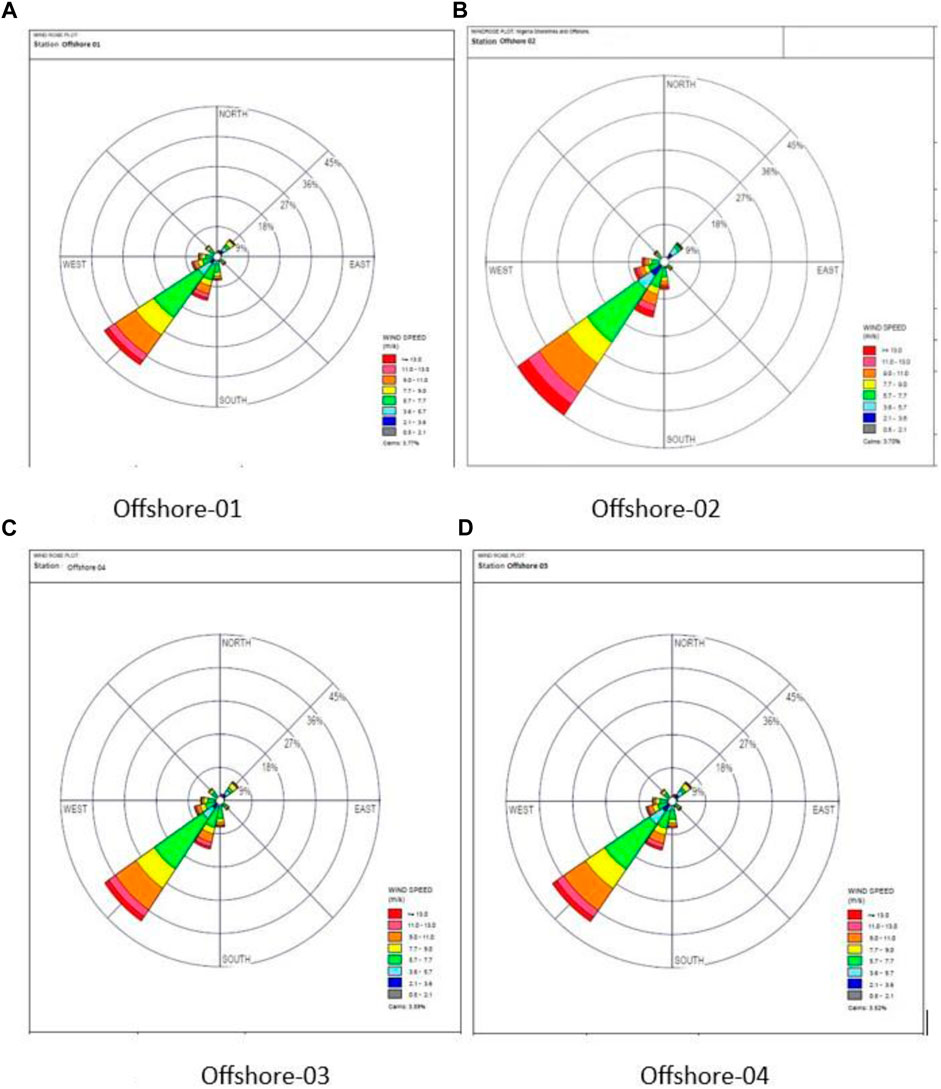
FIGURE 8. Wind roses for the offshore sites. (A) Offshore-01; (B) offshore-02; (C) offshore-03; (D) offshore-04.
The wind rose for the four offshore sites is illustrated in Figure 8, and it was observed that the plots look similar. The similarity is in the fact that the surface roughness scale is the same and there is little or no interference to the wind flow in the sites. The similarity in their wind rose plot could be attributed to the fact that there is no obstruction or vegetation to deflect the wind direction in the offshore regions. Even though the wind rose plot was similar at the offshore sites, the magnitude of the wind speeds varies; for example, offshore-02 had a higher speed in the prevailing direction. The wind rose plots of the offshore sites show a slightly different behavior from the coastal regions; the most prevalent wind direction for the offshore locations was from the south-western direction with an occurrence for 36% and wind speed >5.7 m/s. Winds from the SSW and WSW directions prevailed for 13.7% and 7.95% of the time, respectively; while a period of no wind was observed in these sites across the years for 3.7% of the time. The most variability in the direction of the winds was observed in the offshore areas, and this also comes with greater mean wind speeds.
4.6 Econometrics of 60-MW offshore wind farms
The annual energy produced (AEP) from the various sites is plotted and shown in Figure 9. It shows that the AEP ranges from 29 GWh at Brass using the Siemens SWT 6 model to 223 GWh at offshore-04 using the Vesta V117 model. Regardless of the location, the Vesta V117 wind turbine model generated the highest amount of electricity, while the Siemens SWT 6 model generated the least amount of electricity for this region. This is due to the lower cut-in speed of the Vesta V117 model than that of both the SWT 6 and V3000 models. The difference of 1 m/s in the cut-in speeds at Apapa resulted in approximately a 3% improvement in the AEP, which shows that there is a geometric relationship between the wind speed and energy harvested from the wind turbine.
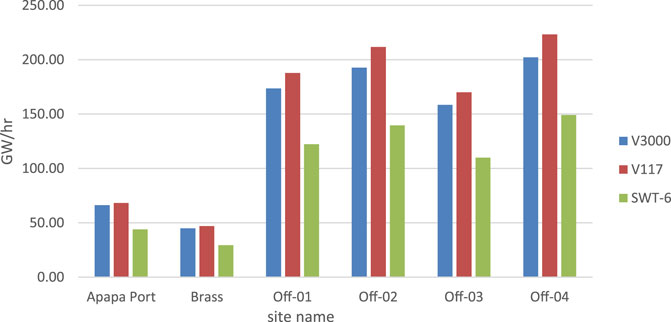
FIGURE 9. Annual energy produced from the various sites studied.
The capacity factors (Cfs) for the selected wind turbine models are shown in Table 4; the Vesta V117 model has the highest value among the models considered for all the sites, for the same reason given for the AEP previously. There was a close correlation between the turbine performance when comparing the AEP and Cf as both variables are dependent on the wind speed potential at the given site.
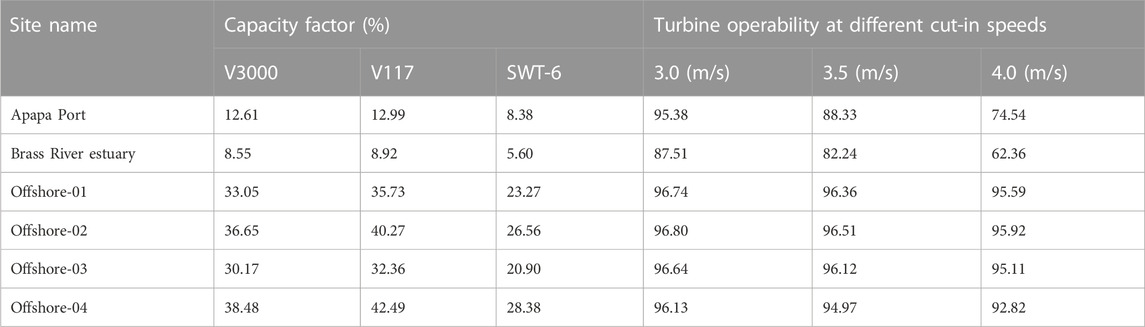
TABLE 4. Capacity factor for the three turbine models and turbine operating probabilities at the selected coastal sites.
The turbine operating probability denotes the percentage of time that a practical turbine installed at the given wind speed regime can operate in a year, and it is the percentage of time in a year that a practical turbine installed at the given wind speed regime can operate. Eq. 3.10 is used to calculate the operating probability of wind turbines at each location. Using the most prevailing cut-in speeds of available commercial wind turbines, three different cut-in speeds (3 m/s, 3.5 m/s, and 4 m/s) were evaluated in this study, but the value of the cut-out wind speed was set at 25 m/s (because most wind turbines have a cut-out speed of 25 m/s). Table 4 also summarizes the operating probabilities for various cases. In general, as the cut-in speed increases, the operating probability at each site decreases. As a result, the operating probability is sensitive and inversely related to the cut-in speed at a specific wind energy-generating site. Offshore-02 had the highest operating probability, up to 96.8%. Brass, on the other hand, has the lowest operating probability of the six sites studied. Based on the wind regime at the site, a Vesta V117-4.0 MW wind turbine with a capacity of 4 MW and a cut-in wind speed of 3 m/s will operate 96.1% of the time at offshore-04, while the same turbine will operate 95.38% of the time at Apapa Port.
4.7 Cost of electricity
For the estimation of the levelized cost of electricity generated by each commercial wind turbine in the region, the following assumptions were considered.
1. The interest rate (r) and inflation rate (i) were taken to be 15% and 10.4%, respectively. These are the prevailing rates retrieved from the Central Bank of Nigeria.
2. Each wind turbine is assumed to produce the same amount of energy each year during its useful lifetime.
3. The lifetime (n) of each wind turbine was set at 20 years.
4. The annual maintenance and operations costs are assumed to be 3% of the wind turbine installation system’s initial capital cost. This figure is based on the result of research work carried out by Wiser et al. (2019).
The estimated cost of electricity (i.e., LCOE) generated by the selected wind turbines at each location is shown in Figure 10 ($/kWh) based on the aforementioned assumptions. The least cost of unit energy per kWh was obtained as 0.04 $/kWh at offshore-02 using the V3000 and V117 wind turbine generators (WTGs), while similar cost of generating electricity was obtained at offshore-04 using the V117 WTG. It can be further observed that the highest cost of electricity is obtained by the SWT-6 model WTG, with the cost ranging between 0.06 $/kWh (offshore-02 and -04) and 0.27 $/kWh (Brass). Even though the WPD at offshore-04 was greater than that at offshore-02, the later had a lower cost of generating electricity because of other factors like distance to the shore and foundation depths.
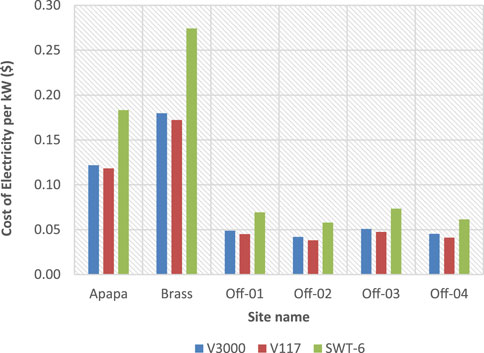
FIGURE 10. Levelized cost of electricity in US dollars.
4.8 Simple payback time for the studied sites in Nigeria
The simple payback time (SPT) analysis for the sites is shown in Figure 11, and the result shows that the offshore sites have shorter payback periods, which is because of the higher wind speeds observed at these locations. For the V117 model, 83% of the sites have repayment times of less than 20 years, and the repayment times for the best performing site is approximately 5.74 years which is very impressive as this repayment time is less than 30% of the turbine’s useful life. Using the V3000 model shows that the shortest time in which the money for the investment could be recovered is 6.41 years, while Brass (at the coastline) had the longest repayment time (33.09 years). The SPT for the SWT-6 model had the longest repayment time in all the sites; however, all the offshore sites evaluated had repayment time <11.2 years. This is an indication that the WTGs will pay off the cost of the project shortly after they are at half of their useful life, which is a good index for profitability. The two coastal sites had a payback time greater than 20 years, which is due to wind dampening as a result of buildings and other vegetations around the sites.
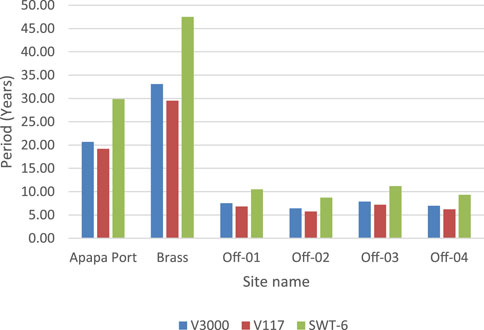
FIGURE 11. Simple payback time for the various sites.
4.9 Net present value (NPV) for the studied coastal and offshore sites
Table 5 shows the net present value for the coastal and offshore sites studied; the NPV with negative values are sites that might run at loss, while a positive value in the NPV indicates that if the parameters remain the same, a wind farm situated in these locations will be profitable. Considering the V117 1 and V3000 wind turbines, the NPV for all the offshore sites in this region returned with positive values, an indication that the probability of making profit from these sites using the wind turbine generator models used in this work is high; therefore, the establishment of wind farms in these locations is highly recommended. For example, the net gains from using the V177 model at offshore site-02 could be as high as $62,000,000.00. For SWT-6, four out of the six sites considered returned with a negative value when using these WTGS; however, offshore-02 and 04 were still profitable with net gains higher than $5,000,000 from the investments.
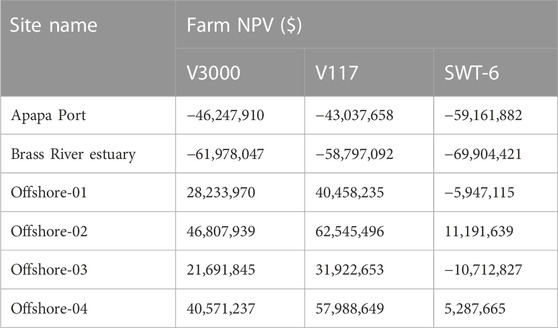
TABLE 5. Net present value for some Nigerian coastal and offshore sites.
4.10 Sensitivity analysis
Three variables were chosen as sensitive variables to examine their impact on the LCOE of offshore wind projects in Nigeria, viz., discount rate, useful project life, and percentage change in foundation cost were evaluated as sensitivity parameters using offshore-01 as a representative site. By changing the discount rate from 2% to 16% as shown in Figure 12, it was observed that changes in the discount rate have significant impact on the LCOE of the site; an increase in the discount rate causes an increase in LCOE, while a decrease in the discount rate causes a decrease in LCOE. In the case of the V3000 WTG, increasing the discount rate by 2% (from 8% −10%) resulted in an increase of approximately 18% in the unit cost of electricity. Figure 13 shows the effect of foundation cost on the LCOE. If the cost of the foundation is increased from 10% to 20% of the initial cost for the SWT-6 wind turbine, the LCOE will increase from 0.060 $/kWh to 0.063 $/kWh (a 4% increase in the cost of electricity).
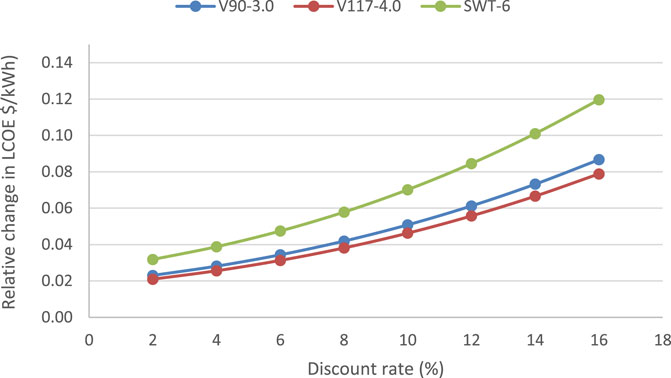
FIGURE 12. Effect of varying discount rates on the LCOE.
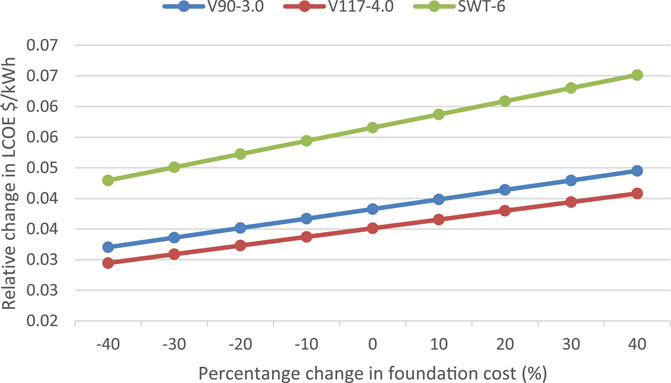
FIGURE 13. Effect of varying foundation costs on the LCOE.
The effect of changing the project’s lifespan from 16 to 30 years is shown in Figure 14. It was observed that increasing the turbine lifespan lowers the cost of energy production; on the contrary, shortening the turbine lifetime significantly increases the LCOE. The LCOE was reduced by 31% when the lifespan of the V117 turbine was increased from 20 to 25 years, demonstrating that extending the turbine lifespan has a significant favorable impact on the LCOE. This explains why a well-maintained wind turbine has minimal unplanned shutdowns, and the turbulence effect is preferable from an economic standpoint.
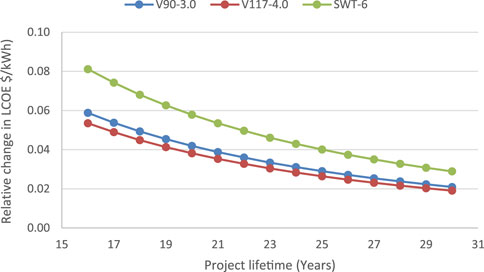
FIGURE 14. Effect of turbine lifetime on the LCOE.
5 Conclusion
The first step in the development of a wind farm project is the wind energy resource assessment. It serves as a tool for the selection of the most viable sites by examining the sites to determine if there is enough wind potential, and it also provides a basis for the selection of a suitable wind turbine for the location. The study findings can be summarized as follows:
1. In terms of the WPD, all the offshore sites outperformed the coastal sites; for example, the WPD at offshore-04 is four times greater than the potential at Apapa Port. The highest potential in the coastal region was observed at Apapa with a WPD of 88 W/m2, while the offshore-04 had the highest potential when considering offshore sites (361 W/m2).
2. According to the International Electrotechnical Commission (IEC) classification 61400, the offshore sites evaluated in this study can be categorized as “class IIIb” sites. This means that the sites are moderately suitable for the harvest of wind energy, and if harnessed, it could supplement the energy deficit in the country and reduce the country’s carbon footprint.
3. All the sites have their most prominent wind from the south-south-western direction, i.e., between the 191.25 and 213.75 segments, although the magnitude of the occurrences varies from site to site (between 41% and 19%). Offshore regions showed the greatest wind direction variability, which was accompanied by higher mean wind speeds.
4. The result from the study also shows that the Vesta V-117 model (4-MW offshore wind turbine model) is best suited for energy generation in the region compared to the other two wind turbines considered. The outstanding performance of the V-117 model at a lower mean speed is due to its relatively lower cut-in speed.
5. The net gains from investing in a 60-MW wind farm in the region can be as high as $62,000,000.00, while the project payback time can be as low as 5.74 years.
6. The LCOE of the offshore site showed that irrespective of the type of the turbine used, the cost of electricity from the offshore site was less than 0.07 $/kWh, which is less than the country’s current electricity tariff (0.075 $/kWh).
7. The offshore sites have great potential for energy harvesting even with an 8% discount rate used in this work. If the federal government of Nigeria decreases the discount rate on wind energy projects or grants tax waivers for offshore wind projects, the viability of these projects will be increased.
Data availability statement
The raw data supporting the conclusion of this article will be made available by the authors, without undue reservation.
Author contributions
AA and OA carried out conceptualization and drafting of the research work. SO and SA carried out proof reading and editing of the report. All authors contributed to the article and approved the submitted version.
Acknowledgments
The authors thank Afe Babalola University, Ado-Ekiti (ABUAD), for the financial support offered to publish this research.
Conflict of interest
The authors declare that the research was conducted in the absence of any commercial or financial relationships that could be construed as a potential conflict of interest.
Publisher’s note
All claims expressed in this article are solely those of the authors and do not necessarily represent those of their affiliated organizations, or those of the publisher, the editors, and the reviewers. Any product that may be evaluated in this article, or claim that may be made by its manufacturer, is not guaranteed or endorsed by the publisher.
References
Adaramola, M., Agelin-Chaab, M., and Paul, S. S. (2014). Assessment of wind power generation along the coast of Ghana. A Journal of Energy Conversion and Management 77, 61–69. doi:10.1016/j.enconman.2013.09.005
Ahmed, A. S. (2018). Wind resource assessment and economics of electric generation at four locations in Sinai Peninsula, Egypt. J. Clean. Prod. 183, 1170–1183. doi:10.1016/j.jclepro.2018.02.182
Ajayi, O. O., Fagbenle, R. O., James, K., JuliusNdambuki, M., Omole, D. O., and Badejo, A. A. (2014). Wind energy study and energy cost of wind electricity generation in Nigeria: Past and recent results and a case study for South West Nigeria. Energies 7 (12), 8508–8534. doi:10.3390/en7128508
Ajayi, O. O. (2009). Assessment of utilization of wind energy resources in Nigeria. Energy Policy 37 (2), 750–753. doi:10.1016/j.enpol.2008.10.020
AjayiOjoVasel, O. O. O. A., and Vasel, A. (2019). On the need for the development of low wind speed turbine generator system. IOP Conf. Ser. Earth Environ. Sci. 331, 1–12. 012062. doi:10.1088/1755-1315/331/1/012062
Al-Mhairat, B., and Al-Quraan, A. (2022). Assessment of wind energy resources in Jordan using different optimization techniques. Processes 10 (1), 105. doi:10.3390/pr10010105
Ale, T., and Adeyemi, A. (2022). Electricity demand pattern and supply availability on Nigeria grid system. J. Appl. Sci. Process Eng. 9 (1), 1042–1053. doi:10.33736/jaspe.4264.2022
Amole, A. O., Oladipo, S., Olabode, O. E., Makinde, K. A., and Gbadega, P. (2023). Analysis of grid/solar photovoltaic power generation for improved village energy supply: A case of ikose in Oyo state Nigeria. Renew. Energy Focus 44, 186–211. doi:10.1016/j.ref.2023.01.002
Asamoah, S. S., Parbey, J., Yankey, I. K., and Awuah, A. (2023). Techno-economic assessment of a central grid-connected wind farm in Ghana using RETScreen® expert. Heliyon 9, e12902. doi:10.1016/j.heliyon.2023.e12902
Ayodele, T. R., Ogunjuyigbe, A. S. O., and Amusan, T. O. (2018). Techno-economic analysis of utilizing wind energy for water pumping in some selected communities of Oyo State, Nigeria. Renew. Sustain. Energy Rev. 91, 335–343. doi:10.1016/j.rser.2018.03.026
Ben, U. C., Akpan, A. E., Mbonu, C. C., and Ufuafuonye, C. H. (2021). Integrated technical analysis of wind speed data for wind energy potential assessment in parts of southern and central Nigeria. Clean. Eng. Technol. 2, 100049. doi:10.1016/j.clet.2021.100049
Chancham, C., Waewsak, J., and Gagnon, Y. (2017). Offshore wind resource assessment and wind power plant optimization in the Gulf of Thailand. Energy 1139, 706–731. doi:10.1016/j.energy.2017.08.026
Chanchangi, Y., Adu, F., Ghosh, A., Sundaram, S., and Mallick, T. (2022). Nigeria's energy review: Focusing on solar energy potential and penetration. Environ. Dev. Sustain. 25, 5755–5796. doi:10.1007/s10668-022-02308-4
Climatscope-BloombergNEF Nigeria energy (2021). Climatscope-BloombergNEF Nigeria energy report. Available at: https://global-climatescope.org/markets/ng/.
Crippa, P., Alifa, M., Bolster, D., Genton, M. G., and Castruccio, S. (2021). A temporal model for vertical extrapolation of wind speed and wind energy assessment. Appl. Energy 301, 117378. doi:10.1016/j.apenergy.2021.117378
Dai, H., Li, N., Wang, Y., and Zhao, X. (2022). “March). The analysis of three main investment criteria: NPV IRR and Payback Period,” in 2022 7th International Conference on Financial Innovation and Economic Development (ICFIED 2022), Harbin, China, January21-23, 2022 (Amsterdam, Netherlands: Atlantis Press), 185–189.
Fan, Z., Li, S., Gao, Z., Zhang, L., Zheng, X., Zhu, W., et al. (2023). On the importance of wind turbine wake boundary to wind energy and environmental impact. Energy Convers. Manag. 277, 116664. doi:10.1016/j.enconman.2023.116664
Fatigun, A. T., Akoshile, C. O., Ajibola, T. B., and Salau, R. O. (2017). Evaluation of wind energy potential of Ikeja, Southwest, Nigeria using two-parameter weibull distribution function. Evaluation 7 (09).
Göçmen, T., and Özerdem, B. (2012). Airfoil optimization for noise emission problem and aerodynamic performance criterion on small scale wind turbines. Energy 46 (1), 62–71. doi:10.1016/j.energy.2012.05.036
Harrucksteiner, A., Thakur, J., Franke, K., and Sensfuß, F. (2023). A geospatial assessment of the techno-economic wind and solar potential of Mongolia. Sustain. Energy Technol. Assessments 55, 102889. doi:10.1016/j.seta.2022.102889
Imani, M., Fakour, H., Lan, W. H., Kao, H. C., Lee, C. M., Hsiao, Y. S., et al. (2021). Application of rough and fuzzy set theory for prediction of stochastic wind speed data using long short-term memory. Atmosphere 12 (7), 924. doi:10.3390/atmos12070924
Jabbar, R. I. (2021). Statistical analysis of wind speed data and assessment of wind power density using weibull distribution function (case study: Four regions in Iraq). J. Phys. Conf. Ser. 1804 (1), 012010. IOP Publishing. doi:10.1088/1742-6596/1804/1/012010
Jacquemin, J., Butterworth, D., Garret, C., Baldock, N., and Henderson, A. (2011). Inventory of location specific wind energy cost. Bristol, United Kingdom: Garrad Hassan Partners, 58.
Jang, D., Kim, K., Kim, K. H., and Kang, S. (2022). Techno-economic analysis and Monte Carlo simulation for green hydrogen production using offshore wind power plant. Energy Convers. Manag. 263, 115695. doi:10.1016/j.enconman.2022.115695
Khan, T., Theppaya, T., and Taweekun, J. (2022). Wind resource assessment of northern part of Thailand. Ain Shams Eng. J. 14, 102025. doi:10.1016/j.asej.2022.102025
Klerk, M. G. D., and Venter, W. C. (2017). Power calculation accuracy as a function of wind data resolution. J. energy South. Afr. 28 (2), 1–14. doi:10.17159/2413-3051/2017/v28i2a1656
Koholé, Y. W., Fohagui, F. C. V., Djiela, R. H. T., and Tchuen, G. (2023). Wind energy potential assessment for co-generation of electricity and hydrogen in the far North region of Cameroon. Energy Convers. Manag. 279, 116765. doi:10.1016/j.enconman.2023.116765
Li, M., Cao, S., Zhu, X., and Xu, Y. (2022). Techno-economic analysis of the transition towards the large-scale hybrid wind-tidal supported coastal zero-energy communities. Appl. Energy 316, 119118. doi:10.1016/j.apenergy.2022.119118
Mansi, A., and Aydin, D. (2022). The impact of trailing edge flap on the aerodynamic performance of small-scale horizontal axis wind turbine. Energy Convers. Manag. 256, 115396. doi:10.1016/j.enconman.2022.115396
Martinez, A., and Iglesias, G. (2022). Mapping of the levelised cost of energy for floating offshore wind in the European Atlantic. Renew. Sustain. Energy Rev. 154, 111889. doi:10.1016/j.rser.2021.111889
Martinez, A., and Iglesias, G. (2021). Multi-parameter analysis and mapping of the levelised cost of energy from floating offshore wind in the Mediterranean Sea. Energy Convers. Manag. 243, 114416. doi:10.1016/j.enconman.2021.114416
Mattar, C., and Guzman-Ibarra, M. C. (2017). A techno-economic assessment of offshore wind energy in Chile. Energy 133, 191–205. doi:10.1016/j.energy.2017.05.099
Moller, B., Hong, L., Lonsing, R., and Hvelplund, F. (2012). Evaluation of offshore wind resources by scale of development. Energy 48 (3), 314–322. doi:10.1016/j.energy.2012.01.029
National Renewable Energy Action Plans (2015). A policy document by ministry of power federal republic of Nigeria. Nigeria: Energypedia, 5–9.
Noel, W., Weis, T. M., Yu, Q., Leach, A., and Fleck, B. A. (2022). Mapping the evolution of Canada’s wind energy fleet. Renew. Sustain. Energy Rev. 167, 112690. doi:10.1016/j.rser.2022.112690
Oladigbolu, J. O., Al-Turki, Y. A., and Olatomiwa, L. (2021). Comparative study and sensitivity analysis of a standalone hybrid energy system for electrification of rural healthcare facility in Nigeria. Alexandria Eng. J. 60 (6), 5547–5565. doi:10.1016/j.aej.2021.04.042
Olaofe, Z. O. (2017). Assessment of the offshore wind speed distributions at selected stations in the south-west coast, Nigeria. Int. J. Renew. Energy Res. 7 (2), 565–577. doi:10.20508/ijrer.v7i2.5439.g7031
Oyewole, J. A., Aweda, F. O., and Oni, D. (2019). Comparison of three numerical methods for estimating weibull parameters using weibull distribution model in Nigeria. Niger. J. Basic Appl. Sci. 27 (2), 08–15. doi:10.4314/njbas.v27i2.2
Ozioko, I. O., Ugwuanyi, N. S., Ekwue, A. O., and Odeh, C. I. (2022). Wind energy penetration impact on active power flow in developing grids. Sci. Afr. 18, e01422. doi:10.1016/j.sciaf.2022.e01422
Ramadhan, R., and Farizal, F. (2021). Feasibility analysis of renewable energy alternative selection in rural areas using zero energy building concept. J. Phys. Conf. Ser. 1858 (1), 012089. IOP Publishing. doi:10.1088/1742-6596/1858/1/012089April
Richard, M. O. N., and Eseosa, O. (2022). Evaluation of wind energy potentials in some selected areas in the six geo-political regions in Nigeria. J. Altern. Renew. Energy Sources 8 (1), 20–37. doi:10.46610/joares.2022.v08i01.004
Rinaldi, G., Garcia-Teruel, A., Jeffrey, H., Thies, P. R., and Johanning, L. (2021). Incorporating stochastic operation and maintenance models into the techno-economic analysis of floating offshore wind farms. Appl. Energy 301, 117420. doi:10.1016/j.apenergy.2021.117420
Salakhetdinov, E., and Agyeno, O. (2020). Achieving energy security in africa: Prospects of nuclear energy development in south Africa and Nigeria. Afr. J. Sci. Technol. Innovation Dev. 14 (1), 22–30. doi:10.1080/20421338.2020.1799538
Sasser, C., Yu, M., and Delgado, R. (2022). Improvement of wind power prediction from meteorological characterization with machine learning models. Renew. Energy 183, 491–501. doi:10.1016/j.renene.2021.10.034
Schweizer, J., Antonini, A., Govoni, L., Gottardi, G., Archetti, R., Supino, E., et al. (2016). Investigating the potential and feasibility of an offshore wind farm in the Northern Adriatic Sea. Appl. Energy 177, 449–463. doi:10.1016/j.apenergy.2016.05.114
Siemens-Gemesa (2016). Siemens SWT 6.0-154; 6 MW Offshore Wind Turbine data sheet. Available at: http://www.seimensgemesa.com.
Shu, T., Song, D., and Joo, Y. H. (2022). Non-centralised coordinated optimisation for maximising offshore wind farm power via a sparse communication architecture. Appl. Energy 324, 119705. doi:10.1016/j.apenergy.2022.119705
Shu, Z. R., Li, Q. S., and Chan, P. W. (2015). Investigation of offshore wind energy potential in Hong Kong based on Weibull distribution function. Appl. Energy 156, 362–373. doi:10.1016/j.apenergy.2015.07.027
Sørensen, J. N., and Larsen, G. C. (2021). A minimalistic prediction model to determine energy production and costs of offshore wind farms. Energies 14, 448. doi:10.3390/en14020448
Sumair, M., Aized, T., Bhutta, M. M. A., Siddiqui, F. A., Tehreem, L., and Chaudhry, A. (2022). Method of Four Moments Mixture-A new approach for parametric estimation of Weibull Probability Distribution for wind potential estimation applications. Renew. Energy 191, 291–304. doi:10.1016/j.renene.2022.04.054
Sumair, M., Aized, T., Gardezi, S. A. R., Ur Rehman, S. U., and Rehman, S. M. S. (2021). Wind potential estimation and proposed energy production in Southern Punjab using Weibull probability density function and surface measured data. Energy Explor. Exploitation 39 (6), 2150–2168. doi:10.1177/0144598720920748
Thambain, M., and Storm, B. (2012)“Implications of the Weibull k factor in resource assessment,” in 2nd Latin American Congress of Wind Engineering, National University of La Plata, Argentina, December 5–7, 2012.
Tuy, S., Lee, H. S., and Chreng, K. (2022). Integrated assessment of offshore wind power potential using Weather Research and Forecast (WRF) downscaling with Sentinel-1 satellite imagery, optimal sites, annual energy production and equivalent CO2 reduction. Renew. Sustain. Energy Rev. 163, 112501. doi:10.1016/j.rser.2022.112501
United States Agency for International development (2022). Power africa project. Available at: www.usaid.gov/powerafrica.
Usta, I. (2016). An innovative estimation method regarding Weibull parameters for wind energy applications. Energy 106, 301–314. doi:10.1016/j.energy.2016.03.068
Vestas Americas (2014). Vesta V90-3 MW Offshore Wind Turbine data sheet. Available at: http://www.vestas.com.
Vestas Americas (2017). Vesta V117- 4 MW Offshore Wind Turbine data sheet. Available at: http://www.vestas.com.
Wiser, R., Bolinger, M., and Lantz, E. (2019). Assessing wind power operating costs in the United States: Results from a survey of wind industry experts. Renew. Energy Focus 30, 46–57. doi:10.1016/j.ref.2019.05.003
Keywords: wind energy, resource assessment, Nigeria offshore, energy output, net present value, simple payback time, levelized cost of electricity
Citation: Attabo AA, Ajayi OO, Oyedepo SO and Afolalu SA (2023) Assessment of the wind energy potential and economic viability of selected sites along Nigeria’s coastal and offshore locations. Front. Energy Res. 11:1186095. doi: 10.3389/fenrg.2023.1186095
Received: 14 March 2023; Accepted: 11 July 2023;
Published: 27 July 2023.
Edited by:
Athanasios I. Papadopoulos, Centre for Research and Technology Hellas (CERTH), GreeceReviewed by:
Giovanni Bracco, Polytechnic University of Turin, ItalyAlexios-Spyridon Kyriakides, Centre for Research and Technology Hellas (CERTH), Greece
Copyright © 2023 Attabo, Ajayi, Oyedepo and Afolalu. This is an open-access article distributed under the terms of the Creative Commons Attribution License (CC BY). The use, distribution or reproduction in other forums is permitted, provided the original author(s) and the copyright owner(s) are credited and that the original publication in this journal is cited, in accordance with accepted academic practice. No use, distribution or reproduction is permitted which does not comply with these terms.
*Correspondence: Ameh A. Attabo, YW1laC5hdHRhYm9Ac3R1LmN1LmVkdS5uZw==; Oluseyi O. Ajayi, b2x1c2V5aS5hamF5aUBjb3ZlbmFudHVuaXZlcnNpdHkuZWR1Lm5n