 Liwei Ju1*
 Qingqing Zhou
- 1School of Economics and Management, North China Electric Power University, Beijing, China
- 2Beijing New Energy Smart Internet Technology Co., Ltd., Beijing, China
- 3Beijing Key Laboratory of New Energy and Low-Carbon Development, North China Electric Power University, Beijing, China
To optimize the utilization of rural biomass waste resources (e.g., straw and solid waste), biomass waste energy conversion (BWEC) and carbon cycle utilization (CCU) are integrated into a traditional virtual power plant, i.e., a rural BWEC-CCU-based virtual power plant. Furthermore, a fuzzy robust two-stage dispatching optimal model for the BWEC-CCU-based virtual power plant is established considering the non-determinacy from a wind power plant (WPP) and photovoltaic (PV) power. The scheduling model includes the day-ahead deterministic dispatching model and real-time uncertainty dispatching model. Among them, in the day-ahead dispatching phase, the dispatching plan is formulated with minimum operating cost and carbon emission targets. In the real-time dispatching phase, the optimal dispatching strategy is formulated aiming at minimum deviation adjustment cost by applying the Latin hypercube sampling method. The robust stochastic theory is used to describe the uncertainty. Third, in order to achieve optimal distribution of multi-agent cooperation benefits, a benefit distribution strategy based on Nash negotiation is designed considering the three-dimensional interfering factor of the marginal benefit contribution, carbon emission contribution, and deviation risk. Finally, a rural distribution network in Jiangsu province, China, is selected for case analysis, and the results show that 1) the synergistic optimal effect of BWEC and CCU is obvious, and the operation cost and deviation adjustment cost could decrease by 26.21% and 39.78%, respectively. While the capacity ratio of WPP + PV, BWEC, and CCU is 5:3:2, the dispatching scheme is optimum. 2) This scheduling model can be used to formulate the optimal scheduling scheme. Compared with the robust coefficient Γ = 0, when Γ = 1, the WPP and PV output decreased by 15.72% and 15.12%, and the output of BWEC and CCU increased by 30.7% and 188.19%, respectively. When Γ∈ (0.3, 0.9), the growth of Γ has the most direct impact on the dispatching scheme. 3) The proposed benefit equilibrium allocation strategy can formulate the most reasonable benefit allocation plan. Compared with the traditional benefit allocation strategy, when the proposed method is used, the benefit share of the WPP and PV reduces by 5.2%, and the benefit share of a small hydropower station, BWEC, and CCU increases by 1.7%, 9.7%, and 3.8%, respectively. Overall, the proposed optimal dispatching and benefit allocation strategy could improve the aggregated utilization of rural biomass waste resources and distributed energy resources while balancing the benefit appeal of different agents.
1 Introduction
1.1 Research background
There is a large amount of biomass waste resources in the rural areas in China, such as straw, waste, and domestic sewage. The total biomass waste resources in 2021 were 1.2 × 10⁹ tons (Yang et al., 2022). The traditional extensive utilization method causes great ecological damage and has low economic efficiency. Biomass waste energy conversion (BWEC) could improve the environmental protection and economy of resource utilization, which will become a new way of utilizing biomass waste resources (Ning and You, 2019). At the same time, the lower population density provides abundant space resources for the rural distributed power generation sources. The rooftop-distributed photovoltaics pilot program in the whole county (city and district) has already been carried out in China. It has greatly promoted the development of rural-distributed photovoltaics (National Energy Administration, 2021). Energy consumption in the agricultural sector is significant, reaching 20% of the total energy consumption in China (Fu and Niu, 2022). However, because the interconnection foundation is weak and the interconnection foundation is low, the decentralized energy resources are hardly directly connected to the power network. To solve the aforementioned problem, the concept of the virtual power plant (VPP) is proposed with the development of the advanced communication technology and software architecture (Daniel and Juan, 2023). Therefore, how to apply the VPP to realize the aggregation management of the geographically distributed resources in rural areas is important.
In 2021, China proposed a “double-carbon” target of “peak carbon emissions by 2030 and 2060 carbon neutralization” and launched the national carbon trading market (Zhang et al., 2021). The deployment of rural energy projects is an effective way to achieve dual-carbon goals and accelerate agricultural modernization in rural areas (Fu and Zhou, 2023). Rural areas have low energy consumption density and strong environmental bearing space. If the carbon emissions produced by BWEC can be handled properly, the environmental advantages of rural areas will be turned into economic benefits (Bokde et al., 2020). In fact, BWEC mainly includes pyrolysis power generation (PG), anaerobic biogas (AB), sewage treatment (ST), and biogas to gas (B2G). During the energy conversion process of biomass waste, the energy cascade utilization could be realized by coordinately providing electricity, heating, and gas output. However, the energy conversion process will also lead to carbon emission, and the gas-power plant carbon capture (GPPCC) could be used to capture CO2, which could be converted into CH4 by the power-to-gas (P2G) conversion (Ju et al., 2022). Therefore, this study proposes a new concept of a BWEC-CCU-based VPP (BECU-VPP) for rural areas, which could control carbon emissions while fully converting and utilizing rural biomass waste resources.
1.2 Literature review
At present, domestic and foreign scholars have put forward some research studies on the integration of BWEC and CCU with the power system. For instance, the combination of BWEC and combined heating and power (CHP) can solve the problem of “following the thermal load” of CHP units (Wang and Duan, 2020). Middelhoff et al. (2022 established hybrid concentrated solar biomass systems for cogeneration. Chen et al. (2022) studied the mathematical model of energy supply for waste incineration power plants. On the other hand, CCU is mainly used to capture CO2 of gas-fired generator sets and convert it into CH4 for power generation. China’s first GPPCC industrial-scale demonstration plant has been put into operation in Datang International Beijing Gaojing Thermal Power Plant successfully (Panah et al., 2020). Rahimi et al. (2022) proposed a stochastic optimal dispatching model incorporating a carbon capture power plant. Budny et al. (2015) proposed a coordinated model for peak shaving and valley filling through P2G and gas turbines. BWEC and CCU have been proved to be feasible in urban power systems. However, the distribution of rural energy resources is significant, and the traditional network-centralized control mode is difficult to achieve. It is necessary to perform aggregation control from the communication level by using a VPP (Cavazzini et al., 2021). This brings a new challenge of how to integrate BWEC and CCU into the conventional VPP. Therefore, this study focuses on the optimal dispatching and benefit equilibrium allocation strategy of the rural BECU-VPP.
The research of VPP optimal dispatching mainly focuses on how to deal with uncertain factors and the introduction of specific optimization methods, such as a wind power plant (WPP), photovoltaic (PV) power, and load, and construct the optimal uncertainty dispatching scheme (Ju et al., 2016). Fu (2022) introduced statistical machine learning (SML) techniques to carry out multi-scenario-based probabilistic power flow calculations. Cao et al. (2022) proposed an equivalent mixed-integer linear programming reformulation method to cope with the original non-linear partial differential optimization problem for computational tractability improvements. Generally speaking, the uncertainty could be handled by the probabilistic planning method or the robust optimization theory. The former mainly describes system constraints as chance constraints based on the probability distribution of the uncertainty variables (Ahmad, 2022). For example, Tan et al. (2017)and Ahn and Han (2018) described the uncertainty risk by using the Latin hypercube sampling method and stochastic programming approach, respectively. However, this method depends on the information of probability distribution, and it is difficult to obtain the probability distribution accurately. This method depends on the information of probability distribution, and it is difficult to obtain the probability distribution accurately. The latter mainly uses the parameter interval to describe the uncertainty and only requires little parameter information. For example, Ju et al. (2016) and Kong et al. (2020) discussed the impact of uncertainty factors on the VPP’s dispatching strategy. The development of the uncertainty analysis methods has been promoted as a scheme to satisfy the scheduling requirements. However, the proposed method can only be used for single-time-scale uncertainty analysis. In reality, rural BECU-VPP scheduling is a multi-time-scale optimization problem, dispatching, and real-time deviation adjustment (Rahimi et al., 2022). Therefore, how to integrate the robust stochastic optimal methods into multi-time-scale dispatching is a key issue. This study constructs a robust two-stage optimal dispatching method by dividing the dispatching phase into the day-ahead stage and real-time stage.
In addition, the BECU-VPP mainly includes three modules: BWEC, CCU, and VPP. There are multiple unit agents in each module, and how to establish the optimal cooperative operation benefit allocation method is the key premise for the mutual cooperation of different agents (Li et al., 2022). The existing research studies mainly use the Shapley value algorithm to carry out the allocation of cooperation benefits. For example, Sui et al. (2019)and Voswinkel et al. (2022) applied this concept, and the cost of congestion management can be shared among grid elements and the revenue of the building-integrated-photovoltaics community. As can be seen, the development of the Shapley value method has been promoted as an available benefit allocation strategy of the virtual power plant. The aforementioned research mainly measures the contribution of different agents to incremental costs or benefits from the perspective of cost or benefit. However, the VPP needs to balance multidimensional objectives such as economy, environment, and risk, rather than a single-dimensional benefit allocation problem (Ju et al., 2019). In fact, from the perspective of the optimal process of the BECU-VPP, different agents are adjusting their output plans according to their own operating demands to achieve the overall optimal goal. This process is similar to the negotiation process, and the Nash negotiation theory can just reflect the multidimensional negotiation needs. The aforementioned multidimensional benefit allocation problem can be solved by applying Nash negotiation to benefit allocation. Therefore, this study introduces the Nash negotiation theory to form an operation benefit allocation strategy combining three factors: marginal benefit contribution, carbon emission contribution, and deviation risk factor.
1.3 Main contributions and novelty
On the basis of the aforementioned analysis, optimal dispatching of the rural BECU-VPP has been studied. Most of these studies have already discussed the feasibility of the integration of BWEC and CCU with the power system, while existing studies rarely consider the distribution features of rural energy resources and the weak interconnection foundation. The aforementioned work has also made some progress in the optimal dispatching model and benefit allocation method, especially the application of the Shapley value on the allocation of cooperation benefits. However, through the comparison of relevant research results, it is found that there are some prominent problems in the optimal dispatching of the rural BECU-VPP, which are as follows:
1 The existing studies have discussed the impact of BWEC and CCU on urban energy systems. However, the features of rural energy distribution are significant, and the traditional network-centralized control mode is difficult to achieve. This brings a new challenge of how to integrate BWEC and CCU into the conventional VPP, i.e., the rural BECU-VPP.
2 The existing research is more restricted to optimal scheduling on a single time scale, although it is proven that robust stochastic optimal methods can better describe the uncertainty. In fact, the scheduling of the BECU-VPP is a two-stage decision problem, and the combination of two-stage optimization and robust stochastic optimization is the key issue.
3 The optimal scheduling of the BECU-VPP depends on the cooperative operation of multiple agents. The Shapley value method can only consider the cost or benefit of a single dimension and cannot integrate multidimensional influences, although the method has been validated for cooperative benefit allocation.
In a word, all the aforementioned analyses prompt us to try to integrate BWEC and CCU into a traditional VPP. Then, a robust two-stage optimal dispatching method is developed with embedded day-ahead deterministic scheduling and real-time uncertainty scheduling. Then, a cooperation benefit allocation strategy considering marginal benefit contribution, carbon emission contribution, and deviation risk factors is prepossessed on the basis of the Nash negotiation method. The main innovations of this study are summarized as follows.
• Different from the traditional configuration strategy of the VPP (Panah et al., 2020; Chen et al., 2022; Middelhoff et al., 2022), which only discussed the feasibility of BWEC and CCU in an urban power system, a novel rural BECU-VPP is designed by integrating BWEC and CCU into a traditional VPP. BWEC can classify and treat rural biomass waste resources and provide electricity, heating, and gas output. CCU includes a GPPCC, P2G, and carbon storage (CS). The GPPCC captures CO2 produced by BWEC and performs methanation with H2 produced by P2G to generate CH4.
• Unlike some studies (Budny et al., 2015; Ju et al., 2016; Tan et al., 2017; Cavazzini et al., 2021; Ahmad, 2022; Cao et al., 2022; Fu, 2022), which are limited to the uncertainty analysis of a single time scale, this study discussed the multi-time-scale optimal scheduling problem and constructs a fuzzy robust two-stage optimal scheduling model. In the day-ahead scheduling phase, the dispatching plan is formulated with minimize operating costs and carbon emissions. In the real-time dispatching phase, the optimal dispatching strategy is formulated aiming at the minimum deviation adjustment cost by applying the Latin hypercube sampling method and the robust stochastic theory to describe the uncertainty.
• Compared with previous studies (Ju et al., 2019; Sui et al., 2019; Wang et al., 2021; Voswinkel et al., 2022), carbon emission contribution and deviation risk factors are also introduced into the tradition cooperation benefit allocation. To achieve the reasonable benefit allocation strategy, this study proposes a BECU-VPP benefit distribution strategy based on Nash negotiation considering the contribution of the marginal income, carbon emission, and deviation risk factor. The utility functions of risk preference, risk neutrality, and risk aversion for different types of unit agents are set to calculate the contribution to the marginal benefit, carbon emissions, and deviation risk. The comprehensive negotiation score and the final share of cooperation benefit obtained by different agents could be obtained.
1.4 Main structure of the paper
The remaining parts of this paper are as follows. Section 2 designs a rural BECU-VPP. Then, Section 3 constructs a fuzzy robust two-stage optimal scheduling model, including a day-ahead deterministic dispatching model, real-time uncertainty dispatching model, and fuzzy robust two-stage dispatching model solution. Furthermore, Section 4 proposes a benefit equilibrium distribution strategy based on Nash negotiation considering marginal income contribution and the deviation risk factor. Finally, Section 5 selects a rural distribution network in Jiangsu province, China, as the simulation example. Section 6 emphasizes the conclusions of the study.
2 Rural BECU-VPP structure and modeling
2.1 Structure description
This study integrates BWEC and CCU into a conventional VPP, i.e., a novel rural BECU-VPP, for the abundant biomass waste resources and decentralized energy resources in rural areas. In the BWEC module, PG pyrolyzes biomass waste to generate electricity, AB-ST gasifies biomass waste into biogas, and B2G converts biogas into natural gas. The VPP module integrates the WPP and photovoltaic and small hydropower station (SHS). An electric vehicle-to-grid aggregator (EVA) is set as an agent of rural electric vehicles, and demand response integrators are set as an agent of small-scale industrial load, agricultural load, and resident flexibility load. In the CCU module, the GPPCC captures CO2 emitted by BWEC and converts CO2 to CH4 by P2G and generates electricity again. Figure 1 is a schematic structural diagram of a rural BECU-VPP.
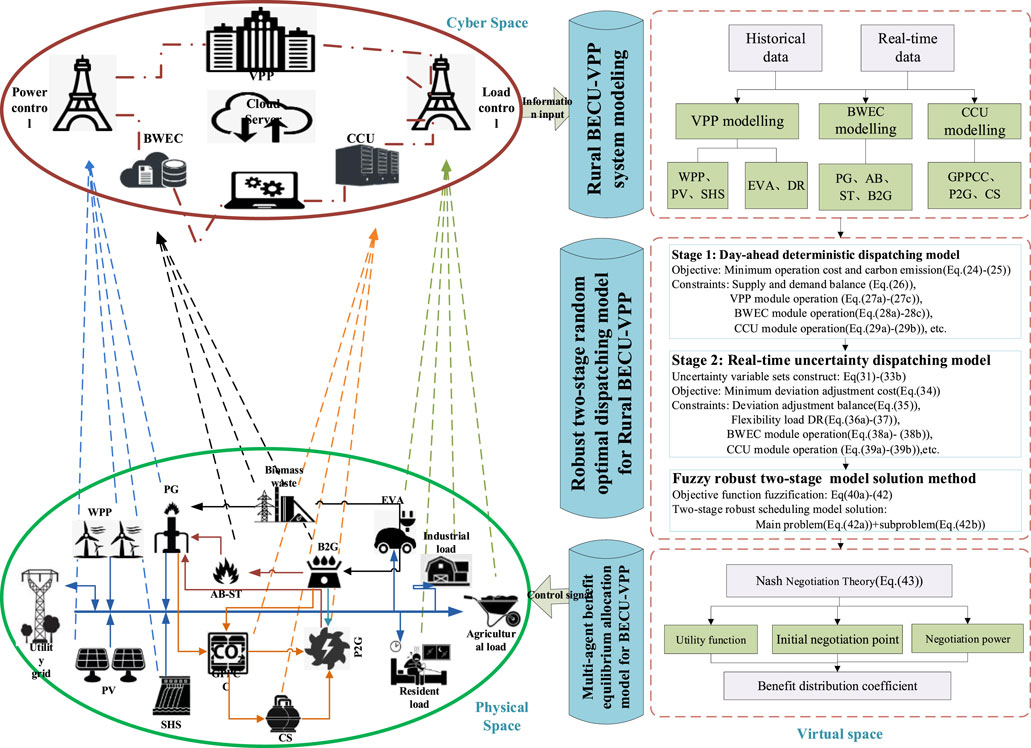
FIGURE 1. Structure diagram of a rural BECU-VPP.
As shown in Figure 1, the BECU-VPP operates in three main areas, i.e., collecting the operation information of different units in the physical space, transmitting to the cyber space, and realizing the system modeling of the BECU-VPP. After system modeling is completed, according to the input information of different units, the virtual space introduces a robust two-stage optimal method to construct a day-ahead deterministic scheduling model and real-time uncertain dispatching model. Finally, the optimal dispatching scheme is passed to the multi-agent Nash negotiation-based benefit equilibrium allocation method, which could be used to share the cooperative operation benefits of different agents.
2.2 Operation modeling
2.2.1 VPP operation modeling
The VPP mainly includes three parts: distributed power generation sources, EVA, and flexible response to load demand. The main modeling is as follows.
2.2.1.1 Distributed power generation sources
Due to uncertain external weather conditions, the output of the WPP and photovoltaics is uncertain, and how to describe the uncertainties is important for the dispatching of the VPP. Daniel and Juan (2023) proved that the Weibull distribution can describe the natural wind speed, and the Beta distribution can describe the solar radiation intensity. The output model is constructed as follows:
The power generation of the SHS mainly depends on river runoff and water head height. If the water supply can be adjusted when equipping the regulating reservoir, the output model of the SHS is as follows:
According to Eqs 1–3, when the wind speed, solar radiation intensity, and initial data of the regulating reservoir are known, the power output of the WPP, PV, and SHS can be calculated at time t.
2.2.1.2 Electric vehicle aggregator
There are a large number of electric tricycles and electric motorcycles and a small number of electric vehicles in rural areas. If the electric vehicle is represented by the aggregator and charge according to the distribution of the net load, it can provide flexibility adjustment capability. Then, the recursive relationship between the quantity of electric vehicles connected to the EVA at time t + 1 and at time t is as follows (Wang et al., 2021):
Assuming that electric vehicle types are the same, the electricity stored in the EVA is calculated as follows:
Eqs 5–7 calculate the stored and released electricity of the EVA at time t.
2.2.1.3 Flexible load demand response
The flexible load in rural areas mainly comes from resident load, small industrial load, and agricultural load. There is almost no adjustable commercial load in rural areas. The response mode of these flexible loads is shiftable, incentive, cut, etc. For example, the industrial load is relatively flexible, and the production plan can be adjusted on the basis of the real-time electricity price to realize load cut and load incentive. The resident load belongs to the necessary electricity load, some temperature control load can be shifted, and some lighting load can be cut. The agricultural load belongs to the rigid load, and the load shift can only adjust the production working time or the charging time of the power storage equipment. Table 1 shows the demand response modes for different flexible loads in rural areas.

TABLE 1. Rural flexible load demand response modes.
According to the demand response modes of the resident load, small industrial load, and agricultural load given in Table 1, the demand response of the flexible load in rural areas is modeled (Huang et al., 2019).
2.2.1.3.1 Small industrial load demand response
Industrial high-energy load could take part in the optimal scheduling of the VPP because it has strong flexibility, and the main form includes interruptible and incentive load.
Eq. 8 calculates the power output from the small industrial load demand response including two terms, namely, the power output from interruptible load and the power output from incentive load.
2.2.1.3.2 Agricultural load demand response
Some agricultural loads are necessary, and some are shiftable, but they are difficult to cut. It can only participate in the coordinated control of the VPP by the shifting load.
Eq. 9 calculates the power output from the agricultural load demand response.
2.2.1.3.3 Resident load demand response
Part of the resident load is the necessary load and part is the shiftable load. There are also some interruptible loads, which can only participate in the coordinated control of the VPP by interruptible and shifting loads.
Eq. 12 calculates the power output from resident load demand response including two terms, namely, the power output from the interruptible load and the power output from the shiftable load.
2.2.2 BWEC operation modeling
Referring to the literature (Teng et al., 2021), a rural biomass waste energy conversion system is constructed considering multiple waste disposal methods. BWEC mainly includes units such as PG, AB, ST, and B2G. Figure 2 shows the energy conversion system of rural biomass waste.
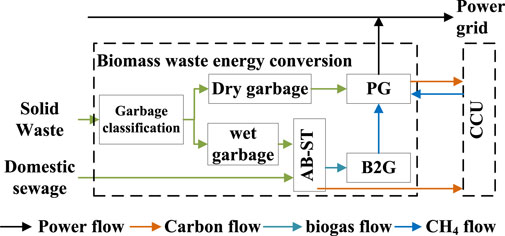
FIGURE 2. Structure of an energy conversion system of rural biomass waste.
According to Figure 2, PG is used to pyrolyze and gasify biomass waste for generating electricity and heating supply. The supply and demand balance of electricity load is mainly considered. Therefore, PG is set to operate in the following electricity load (FEL) mode.
2.2.2.1 PG operation modeling
Rural biomass waste resources could be input into a pyrolysis and gasification system for power generation. Under anoxic conditions, high temperature is used to decompose organic matter in straw and waste into combustible gases such as hydrogen and natural gas. Burning at 900–1,000 C makes the internal combustion engine provide electricity, which includes the following two steps:
Part 1 is thermal gasification:
Part 2 is the gasified gas which generates power:
Eqs 14, 15 are the operation model of PG including two parts, namely, pyrolysis gasification and the gasified gas to generate power.
2.2.2.2 AB-ST operation modeling
Biomass waste gas production includes two steps, namely, the mixing of manure and organic waste to generate biogas and converting methane into natural gas.
1 Biogas production model for the mixing of manure and organic waste
Rural organic waste has high carbon content, and manure has high nitrogen content. If the two factors are combined, the appropriate C/N ratio can be adjusted for microbial production and increases the gas yield of anaerobic digestion (Teng et al., 2021). ST will stand the rural domestic sewage. The sludge and the organic waste will be mixed and fermented. The static sewage will be used in B2G and P2G units to generate new natural gas.
2 Digester model
Heat preservation of biogas digesters needs heating for maintenance, which consumes heat to ensure the temperature of biogas digesters.
Eqs 16, 17 are the operation models of AB-ST including the biogas production model for the mixing of manure and organic waste and the digester.
2.2.2.3 B2G operation modeling
B2G adopts water washing, membrane separation, and other methods. Desulfurization and decarburization of biogas shall be carried out to make the biogas (methane content is about 60%) meet the requirements of standard natural gas (methane content >95%) (Teng et al., 2021).
Eqs 18, 19 are the operation models of B2G
2.2.3 CCU operation modeling
CCU conducts methanation of CO2 captured by the GPPCC and H2 generated by P2G to form CH4, which could be used for PG to generate electricity. Figure 3 shows the operation flowchart of CCU.
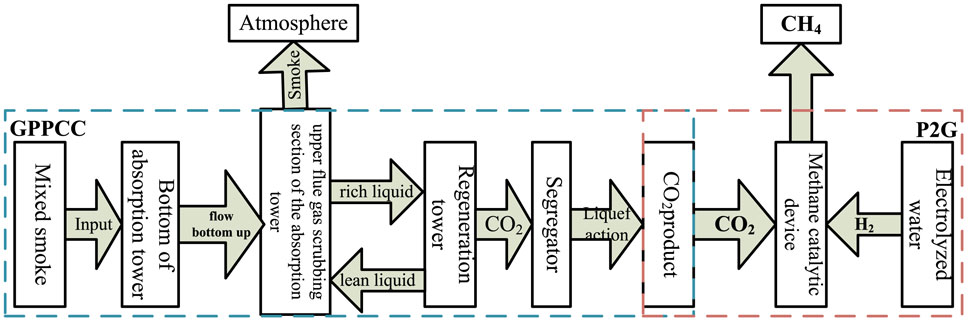
FIGURE 3. Operation flowchart of CCU.
As shown inFigure 3, CO2 produced by BWEC could be captured by the GPPCC and then flow to the carbon storage equipment, P2G, and atmosphere.
According to Eqs 20, 22, the CH4 produced by the GPPCC and P2G can be determined, and the process is accompanied by fixed power consumption:
Eqs 23, 24 are the input power and output power of CCU at time t, respectively.
3 Fuzzy robust two-stage optimal dispatching model for the rural BECU-VPP
3.1 Two-stage optimal dispatching framework system
The formulation of the dispatching plan of the BECU-VPP belongs to pre-dispatching and is also a two-stage optimal dispatching decision-making problem. Correspondingly, the scheduling phase is split into two stages, namely, day-ahead stage and real-time stage. Then, this study proposes a two-stage optimal dispatching framework system. Figure 4 shows the two-stage optimal dispatching framework.
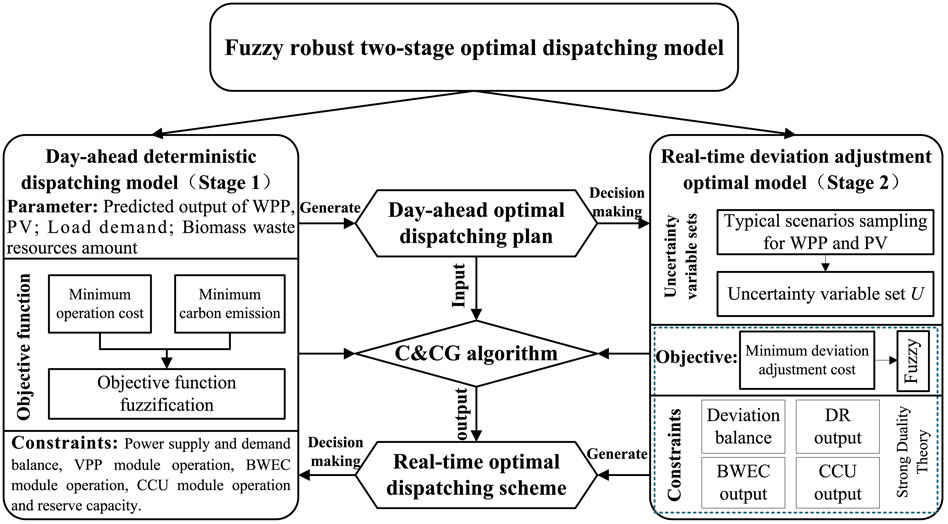
FIGURE 4. Two-stage optimal dispatching framework system.
As shown in Figure 4, according to the day-ahead forecast output and real-time output, the optimal scheduling scheme could be established in two stages:
• Stage 1: Day-ahead deterministic optimal scheduling model: Considering the total biomass straw, residual waste, organic waste, and domestic wastewater, the forecasted output of the WPP and PV is taken as random variables to formulate a day-ahead optimal scheduling plan with the objective of minimizing operating costs and carbon emissions by coordinating different units.
• Stage 2: Real-time uncertainty optimal dispatching model: The uncertainty variable sets of the WPP and PV are constructed by scenario sampling. The redundancy of the dispatching strategy is constrained by the robust coefficient. An uncertainty optimal dispatching model is proposed by revising the deviation correction of the day-ahead scheduling plan, which could establish the optimal operating scheme.
3.2 Robust two-stage stochastic optimal dispatching model
In this study, a robust two-stage optimal scheduling model is established, and the fuzzy satisfaction theory is applied to deal with different dimension levels of the objective functions in two dispatching stages.
3.2.1 Stage 1: day-ahead deterministic dispatching model
3.2.1.1 Objective function
The marginal cost of the WPP and PV output is low, but the output is highly volatile. To overcome the volatility, the flexible output of BWEC and CCU will be dispatched. However, since BWEC will generate carbon emission, the key problem of the BECU-VPP is how to balance operating costs and carbon emissions. Therefore, the objective is to minimize operating costs and carbon emissions.
1 Minimum operation cost objective
Eq. 25 calculates the operation cost
Eq. 25 calculates the operation cost of BWEC. Since the EVA needs time to gather electric vehicles as an agent, it is difficult to respond instantaneously, so the BWEC-VPP is set to dispatch the EVA in the day-ahead stage.
2 Minimum carbon emissions objective
Eq. 26 calculates the carbon emission
3.2.1.2 Constraint condition
The BECU-VPP mainly includes three important modules: BWEC, VPP, and CCU. The dispatching model will face the constraints including the co-ordination of supply and demand, operation of different modules, and reserve capacity limitation.
3.2.1.2.1 Supply and demand balance constraints
In Eq. 27,
3.2.1.2.2 VPP module constraints
The power output of different units in the VPP module cannot exceed the maximum power output. Similar to electric energy storage devices, the EVA is regarded as a negative power output at the charging period, which should satisfy the maximum charging power and storage capacity constraints.
Eqs 27a, b, c are the operation constraints of the VPP module including the maximum charging power and storage capacity constraints.
3.2.1.2.3 BWEC module operation constraints
The BWEC module should consider the greatest and smallest power output restrain of devices such as PG, AB, ST, and B2G. The waste disposal amount of BWEC cannot exceed the maximum available amount (Teng et al., 2021). The total PG output is set as
Eqs 28a, b, c are the operation constraints of the BEWC module including constraints of the maximum and minimum power output and startup and shutdown time.
3.2.1.2.4 CCU module operation constraints
The CCU module includes the GPPCC, P2G, and CS, and different units should satisfy the maximum and minimum power output limits. In terms of CS, the maximum gas storage capacity should also be considered as follows:
Eqs 29a, b are the operation constraints of the CCU module.
3.2.1.2.5 Reserve capacity constraints
Part of the capacity space is reserved to handle the uncertainty factors, i.e., the up- and down-spinning reserve constraints:
Eqs 30a, b are the reserve capacity constraints including the up-spinning reserve constraint and the down-spinning reserve constraint.
3.2.2 Stage 2: real-time uncertainty dispatching model
3.2.1.1 Uncertainty variable set construction
In this study, the uncertainty variables are described in the form of uncertainty sets. To obtain the typical output scenarios of the uncertainty variables, the Latin hypercube sampling method is used to simulate the maximum fluctuation range of uncertain output (Wang et al., 2022).
Eq. 31 divides the power output into the day-ahead predicted output and the real-time output deviation. If the deviation obeys the normal distribution
Furthermore, to eliminate the repetition and redundancy of the sampling scenario, this study introduces the Kantorovich distance for scenario reduction. The specific definition of the Kantorovich distance is as follows:
Eq. 32a defines the Kantorovich distance. Let
According to Eq. 32b, the typical scenario of the output can be obtained, and the maximum fluctuation range
According to the maximum fluctuation value in Eq. 33a, the output uncertainty is expressed as the uncertainty set U.
The
3.2.1.2 Real-time deviation adjustment optimal model
In the real-time phase, the operation plans of BWEC and CCU need to be modified reasonably, and flexible load demand response is dispatched to meet the deviation of the day-ahead scheduling plan. Therefore, the objective is to minimize the deviation adjustment cost.
The maximum in the formula refers to the worst-case scenario with the largest cost in the uncertainty set. min means the quadratic decision variable to minimize the adjustment cost.
Eqs 34a, b are the load demand response output at time t.
Based on the real-time deviation of Eq. 34, some constraints should be modified as follows.
3.2.1.2.1 Deviation adjustment balance constraints
Eq. 35 is the deviation adjustment balance constraints.
3.2.1.2.2 Flexibility load demand response constraints
The rural flexible load needs to meet the demand of different types of users and respond to output constraints. Among them, the shiftable mode requires the same amount of load before and after the shift, and both the incentive and reduced mode need to be performed within a certain range; otherwise, the load curve will be more volatile (Ju et al., 2022).
Eqs 36a, 37 are the flexibility load demand response constraints.
3.2.1.2.3 BWEC module operation constraints
In the real-time dispatching stage, PG in the BWEC module will adjust the power output, including three channels: self-adjustment, originating from B2G, and originating from P2G. We set the total output of PG in the real-time stage as
Eqs 38a, b are the BWEC module operation constraints.
3.2.1.2.4 CCU module operation constraints
For the CCU module, P2G converts CO2 to CH4 for PG to generate electricity. However, P2G itself has power limitations. When adjusting the power, the maximum and minimum power constraints must be satisfied.
Eqs 39a, b are the CCU module operation constraints.
3.2.3 Fuzzy robust two-stage dispatching model
Since the dispatching model has two objectives of minimizing operating costs and minimizing carbon emissions, the real-time dispatching model has a deviation adjustment cost minimum target. The carbon emission objective makes the dimension level of the two-stage objective function different. Three objective functions should be considered, so a robust two-stage optimal dispatching model is constructed. The first-stage and second-stage objective functions are processed by the descending semi-gradient membership function in the fuzzy satisfaction theory, and a fuzzy robust two-stage optimal dispatching model is constructed.
First, a single-objective optimal calculation for
Then, in order to determine the minimum and maximum values of the second-stage deviation adjustment cost target, the robust coefficient
where
According to Formulas 40a, b, 41, the deterministic dispatching model in stage 1 and the real-time uncertainty dispatching model in stage 2 can be converted into a fuzzy robust two-stage optimal dispatching model.
where
3.3 Fuzzy robust two-stage dispatching model solution method
The proposed robust two-stage optimal dispatching model is a min–max–min three-layer optimal form. The existing commercial solvers cannot be solved directly. The common solution paths include the Benders decomposition method and the C&CG algorithm. Chen et al. (2019) confirmed that the C&CG algorithm has higher solution efficiency than the Benders decomposition method. To explain the solution process, Eq. 43 is rewritten as follows:
where
According to Eq. 43, the main problem includes the first stage model and subproblems to find the output constraints of new energy units in the worst scenario. The main problem in the i-th iteration process is as follows:
where
The inner minimization problem can be transformed into a maximization problem. The i-th iteration subproblem model after transformation is
where
According to Eq. 43, the main and subproblems are solved by the C&CG algorithm as follows:
Step 1. An initial variable is established, and an initial value is assigned. The number of iterations i = 1, the upper bound
Step 2. Major problems are solved. The main problem is solved according to Eq. 43a, the objective function value
Step 3. The subproblems are solved according to Eq. 43b, and the objective function value
Step 4. The convergence is deteremined. If
4 Multi-agent benefit equilibrium allocation model for the rural BECU-VPP
This section mainly adopts the Nash negotiation model, combining the marginal contribution rate, carbon emission contribution rate, and deviation risk coefficient to form a final negotiation strategy-based operational benefit allocation method, and draws a flowchart for solving the solution by combining the two-stage scheduling method and the benefit allocation method.
4.1 Nash negotiation theory
For the general Nash negotiation problem, with the four postulates, it is noted that the solution
Considering when the EVA and DR participate in the dispatching of the VPP, the BECU-VPP will give subsidy benefits according to their power output. If it does not participate in dispatching and cannot obtain subsidies, it already belongs to the beneficiary, and there is no need to reallocate excess benefits when benefiting allocation. According to Eq. 44, the WPP, PV, SHS, BWEC, and CCU are regarded as different negotiators. At this time, three key parameters need to be considered: setting the initial negotiation point for different units, selecting the benefit function, and determining the negotiation power.
4.2 Utility function of cooperation agents
The selection of the utility function reflects the policymaker’s preference for benefit, which has the dual characteristics of being subjective and objective, and can also reflect the policymaker’s risk attitude. After normalizing the utility function, the definition domain and the value domain are in (0, 1) and monotonically increasing. This study chooses the exponential function and logarithmic function based on a natural logarithm to construct the utility function model as follows.
4.3 Multi-agent benefit equilibrium allocation strategy
4.3.1 Initial negotiation point
The negotiation starting point is that different unit agents participate in cooperative operation, expecting to obtain the minimum benefit allocation coefficient. If the benefit allocation coefficient obtained by a negotiator is lower than the minimum benefit allocation coefficient, the negotiation breaks down and cooperation cannot be realized. So, this study sets the negotiation starting power calculation as follows:
According to Eqs 45, 46, it can be established that the different units of the BECU-VPP can be used as the negotiation starting point among the negotiating participants in the cooperative operation. According to the utility characteristics of the cooperative operation, the cooperative negotiation is carried out.
4.3.2 Negotiation power
From the form of the Nash equilibrium solution, negotiating power is a key factor in deciding the benefit allocation coefficient of each participant. This study quantifies the indicator from three perspectives: marginal contribution, carbon emission contribution, and deviation risk factor.
4.3.2.1 Marginal benefit contribution.
The minimum operation cost of the BECU-VPP is realized when different agents are in the cooperation operation mode. However, a game relationship between different agents exists, and the Shapley value is used to represent this relevance and establish the contribution of marginal cost (Ju et al., 2022):
Bi represents the benefit contribution factor of unit i. S represents the alliance formed by each unit.
4.3.2.2 Carbon emission contribution
The WPP and PV have zero-carbon properties, CCU is the agent of carbon reduction, and BWEC is the agent of carbon emission.
4.3.2.3 Deviation risk factor
Output uncertainty of the WPP and PV brings deviation adjustment cost to the real-time dispatch. This study calculates the deviation costs of the WPP and PV and the benefits (negative costs) of BWEC and CCU. Taking the ratio of different units’ deviation adjustment cost to the total deviation adjustment cost as the deviation risk factor,
4.3.3 Comprehensive negotiation score
According to Eqs 47a, b, 48a, b, 49, the indicators of different unit agents participating in negotiation are obtained. The comprehensive negotiation score of different units participating in the negotiation is calculated as follows:
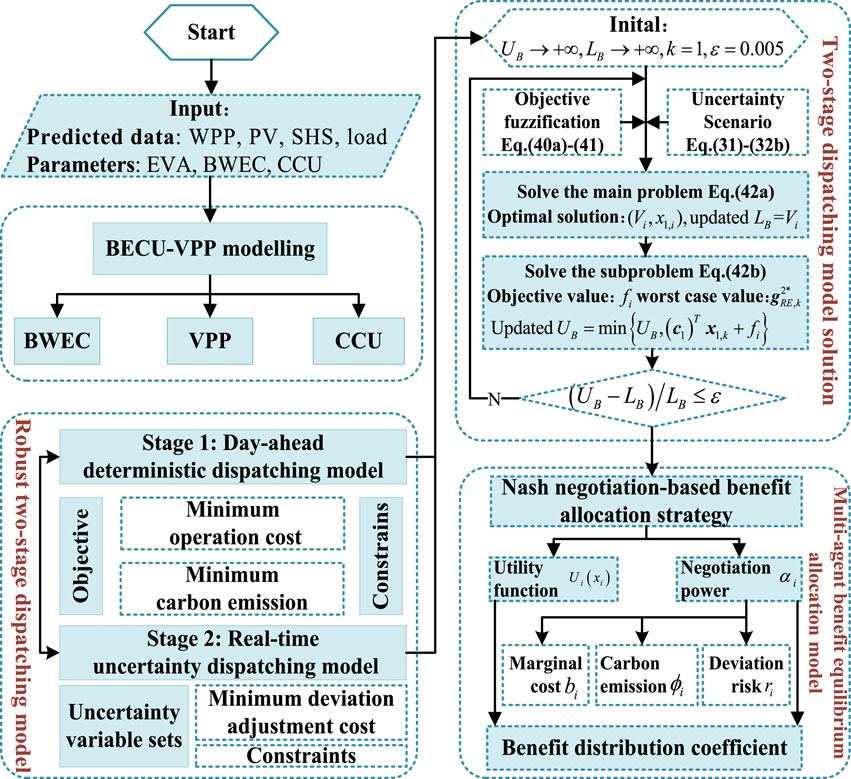
FIGURE 5. Solution flowchart of the two-stage dispatching and benefit allocation method.
5 Case analysis
5.1 Basic data
In this study, a rural distribution network in Jiangsu province, China, is selected as the test system. Nodes 7, 30, and 20 access 6 × 1 MW WPP, 4×1MWPV, 2 × 1 MW SHS. Node 4 accesses a 4 MW PG with an average daily waste treatment capacity of 40 tons, a 0.5 MW ST with an average daily sewage treatment capacity of 900 m3, and a biogas generation capacity of 12 m3. Nodes 17 and 33 have access to the EVA. The rated power of the EV is 0.15 kW, the quantity of the EVA aggregating EV is 1,000, and the capacity of the battery of one electric vehicle is 3 kW·h. Nodes 23, 24, and 25 access small industrial load, agricultural load, and resident load. At the same time, node 31 accesses a 3 MW GPPCC, 15 t CS, and 1.5 MW P2G. The conversion efficiency of power to energy is 60%. Figure 6 shows the improved distribution network node diagram.
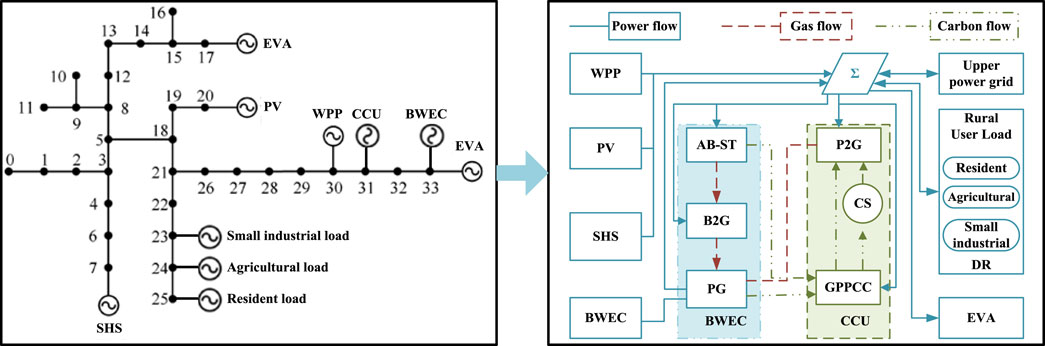
FIGURE 6. Improved distribution network node diagram.
In the process of rural waste energy utilization, the waste-to-energy subsidy is 0.25¥/kW·h, the waste treatment fee is 20¥/ton, and the sewage treatment fee is 0.5¥/ton. Among them, the per capita daily domestic sewage volume is 90 kg, residual waste is 0.4 kg, and kitchen waste is 0.6 kg, while the average daily sewage volume of human feces in the sewage is 0.5 kg, the daily urine volume is 1 kg, and the moisture content is 80% and 96%, respectively. Referring to Teng et al. (2021), Table 2 demonstrate the BWEC equipment operating parameters.
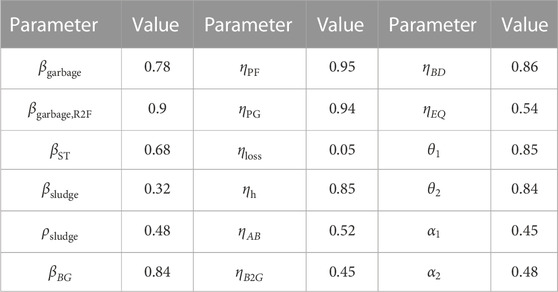
TABLE 2. BWEC equipment operating parameters.
The shape parameter is set as
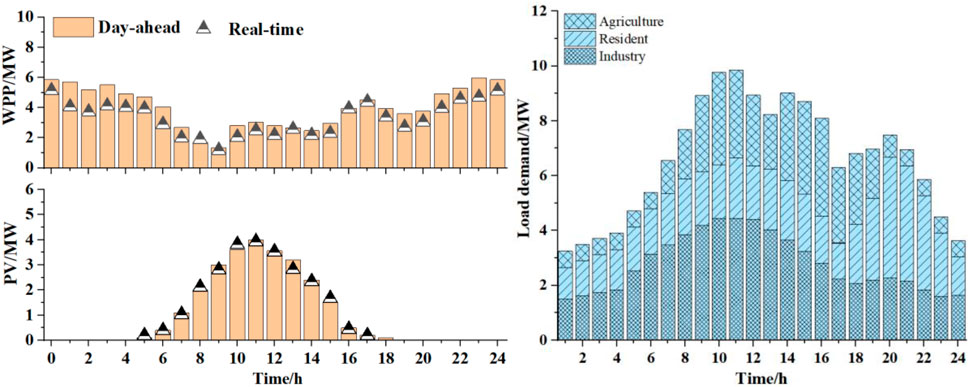
FIGURE 7. Available output of the WPP and PV and the demand distribution of load on a typical load day.
The parameters of demand response are set referring to the work of Qin et al. (2019). The load fluctuation range, the maximum cut, and incentive load should be lower than 10%, 5%, and 5% of the original load, respectively. Table 3 shows the DR’s parameters of different types of flexible loads.
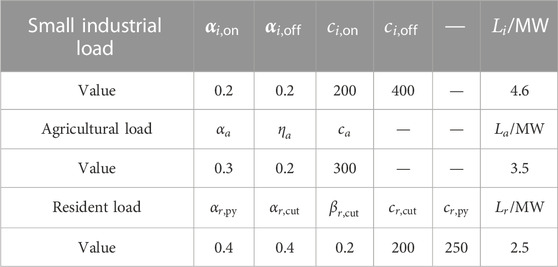
TABLE 3. Parameters of distinct kinds of flexible loads’ DR.
The power consumption price of the GPPCC and P2G is set to 130¥/MWh,
Based on the aforementioned data, the improvement effect of BWEC and CCU on VPP operation is compared and analyzed, and the four simulation cases are set as follows:
Case 1. Basic case: The VPP dispatches without BWEC and CCU. This case mainly considers the WPP, PV, SHS, EVA, and flexible load DR. An operating optimal strategy for the VPP is established as a comparison case.
Case 2. BWEC case: The VPP is dispatched with BWEC. This case integrates BWEC into the VPP. The impact of biomass waste energy on VPP operation is analyzed, especially when PG can provide new regulatory output for the WPP and PV.
Case 3. CCU case: The VPP is dispatched with CCU. This case integrates CCU into the VPP. Since the H2 generated by CCU through P2G cannot be converted into electricity, it can only be sold to obtain economic returns from the external gas network.
Case 4. Comprehensive case: The VPP is dispatched with BWEC and CCU. This case integrates BWEC and CCU into the VPP. The electric–carbon–electricity synergistic optimal effect is analyzed between BWEC and CCU.Finally, according to the aforementioned four cases, the optimization of day-ahead deterministic dispatching and real-time uncertain dispatching is carried out, and the fuzzy robust two-stage dispatching model is solved to obtain the optimal dispatching results of the four cases. Through comparative analysis, the contribution of different agents is established to cooperative operating benefits, and the benefit equilibrium allocation of a multi-agent is carried out based on Nash negotiation to formulate a reasonable benefit allocation strategy.
5.2 Case results
5.2.1 Validation
This section applies the robust two-stage optimization theory to the optimal scheduling of the BECU-VPP. Table 4 shows the optimized scheduling results of the BECU-VPP.
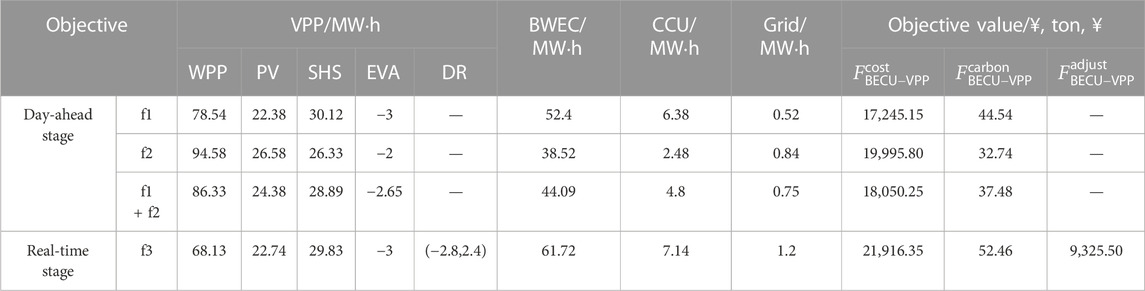
TABLE 4. Optimal scheduling results of the BECU-VPP at different stages.
According to Table 4, in the day-ahead stage, BWEC and SHS dispatch more because their marginal cost is lower than new energy units. However, BWEC will generate carbon emissions, and CCU is dispatched more for carbon conversion. When the minimum carbon emission is the objective, the power output of the WPP and PV is higher. When the two objectives are considered comprehensively, the dispatch cost and carbon emissions are increased by 9.56% and 16.85%, compared with the worst values. It shows that the comprehensive dispatching scheme can better balance operation costs and carbon emissions. Furthermore, when there is a deviation in the real-time power output of the WPP and PV, BWEC and CCU will adjust the day-ahead output plan, and DR is also dispatched to provide flexible output. Figure 8 shows the two-stage optimal dispatching scheme of the BECU-VPP.

FIGURE 8. BECU-VPP day-ahead scheduling scheme (A) and real-time adjustment scheme (B).
According to Figure 8, in the day-ahead period, the WPP, PV, SHS, and BWEC are the main power resources, and CCU converts CO2 into CH4 by using part of the abandoned power output during the trough period, and converts CH4 into power output during part of the peak period. In the real-time stage, DR is dispatched to provide negative output in the low period and positive output in the peak period. At 0:00–8:00, CCU converts more CO2 generated by BWEC into CH4 for power generation. At 11:00–15:00 and 19:00–21:00, since BWEC is already dispatched at full power, CCU converts more stored CO2 into CH4 for power generation. In general, the two-stage dispatching module of the BECU-VPP formulates a dispatching plan that satisfies the real-time power supply and demand balance. Figure 9 shows DR schemes for different types of users’ load.
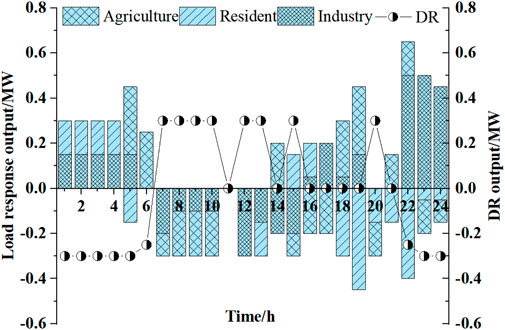
FIGURE 9. Demand response schemes for different types of users’ load.
On the basis of Figure 9, during the periods of 0:00–6:00 and 22:00–24:00, DR is dispatched to provide positive output. During the period of 7:00–21:00, DR is dispatched to provide negative output. Specifically, the small industrial loads mainly increase load demand and generate negative output at 0:00–5:00, 16:00–19:00, and 22:00–24:00, and cut load demand at 7:00–15:00. The agricultural load shifts the production load from 7:00–18:00 to 5:00–6:00 and 19:00–22:00. The resident load shifts part of the load from 18:00–22:00 to 0:00–04:00, and part of the load is cut. In general, different types of loads generate demand response output through shifting, cutting, and incenting. Figure 10 shows the power distribution of BWEC and CO2 flow in the BECU-VPP dispatching scheme.
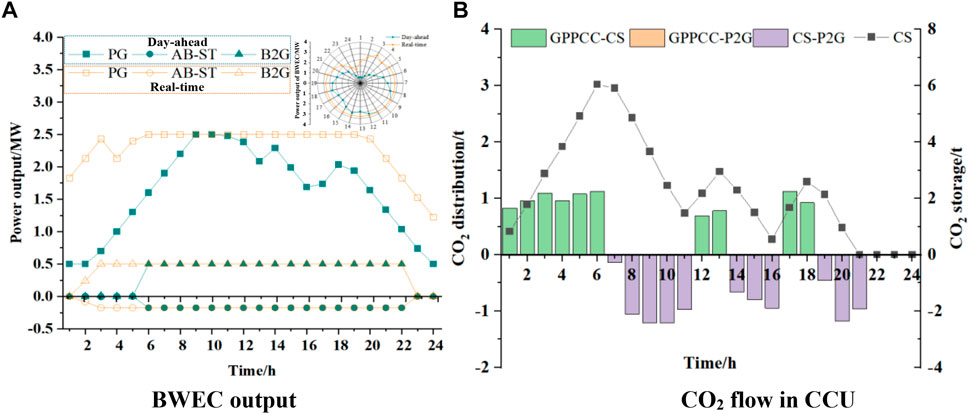
FIGURE 10. BWEC Production Distribution Diagram (A) and CO2 Flow Diagram (B) in BECU-VPP Scheduling Scheme.
According to Figure 10, in terms of BWEC output distribution, BWEC is dispatched to provide more output, and PG is in a full state from 6:00–19:00, which is significantly higher than the previous output plan. AB-ST and B2G generate more natural gas at 0:00–5:00 and use it for power generation to balance the output volatility of the WPP and PV. As far as CO2 flow in CCU is concerned, the GPPCC captures and stores the CO2 generated by BWEC during the trough period and some normal periods. During peak hours, P2G converts CO2 into CH4. Table 5 shows the optimal scheduling results under different robust coefficients.
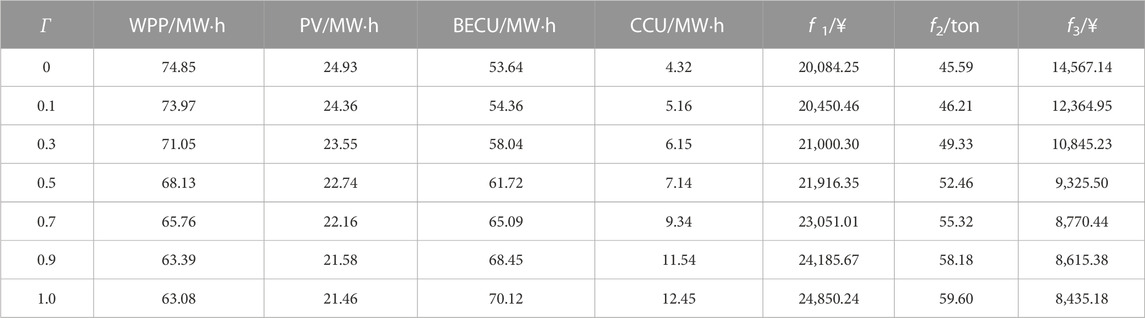
TABLE 5. Optimal dispatching results under different robust coefficients.
According to Table 5, with the increase of Γ, the acceptable uncertainty redundancy of the BECU-VPP dispatching scheme decreases gradually, making it difficult to deal with the uncertainty risks. Compared with Γ = 0, when Γ = 1, the electric power generation of the WPP and photovoltaics decreased by 15.72% and 15.12%, respectively, while the power output of BWEC increased by 30.7%. This also increases the power output of CCU by 188.19%, indicating that Γ has a direct impact on the BECU-VPP and will constrain the scale of the WPP and photovoltaic grid connection. When Γ∈ (0.3, 0.9), the electric power generation of the WPP and photovoltaics drops significantly, indicating that the growth of Γ has the most direct impact on the scheduling scheme. When Γ > 0.9 or Γ < 0.3, the changes in power output are not obvious, indicating that the change in Γ has little effect on the dispatching scheme. The former means the dispatching plan is close to the most conservative scheme, and the latter is because the dispatching scheme has a high tolerance for uncertainty. Furthermore, from changes in the objective value, the operation cost, carbon emission, and deviation cost all decrease with the increase of Γ gradually, and the distribution trend is consistent with the changing trend of the power output. Therefore, when the policymakers avoid risks, the uncertainty margin needs to be set at (0.3, 0.9) Figure 11 shows the sensitivity analysis results with different capacity scales of BWEC and CCU.
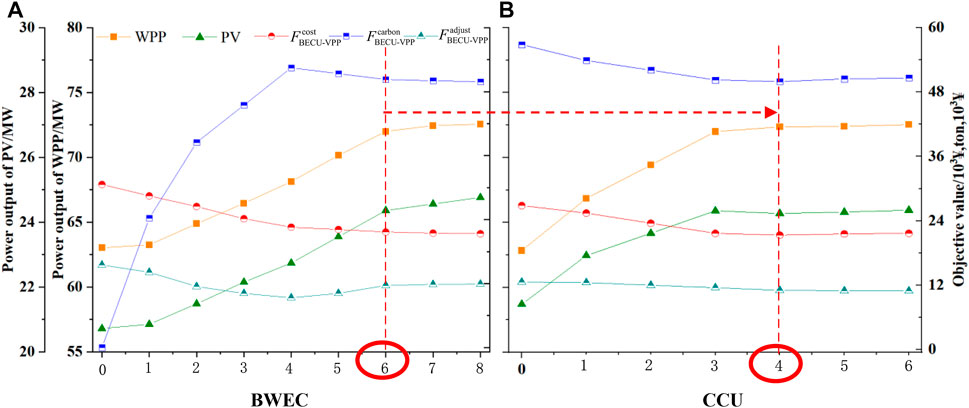
FIGURE 11. Sensitivity analysis results of different capacity scales of BWEC and CCU.
According to Figure 11, when the capacity is 2–6 MW, the slope of the output growth curve is higher, indicating that the unit capacity increase will bring higher power output. When the capacity exceeds 6 MW, the output growth is lower. For operation cost, as the capacity of BWEC increases, the cost decreases gradually, and when the capacity of BWEC exceeds 6 MW, the operation cost remains unchanged basically. For carbon emissions, when the capacity of BWEC exceeds 4 MW, the carbon emissions decrease gradually, and when the capacity of BWEC exceeds 6 MW, the carbon emissions remain unchanged basically. For deviation adjustment cost, as the capacity of BWEC increases, the deviation adjustment cost decreases gradually, and the deviation adjustment cost basically remains unchanged until the capacity reaches 6 MW. In general, when the capacity of BWEC is 6 MW, the dispatching scheme can become optimum. Based on this, when the capacity of CCU exceeds 3 MW, the output of the WPP and PV no longer increases basically. When the capacity of CCU exceeds 4 MW, the value of the objective function does not change basically. Therefore, while the WPP + PV capacity ratio, BWEC, and CCU is 5:3:2, the dispatching operation scheme of the BECU-VPP is optimal.
5.2.2 Comparative analysis of different cases
This section focuses on analyzing the synergistic optimal effect between BWEC and CCU. According to the basic case, BWEC case, CCU case, and comprehensive case in Section 5.1, the robust coefficient Γ of the four cases is 0.5. Table 6 shows the optimal dispatching results of the BECU-VPP in different cases.
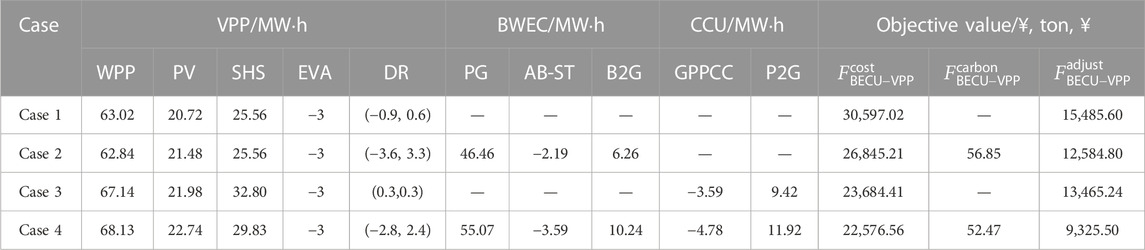
TABLE 6. Optimal dispatching results of the BECU-VPP under different conditions.
According to Table 6, when both BWEC and CCU are equipped, the operation cost and deviation adjustment cost are reduced by 26.21% and 39.78% compared with Case 1, respectively. It shows that BWEC and CCU can provide flexible output for the WPP and photovoltaic, and BWEC can gain benefit from the conversion of biomass waste resources, reducing the overall operation cost of the VPP. The day-ahead dispatching plan deviations are mainly satisfied by BWEC and CCU. It replaces the high-cost grid flexibility load, so the deviation adjustment cost is also reduced significantly. Furthermore, compared with Case 2 and Case 4, CCU can convert CO2 generated by BWEC operation into CH4, which could reduce the operation cost and deviation adjustment cost by 15.90% and 25.89%, respectively. Compared with Case 3 and Case 4, when the VPP is not equipped with BWEC, CCU can only capture CO2 in the atmosphere, resulting in relatively high cost and weak regulation ability, so operation adjust and the cost of cost deviation are both increased by 3.58% and 44.39%, respectively. In general, there is a synergistic optimal effect between BWEC and CCU. It is beneficial to realize the optimal dispatching of the BECU-VPP. Figure 11 represents the dispatching scheme of the BECU-VPP in different cases.
On the basis of Figure 12, according to Case 1 and Case 3, if the VPP is not equipped with BWEC, the VPP would buy more power from the external grid. However, if the VPP is equipped with BWEC (Case 2), the VPP will reduce the purchase of electricity from the external grid significantly, and BWEC will produce more electricity, so that the dispatching output of DR is also significantly higher than in Case 1. Different from Case 1 and Case 3, if CCU is only equipped in some time periods (5:00–6:00 and 22:00–23:00), the BECU-VPP will sell power to the external grid, mainly from the electricity output of CCU by converting CO2. Compared with Figure 8, if BWEC and CCU are equipped at the same time, the CO2 generated by the BECU-VPP can be converted into CH4. Figure 12 shows the BWEC operation results in Case 2 and Case 4.
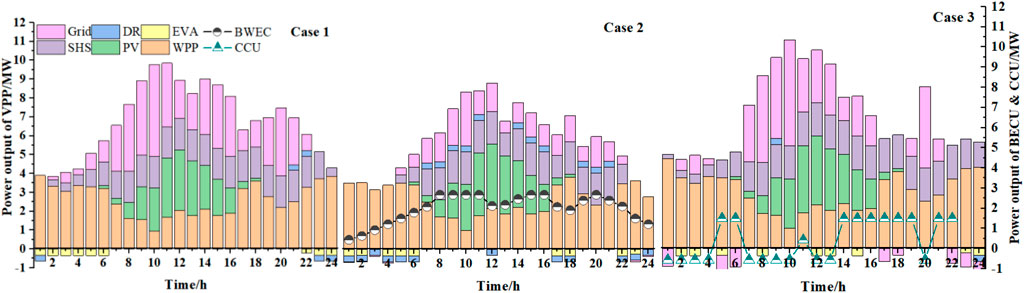
FIGURE 12. Dispatching scheme of the BECU-VPP in different cases.
According to Figure 13, in Case 4, the power output of BWEC is more than that in case 2. PG, AB-ST, and B2G are basically at rated power from 5:00–20:00. The generated CO2 will be captured, stored, and converted by CCU, which could provide more flexible output. In Case 4, more AB-ST is used to ferment organic waste and domestic sewage to generate biogas, and use B2G to convert the biogas into CH4 for power generation. Figure 13 shows the output consequence of CCU in Case 3 and Case 4.
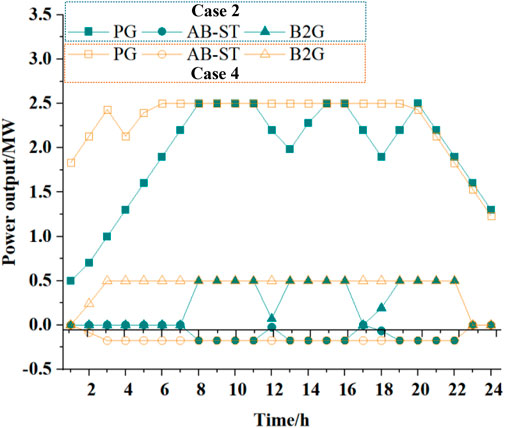
FIGURE 13. BWEC operation results in case 2 and case 4.
According to Figure 14, the VPP is not equipped with BWEC in Case 3. When CCU performs carbon capture and conversion, it operates more at rated power and cannot be adjusted. When the VPP is equipped with BWEC, CCU can directly capture CO2 generated by BWEC and convert it into CH4 for power generation. More flexibility adjustment services for the WPP and PV are undertaken by CCU. This makes the output power fluctuation range more obvious. In conclusion, when the VPP is equipped with BWEC and CCU, it can capture and store the CO2 generated while converting and utilizing biomass waste resources, and then be converted into CH4 for power generation, which could generate an electricity–carbon–electricity cycle optimal effect.
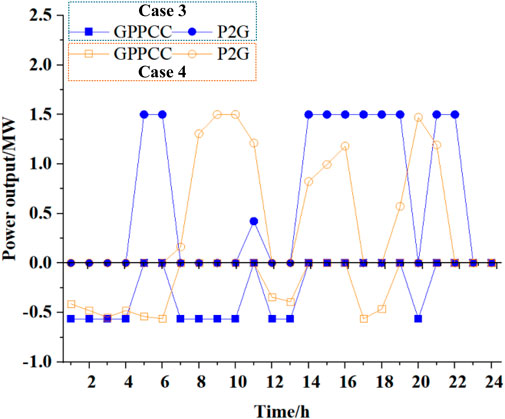
FIGURE 14. Output results of CCU in cases 3 and 4.
5.2.3 Multi-agent benefit equilibrium allocation result
According to the scheduling results of the BECU-VPP, this section optimizes the benefits allocation from different agents in the collaborative operation. From Eqs 43, a, b, 44, 45, 46, 47a, b, 48a, b, 49, 50, if different agents in BWEC, VPP, and CCU are used as independent agents to participate in benefit allocation, the calculation amount will be 214–1, the workload is huge, and some calculation schemes are redundant. Therefore, according to the attributes and scale of the agent, this study mainly selects four types of agents: WPP + PV, SHS, BWEC, and CCU. Table 7 shows the objective values for different possible combinations.
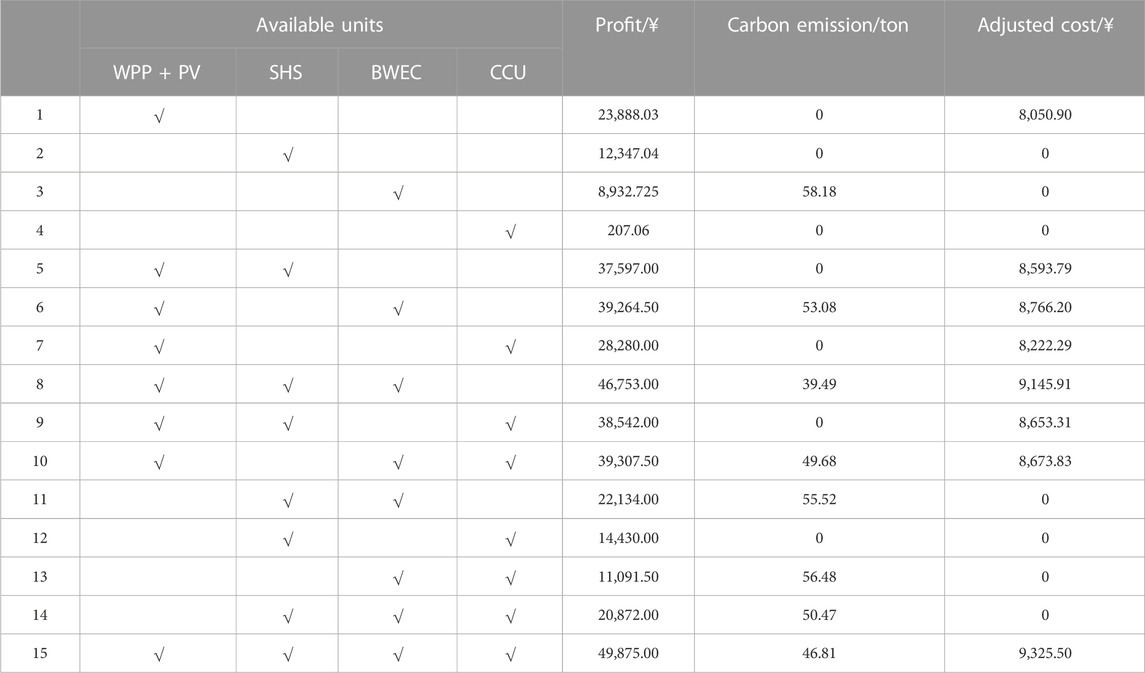
TABLE 7. Objective values of the possible combinations in case 4.
According to Table 5, the negotiation starting point of the cooperation benefit allocation of the BECU-VPP is calculated by applying Eqs 44, 45. Eqs 47a, b, 48a, b, 49 are used to establish marginal benefit contribution, carbon emission contribution, and the deviation risk factor. A comprehensive negotiation score could be calculated by Eq. 50, which is used to carry out the benefit allocation of WPP + PV, SHS, BWEC, and CCU. For WPP + PV, BWEC, and CCU, they all include multiple internal unit equipment and allocate the benefits of each equipment according to the proportion of output to total output. Table 8 shows the allocated profits of the BECU-VPP in Case 4.
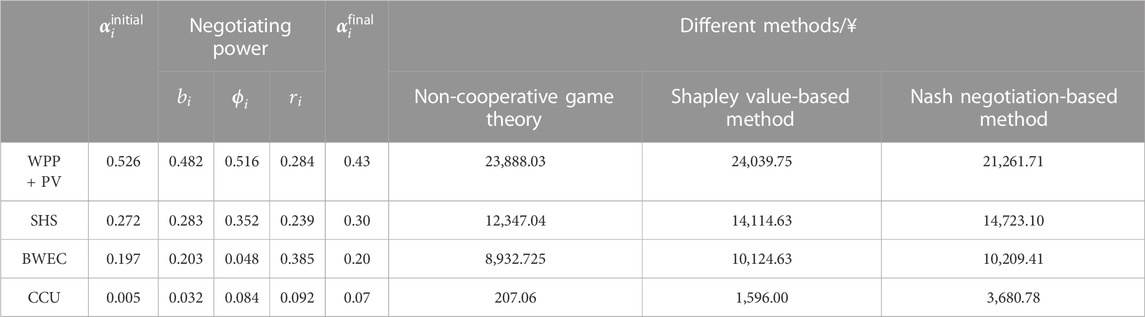
TABLE 8. Allocated profits of the BECU-VPP in case 4.
According to Table 8, the cooperative operation of different agents can generate an incremental profit of 4,500.16 ¥. From the results of traditional benefit allocation, because of the great contribution of the WPP and PV to marginal benefits and a total of 24,039.75 ¥ obtained during the incremental benefit allocation, BWEC and CCU provide flexibility adjustment services for the WPP and PV and obtain incremental profits of 1,191.91 ¥ and 1,388.94 ¥ respectively. Furthermore, the carbon emission contribution and deviation risk factors are included in the cooperation benefit allocation to obtain comprehensive negotiation scores. Due to the risk influence of power generation deviation, WPP + PV obtains 2,626.32 ¥. The SHS earned 2,376.06 ¥ due to the zero-carbon and zero-risk attributes of power generation, and both BWEC and CCU obtain incremental benefits. Particularly, CCU gains a larger share of excess profits due to its ability to convert CO2 to CH4, thereby providing flexible adjustment services for the WPP and PV, while reducing carbon emissions and deviation risks. Figure 14 shows the proportion of benefits obtained by each agent in different allocation factors and allocation methods.
According to Figure 15, for marginal benefit contribution, the WPP and PV have higher marginal benefit contribution and obtain a higher benefit share (48.20%). For carbon emission contribution, WPP + PV and SHS’s power generation is zero-carbon emission, and CCU can produce a carbon reduction effect, and the share of benefit is 51.6%, 35.2%, and 8.4%. However, BWEC produces carbon emissions, which reduces the share of benefits to 4.8%. For deviation risk factors, BWEC and CCU provide more flexible adjustment services for the WPP and PV, and the benefit share is 38.5% and 9.2%. If the benefit allocation is based on the comprehensive negotiation score, the SHS and BWEC gain a higher share, and the CCU benefit share also increases. It shows that the proposed Nash carbon emission-benefit allocation strategy can take into account the multidimensional influencing factors, and establish a reasonable benefit allocation strategy. Figure 15 shows the benefit allocation results of each agent in different cases.
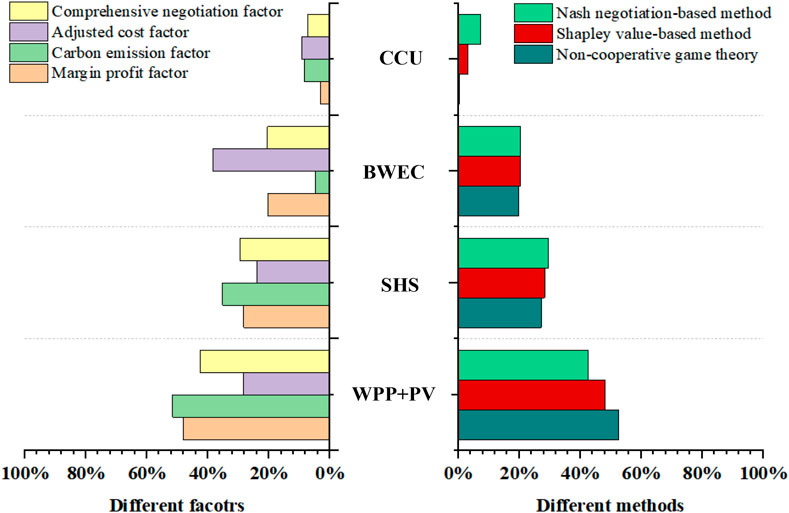
FIGURE 15. Proportion of benefits obtained by each agent in different allocation factors and allocation methods.
According to Figure 16, since the power output of BWEC satisfies the internal load demand in Case 2 and Case 4, the VPP reduces the amount of electricity purchased from the power grid, and the total profit is higher than in Case 1 and Case 3, with an increase of 15,895.73 ¥ and 11,333 ¥, respectively. For the specific benefit allocation plan, in comparison with Case 1 and Case 3, after the VPP is equipped with CCU, the WPP and photovoltaic power output increase, and putting forward more flexibility adjustment requirements for the SHS and CCU, SHS and CCU obtained incremental profits of 2,509.93 ¥ and 4,856.37 ¥. Compared with Case 2 and Case 4, after the VPP is equipped with BWEC, the WPP and PV power output becomes the highest. BWEC can significantly reduce the cost of deviation adjustment and increase the operating output of CCU, so BWEC and CCU obtain an incremental profit of 1,548.23 ¥ and 6,999.13 ¥, respectively. The proposed Nash carbon emission–benefit equilibrium allocation strategy can take into account the features of different agents and formulate the most reasonable benefit allocation strategy. Furthermore, as the uncertainty of the WPP and photovoltaic, it is essential to analyze the benefit allocation strategy in different margins. Table 9 shows the benefit allocation strategy of each agent has a distinct robust factor.
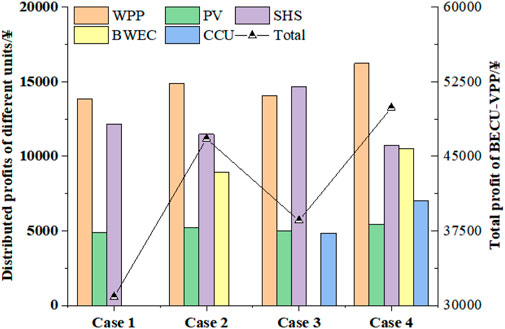
FIGURE 16. Benefit allocation results of each agent in different cases.
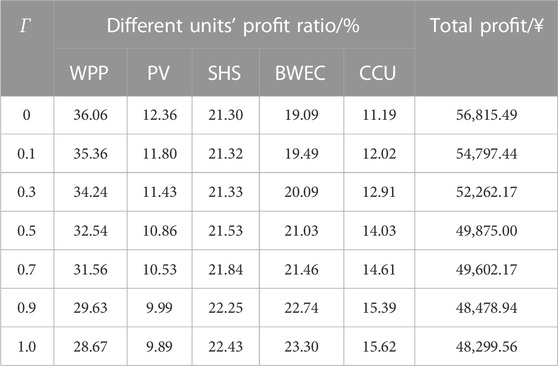
TABLE 9. Benefit allocation strategy of each agent with different robust coefficients.
According to Table 9, from the perspective of the total profit, along with the growth of Г, the WPP’s power output and photovoltaic power generation gradually decrease, and the VPP purchases more power from the electric fence to reduce the cost of real-time deviation risk, resulting in a gradual decrease in the total profit. When Г = 1, compared with Г = 0, the total profit is reduced by 14.98%. From the perspective of specific benefit allocation, with the growth of Г, the WPP and PV have higher deviation risk costs due to their uncertainty, so the share of profit gradually decreases. However, the SHS, BWEC, and CCU can provide flexible adjustment services, so the profit gradually increases. When Γ∈ (0.03, 0.9), the proportion of profits obtained by the WPP and PV decreased significantly. When Γ > 0.9 or Γ < 0.3, the proportion of WPP and PV profits decreased slowly, and the distribution trend was identical with the consequence given in Table 5. It shows that the proposed Nash carbon emission–benefit equilibrium allocation strategy can consider the impact of the uncertainty margin regarding the operation of the BECU-VPP and formulate the optimal agent benefit allocation strategy reflecting different uncertainty margins.
6 Conclusion
For massive biomass waste resources such as straw, solid waste, and sanitary sewage in rural areas, this study proposes a new concept of biomass waste energy conversion (BWEC) and a new model of carbon recycling utilization (CCU) based on GPPCC-P2G, and constructs a novel BWEC-CCU-based VPP (BECU-VPP). In addition, a fuzzy robust two-stage optimal scheduling model for the BECU-VPP is developed in this study. Finally, a Nash negotiation-based benefit-balancing allocation strategy is constructed considering marginal revenue contribution, carbon emission contribution, and deviation risk factors. Finally, a rural distribution network in Jiangsu province, China, is used as a test system.
1 BWEC could convert rural biomass waste resources into energy, and CCU could play power–carbon–power the cycle optimal effect, which could improve the output of the WPP and photovoltaic by aggregating the SHS, EVA, and multi-type user DR. Compared with the conventional VPP, BWEC and CCU could reduce the operation cost by 12.26% and 22.59% and decrease deviation adjustment cost by 18.73% and 13.05%, respectively. When they are both introduced, the operation cost and the deviation adjustment cost could be reduced by 26.21% and 39.78%, which shows that there is a synergistic optimal effect between BWEC and CCU.
2 The fuzzy robust two-stage optimal dispatching model of the rural BECU-VPP can measure the non-determinacy of the WPP and PV, analyze the influence of uncertainty redundancy on the optimal dispatching scheme, and develop the optimal scheduling plan that considers the minimization of operation cost, carbon emission, and deviation adjustment cost. In the real-time phase, DR is dispatched to provide −2.8 and 2.4 MW response output, and the real-time output of BWEC and CCU increased by 40.01% and 48.57%, respectively. Furthermore, the sensitivity analysis of Γ shows that compared with Γ = 0, when Γ = 1, the outputs of the WPP and photovoltaic decrease by 15.72% and 15.12%, respectively, and the outputs of BWEC and CCU increase by 30.7% and 188.19%, respectively. When Γ∈ (0.3,0.9), the output of the WPP and photovoltaic and objective function values change significantly, and the growth of Γ has the most direct influence on the dispatching scheme. The uncertainty redundancy is set at (0.3, 0.9). Finally, the capacity sensitivity analysis of BWEC and CCU shows that while the capacity ratio of WPP + PV, BWEC, and CCU is 5:3:2, the BECU-VPP dispatching operation scheme is optimal.
3 The multi-agent benefit equilibrium allocation strategy for the rural BECU-VPP could consider marginal benefit contribution, carbon emission contribution, and deviation risk factors and formulate a benefit distribution strategy that reflects the utility features of different agents and comprehensive negotiation scores. Compared with the non-cooperation case, the cooperation of different agents can increase the operating profit by 9.92%. Compared with the traditional cooperative benefit allocation strategy based on benefit contribution, if the benefit distribution is according to the comprehensive negotiation score, the benefit share of the WPP and PV is reduced by 5.2%, and the benefit share of the SHS, BWEC, and CCU is increased by 1.7%, 9.7%, and 3.8%, respectively. If the VPP is equipped with CCU, the incremental profit of the SHS and CCU will increase by 2,509.93 ¥ and 4,856.37¥. However, if VPP is equipped with BWEC, the incremental profit of BWEC and CCU will increase by 1,548.23 ¥ and 6,999.13 ¥, respectively. When Γ∈ (0.3, 0.9), the proportion of the WPP and PV benefits significantly decreased and the proportion of BWEC and CCU benefits increased significantly.
4 In the energy treatment of biomass waste material, this study mainly considers its pyrolysis and gasification to generate electricity. The natural gas formed by the fermentation of wet garbage and domestic sewage is also converted into electricity. It belongs to a single-dimensional power supply and demand balance decision-making problem. In practice, the pyrolysis and gasification of biomass power generation waste resources also generate part of heating. If it can be utilized, it can form the coordinated supply problem of electricity, heating, and gas. A single balance of power supply and demand to a multi-energy supply and co-ordination of supply and demand of electricity, heating, and gas is formed, and this is the main research direction in the future.
Data availability statement
The original contributions presented in the study are included in the article/Supplementary Material; further inquiries can be directed to the corresponding author.
Author contributions
LJ performed writing—original draft and conceptualization. QZ and MP performed writing—reviewing and editing. WW, YW, JS and YP performed data curation and writing—original draft preparation. All authors contributed to the article and approved the submitted version.
Funding
This work was partially supported by the National Natural Science Foundation of China (Grant Nos. 72274060, 71904049, 72174062, 72074074, and 72204086) and the Special Funds for Fundamental Scientific Research Operation Fees of Central Universities, North China Electric Power University (JB2021019).
Conflict of interest
Author WW was employed by Beijing New Energy Smart Internet Technology Co., Ltd.
The remaining authors declare that the research was conducted in the absence of any commercial or financial relationships that could be construed as a potential conflict of interest.
Publisher’s note
All claims expressed in this article are solely those of the authors and do not necessarily represent those of their affiliated organizations, or those of the publisher, the editors, and the reviewers. Any product that may be evaluated in this article, or claim that may be made by its manufacturer, is not guaranteed or endorsed by the publisher.
References
Ahmad, R. J. (2022). A stochastic model for participation of virtual power plants in futures markets, pool markets and contracts with withdrawal penalty. J. Energy Storage 50, 104334. doi:10.1016/j.est.2022.104334
Ahn, Y. C., and Han, J. (2018). A stochastic programming approach for the integrated network with utility supply and carbon dioxide mitigation systems in uncertain utility demand. Energy Convers. Manag. 176, 299–308. doi:10.1016/j.enconman.2018.09.023
Bokde, N., Tranberg, B., and Andresen, G. B. (2020). A graphical approach to carbon-efficient spot market scheduling for Power-to-X applications. Energy Convers. Manag. 224, 113461. doi:10.1016/j.enconman.2020.113461
Budny, C., Madlener, R., and Hilgers, C. (2015). Economic feasibility of pipe storage and underground reservoir storage options for power-to-gas load balancing. Energy Convers. Manag. 102, 258–266. doi:10.1016/j.enconman.2015.04.070
Cao, Y., Zhou, B., Chung, C. Y., Shuai, Z., Hua, Z., and Sun, Y. (2022). “Dynamic modelling and mutual coordination of electricity and watershed networks for spatio-temporal operational flexibility enhancement under rainy climates,” in IEEE transactions on smart grid, 1. doi:10.1109/TSG.2022.3223877
Cavazzini, G., Benato, A., Pavesi, G., and Ardizzon, G. (2021). Techno-economic benefits deriving from optimal scheduling of a Virtual Power Plant: Pumped hydro combined with wind farms. J. Energy Storage 37, 102461. doi:10.1016/j.est.2021.102461
Chen, Y. C., Weiker, S., and Gaderer, M. (2022). A general approach to integrating compression heat pumps into biomass heating networks for heat recovery. Appl. Energy 310, 118559. doi:10.1016/j.apenergy.2022.118559
Chen, Z., Zhang, Y. N., Ma, G., Guo, C. R., and Zhang, J. J. (2019). Two-stage day-ahead and intra-day robust reserve optimization considering demand response [J]. Automation Electr. Power Syst. 43 (24), 67–78.
Daniel, F. M., and Juan, I. P. D. (2023). Optimisation models for the day-ahead energy and reserve self-scheduling of a hybrid wind–battery virtual power plant. J. Energy Storage 57, 106296. doi:10.1016/j.est.2022.106296
Fu, X., and Zhou, Y. (2023). Collaborative optimization of PV greenhouses and clean energy systems in rural areas. IEEE Trans. Sustain. Energy 14, 642–656. doi:10.1109/TSTE.2022.3223684
Fu, X., and Niu, H. (2022). Key technologies and applications of agricultural energy Internet for agricultural planting and fisheries industry. Inf. Process. Agric. doi:10.1016/j.inpa.2022.10.004
Fu, X. (2022). Statistical machine learning model for capacitor planning considering uncertainties in photovoltaic power. Prot. Control Mod. Power Syst. 7 (1), 5–63. doi:10.1186/s41601-022-00228-z
Huang, B., Zhu, Z. W., Zhong, S. Y., Qiu, X. Y., Huang, C. H., Wu, H., et al. (2019). Vitamin D protects against diabetic nephropathy: Evidence-based effectiveness and mechanism. Smart power 47 (08), 91–98. doi:10.1016/j.ejphar.2018.09.037
Ju, L. W., Li, H. H., Zhao, J. W., Chen, K. T., Tan, Q. K., and Tan, Z. F. (2016). Multi-objective stochastic scheduling optimization model for connecting a virtual power plant to wind-photovoltaic-electric vehicles considering uncertainties and demand response. Energy Convers. Manag. 128, 160–177. doi:10.1016/j.enconman.2016.09.072
Ju, L. W., Tan, Q. L., Lu, Y., Tan, Z. F., Zhang, Y. X., and Tan, Q. K. (2019). A CVaR-robust-based multi-objective optimization model and three-stage solution algorithm for a virtual power plant considering uncertainties and carbon emission allowances. Int. J. Electr. Power and Energy Syst. 107, 628–643. doi:10.1016/j.ijepes.2018.12.012
Ju, L. W., Yin, Z., Zhou, Q. Q., Li, Q. C., Wang, P., Tian, W. X., et al. (2022). Nearly-zero carbon optimal operation model and benefit allocation strategy for a novel virtual power plant using carbon capture, power-to-gas, and waste incineration power in rural areas. Appl. Energy 310, 118618. doi:10.1016/j.apenergy.2022.118618
Kong, X. Y., Xiao, J., Liu, D. H., Wu, J. Z., Wang, C. S., and Shen, Y. (2020). Robust stochastic optimal dispatching method of multi-energy virtual power plant considering multiple uncertainties. Appl. Energy 279, 115707. doi:10.1016/j.apenergy.2020.115707
Li, L. X., Cao, X. L., and Zhang, S. (2022). Shared energy storage system for prosumers in a community: Investment decision, economic operation, and benefits allocation under a cost-effective way. J. Energy Storage 50, 104710. doi:10.1016/j.est.2022.104710
Middelhoff, E., Furtado, L. A., Parise, J. A. R., Ximenes, F., and Florin, N. (2022). Hybrid concentrated solar biomass (HCSB) systems for cogeneration: Techno-economic analysis for beef abattoirs in New South Wales, Australia. Energy Convers. Manag. 262, 115620. doi:10.1016/j.enconman.2022.115620
National Energy Administration (2021). Notice on submitting the pilot program of roof distributed photovoltaic development in the whole county (city, district) [EB/OL]. http://www.hxny.com/nd-58109-0-50.html.
Ning, C., and You, F. Q. (2019). Data-driven Wasserstein distributionally robust optimization for biomass with agricultural waste-to-energy network design under uncertainty. Appl. Energy 255, 113857. doi:10.1016/j.apenergy.2019.113857
Panah, P. G., Hooshmand, R. A., Gholipour, M., and Bornapour, M. (2020). Urban microgrid ancillary service provision using plugin electric vehicle and waste-to-energy CHP. J. Energy Storage 29, 101413. doi:10.1016/j.est.2020.101413
Qin, T., Liu, H. D., and Wang, J. Q. (2019). Profit allocation model of cooperative distributed energy resources based on bargaining game theory[J]. Electr. Power Autom. Equip. 39 (1), 134–140.
Rahimi, M., Ardakani, F. J., Olatujoye, O., and Ardakani, A. J. (2022). Two-stage interval scheduling of virtual power plant in day-ahead and real-time markets considering compressed air energy storage wind turbine. J. Energy Storage 45, 103599. doi:10.1016/j.est.2021.103599
Sui, Q., Wei, G. R., Zhang, R., Lin, X. N., Tong, N., Wang, Z. X., et al. (2019). Optimal use of electric energy oriented water-electricity combined supply system for the building-integrated-photovoltaics community. Appl. Energy 247, 549–558. doi:10.1016/j.apenergy.2019.04.059
Tan, Z. F., Wang, G., Ju, L. W., Tan, Q. K., and Yang, W. H. (2017). Application of CVaR risk aversion approach in the dynamical scheduling optimization model for virtual power plant connected with wind-photovoltaic-energy storage system with uncertainties and demand response. Energy 124, 198–213. doi:10.1016/j.energy.2017.02.063
Teng, Y., Sun, P., Hui, Q., and Chen, Z. (2021). Optimal operation model of micro-energy network considering classification and disposal of biomass waste [J]. Automation Electr. Power Syst. 45 (15), 55–63.
Voswinkel, S., Höckner, J., Khalid, A., and Weber, C. (2022). Sharing congestion management costs among system operators using the Shapley value. Appl. Energy 317, 119039. doi:10.1016/j.apenergy.2022.119039
Wang, R. G., Chen, G., Wang, X. L., Qian, T., and Gao, X. (2021). Two-stage stochastic unit commitment considering the uncertainty of wind power and Electric vehicle travel patterns[J]. Electr. power Constr. 42 (08), 63–70.
Wang, W. R., Ma, Y. J., Maroufmashat, A., Zhang, N., Li, J., and Xiao, X. (2022). Optimal design of large-scale solar-aided hydrogen production process via machine learning based optimisation framework. Appl. Energy 305, 117751. doi:10.1016/j.apenergy.2021.117751
Wang, X. W., and Duan, L. Q. (2020). Peak regulation performance study of the gas turbine combined cycle based combined heating and power system with gas turbine interstage extraction gas method. Energy Convers. Manag. 269, 116103. doi:10.1016/j.enconman.2022.116103
Yang, H. Y., Dou, X., Pan, F., Wu, Q. W., Li, C. B., Zhou, B., et al. (2022). Optimal planning of local biomass-based integrated energy system considering anaerobic co-digestion. Appl. Energy 316, 119075. doi:10.1016/j.apenergy.2022.119075
Zhang, Y. F., Guo, S. Y., Shi, X. P., Qian, X. Y., and Nie, R. (2021). A market instrument to achieve carbon neutrality: Is China’s energy-consumption permit trading scheme effective[J]. Appl. Energy 299, 117338. doi:10.1016/j.apenergy.2021.117338
Nomenclature

Keywords: virtual power plant, robust dispatching, benefit allocation, biomass waste energy, two-stage optimal
Citation: Ju L, Zhou Q, Pan M, Wei W, Wang Y, Sun J and Pan Y (2023) Robust optimal dispatching model and a benefit allocation strategy for rural novel virtual power plants incorporating biomass waste energy conversion and carbon cycle utilization. Front. Energy Res. 11:1181310. doi: 10.3389/fenrg.2023.1181310
Received: 07 March 2023; Accepted: 12 April 2023;
Published: 08 June 2023.
Edited by:
Xueqian Fu, China Agricultural University, ChinaReviewed by:
Wei Gan, Cardiff University, United KingdomNie Yan, Lanzhou University, China
Yue Zhou, Cardiff University, United Kingdom
Copyright © 2023 Ju, Zhou, Pan, Wei, Wang, Sun and Pan. This is an open-access article distributed under the terms of the Creative Commons Attribution License (CC BY). The use, distribution or reproduction in other forums is permitted, provided the original author(s) and the copyright owner(s) are credited and that the original publication in this journal is cited, in accordance with accepted academic practice. No use, distribution or reproduction is permitted which does not comply with these terms.
*Correspondence: Liwei Ju, MTgzNzU4ODQxQHFxLmNvbQ==