 Jun Dong1
 Xihao Dou
 Dongxue Wang
 Peng Jiang
94% of researchers rate our articles as excellent or good
Learn more about the work of our research integrity team to safeguard the quality of each article we publish.
Find out more
ORIGINAL RESEARCH article
Front. Energy Res. , 21 April 2023
Sec. Energy Storage
Volume 11 - 2023 | https://doi.org/10.3389/fenrg.2023.1173981
This article is part of the Research Topic Generalized Energy Storage in Distributed Energy Systems View all 5 articles
In recent years, the power market and regional distributed energy systems (RDES) in China have experienced considerable growth. However, the critical issue of how multi-stakeholder parties within the distributed energy system evaluate risk preferences in order to develop scientifically sound trading strategies remains unclear. To address this problem, this study constructs a multi-agent assisted decision-making model that incorporates the critical features of a regional distributed energy system. By simulating various calculation scenarios using this model, the study aims to provide a better understanding of the system’s multi-agent interactions and decision-making processes. First, different types of stakeholders and risk preferences in RDES are delineated. Second, supply and demand fluctuations in RDRS are treated and the impact of wholesale market price volatility risk on distributed energy system aggregators (DERA) decisions is fully considered. Meanwhile, a multi-stakeholders DERA transaction decision-making model in the day-ahead market considering risk preference behaviors is constructed based on information gap decision theory (IGDT) and solved by the Opposition Learning Grey Wolf Optimizer (OLGWO). The mathematical analysis conducted in this study indicates that the approach proposed could provide an effective trading scheme and operational strategy for multi-interest entities participating in the market of RDES. Therefore, incorporating the proposed approach would be beneficial in enhancing the performance and effectiveness of such systems.
With the continuous promotion of China’s “double carbon” goal, China has put forward a strategy to build a new power system that promotes the consumption of new energy, with RDES becoming an important component. These systems not only play a key role in the consumption of new energy, but also offer flexible regulation capacity. As they gradually expand, many development challenges have emerged. Firstly, China’s market types are diverse and the complexity of the market is increasing, which poses a challenge to the ability of distributed energy systems to participate in the market. Secondly, the current distributed energy trading system in China lags behind, with no perfect institutional system in place. As a result, the trading format of distributed resources is not fixed. Thirdly, the construction of RDES involves a high investment cost and is not carried out by a single subject, but by multi-stakeholders, which poses a greater challenge for developing trading strategies for distributed energy systems with multiple interest subjects. P2P or P2G transaction mode design of shared energy storage or shared energy storage with multiple agents in RDES (Rodrigues et al., 2020; Zheng et al., 2022), Demand response service mode analysis based on intelligent contract (Di Silvestre et al., 2020), P2P transaction research with electric vehicles (Kang et al., 2017), etc. The research on the trading strategy of distributed resources mainly focuses on the operation strategy of independent wind and PV generation units, microgrids (Nguyen and Le, 2014; Mirzaei et al., 2020) or virtual power plants (Mashhour and Moghaddas-Tafreshi, 2010; Sadeghi et al., 2021), and so on, which is the basis for the decision-making of trading declarations. However, this kind of research ignores the risk preference of decision makers in the complex market environment and the subjective psychological factors facing risks. Therefore, it is necessary to study the power transaction assistant decision-making problem of DERA in depth.
As the world’s electricity market continues to improve and develop, formulating reasonable trading strategies for market players to better participate in the market has become a key focus of research. Traditional power generation enterprises have been the main focus of research on market trading strategy, with various bidding strategy formulation methods being proposed. These methods include transaction strategy formulation models that consider cost (Yang et al., 2020), transaction strategy formulation models that consider unit optimal operation (An et al., 2020; Shamsi and Cuffe, 2021), transaction strategy formulation models based on game theory (Jin et al., 2020; Wu et al., 2020), and transaction strategy formulation models based on agent simulation (Monroe et al., 2020; Shinde et al., 2021).
The trading strategies can be divided into two categories: those based on financial information and those based on market behavior. The first model of trading strategy formulation focuses on the operating characteristics of the entity and the financial information of the market subject itself. This enables it to identify more accurate financial cost information, including marginal cost and electricity gross profit. Based on this information, the model formulates the most economically valuable trading strategy to reflect the enterprise’s value participating in the transaction. This model tends to give more importance to its financial operations and ignore the impact of other market subjects decision-making on the trading plan. Overemphasis of enterprises’ cost structure leads to conservative decision-making schemes and underutilization of the bidding space of market players. The second model of trading strategy emphasizes the game behavior amongst market players, leveraging the interactive relationship between them to identify the best trading strategy at market equilibrium. Such schemes can better reflect the market’s interaction and ensure the trading strategy to be implemented in the market. However, these schemes generally use their marginal costs as the game’s boundary condition. This approach may not fully reflect their financial situation and may result in financial and trading strategies predicting unequal returns.
However, there have been relatively few studies on the transaction decision-making of new energy due to the instability of its output. The new energy participation in the market mainly adopts the form of volume non-quoting. Therefore, it is more important for new energy participation in the market to formulate a reasonable output plan and reduce deviation assessment (Lu et al., 2021; Yu. et al., 2021). Some experts have proposed using the output of distributed energy systems as the income function of the game, taking the market transaction price and social welfare as the basis for formulating a reasonable trading strategy through market equilibrium theory. This model helps to improve the income of the distributed energy system (Li et al., 2017; Wang et al., 2021; Yang et al., 2022). However, this model requires a comprehensive understanding of the market, a large amount of data, and higher prediction accuracy of new energy output. It is not possible to fully trial the distributed energy system, and the composition of many distributed energy systems is more complex, making multi-agent collaborative decision-making more important (Fang et al., 2021; Sun et al., 2022; Wang et al., 2022a; Wang. et al., 2022a; Zhu et al., 2022). Therefore, this paper focuses on the trading decisions of multi-stakeholders in distributed energy systems and their behavioral preferences to achieve multi-stakeholder trading strategies.
Currently, research on distributed energy trading focuses on centralized dispatch or single-entity internal operation, and generally verifies the validity of the model through arithmetic analysis and sensitivity analysis (Golla et al., 2022; Yu et al., 2022). Some studies model the problem of joint bidding for multiple resources, but most of them are based on an overall single decision preference, without considering the impact of individual risk preference differences within the system on unified decision-making (Ullah et al., 2022; Yan et al., 2022). With the development of RDES, the system will present the characteristics of multi-investors in the future (Lei et al., 2021). It is very difficult for RDES to determine the trading strategy based on the single risk preference of aggregators. Therefore, research on the influence of the risk preference of different trading agents on RDES’s trading decision is of great significance to promote the sustainable development of the system.
This paper constructs an auxiliary decision-making model for day-ahead trading based on the risk preferences of different subjects, considering the development trends of RDES and the electricity market, as well as the RDES trading characteristics with multi-stakeholders. To develop scenarios for wind and solar output and load, FCM is initially used. Subsequently, a decision optimization model for day-ahead trading and a day-ahead trading cost function are constructed to minimize the overall operating cost of RDES. The IGDT model is then used to quantify the deviation between the day-ahead clearing price and predicted price. The proposed day-ahead trading decision model, which considers multi-stakeholders’ risk preferences, is based on the IGDT model. Finally, computational examples are used to analyze the range of fluctuations of uncertainty factors and the decision results of the subject under the given expectation to verify the validity of the proposed model.
This paper addresses the need to develop an effective trading strategy for the distributed energy system in China by considering the risk preferences of different stakeholders. The research focus is to construct an auxiliary decision-making model that takes into account the transaction characteristics of each interest subject in the distributed system. Several innovative points are presented.
Firstly, while most research on distributed energy systems concentrates on optimizing their operation, this paper proposes an optimization method for developing spot trading decision schemes for distributed energy systems, which can provide a useful reference.
Secondly, given the complex composition structure of China’s distributed energy system, with mixed investment as the norm, all parties’ transaction characteristics need to be considered to ensure successful trading.
Therefore, the paper adopts the IGDT model, combines the risk preference characteristics of different stakeholders, and tests various combination schemes to verify the effectiveness of the trading strategy. Lastly, since a complete trading rule has not been formed for the distributed energy system, and the data involved are complex and uncertain, the paper uses FCM and OLGWO to improve the accuracy of the model solution when dealing with output prediction and trading decision-making, respectively.
With the accelerated process of China’s electricity market, it is possible to allow various types of DERA to participate in power trading in the regional wholesale market in the future. In this paper, we focus on the auxiliary decision-making problem of RDES participation in the day-ahead spot market. Based on the experience of domestic and foreign power market construction and the current situation of related research, this section proposes a trading model in which RDES follows the principle of “self-generation and surplus power online” in the power market, and the grid underwrites the deviated power for point-to-point trading. In other words, the system’s internal renewable energy output is prioritized for consumption, and the under/over-generated portion is purchased/sold from the main grid. Distributed energy sources (DES) participate in the main grid wholesale electricity market through DERA, where system internal entities are free to trade directly (Guerrero et al., 2020). Taking the RDES containing multiple interest subjects as an example, its transaction model is shown in Figure 1. Where ①-③ represent the interest subjects that trade through DERA.
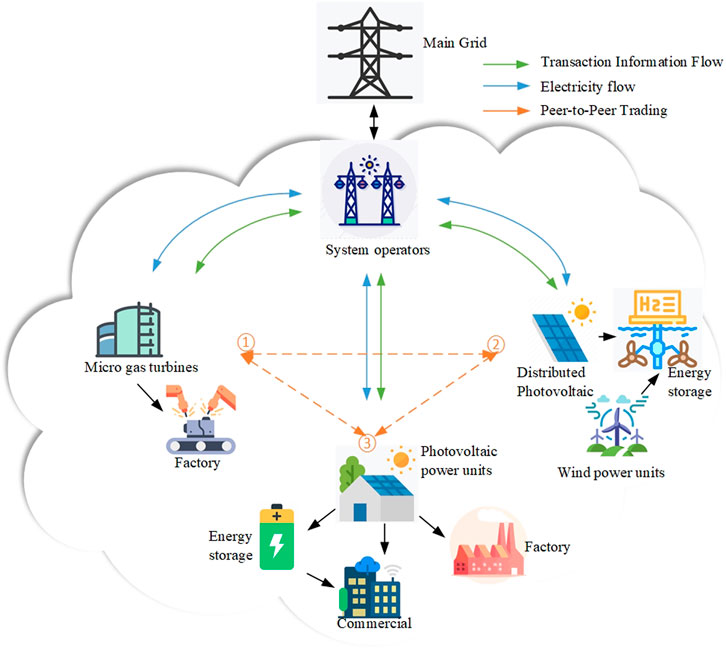
FIGURE 1. Electricity trading mode of RDES with multi-stakeholders.
DERA is responsible for organizing the internal power transactions of RDES and has certain management control authority over internal resources. In addition, DERA is responsible for developing the system’s external trading strategy and for the rational allocation of system revenues and costs. The role of DERA in RDES is shown in Figure 2.
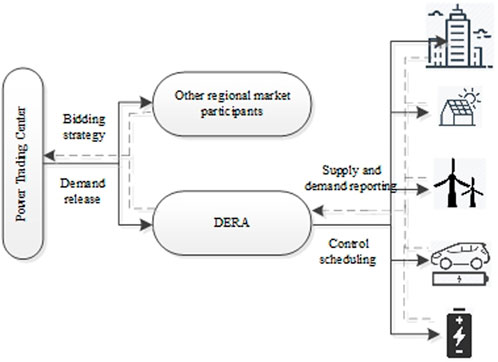
FIGURE 2. The role of DERA in RDES.
Berkeley Laboratory’s article “Location Value of Distributed Energy” highlights that the initial investment required for a distributed energy system is relatively high, making it more suitable for economically developed regions. Based on the experience from the construction of Zhucheng in Shandong and Jiangshan in Zhejiang, the installation of distributed energy systems in China entails collaborative investments and construction among multiple stakeholders. This not only reduces the risk of installation but also enhances its feasibility. Distributed energy systems are characterized by decentralization, which means that they do not operate as the centralized management of a few experienced technicians but as a decentralized strategy. This leads to various systems during the operation and transaction processes. Considering the characteristics of the decentralized operation and the behavior of the different stakeholders within the system, implementing market transactions based on a single subject is not suitable for the current construction of distributed energy systems. It cannot provide feedback on the behavioral characteristics of internal system stakeholders, nor does it completely reflect the decentralized management requirements of distributed energy systems. A risk preference analysis of the various stakeholders in distributed energy systems can refine the risks involved and increase system operational efficiency.
The main risk concerns for RDES to engage in power trading are the market price ambiguities and system supply and demand. Forecasting unit output, electricity load, and market price, as well as addressing unknown elements such as forecasting deviation, are critical components of DERA’s day-ahead trading decision. Therefore, first, the scenarios of RDES supply and demand fluctuation are reduced using FCM, and a typical wind power and PV output scene are proposed. Second, under limited information, the uncertainty of market price fluctuations is handled using IGDT to provide a decision basis for DERA participation in day-ahead trading.
In a regional distributed energy system, the fluctuation in supply and demand mainly arises from the variations in the output of distributed wind power and photovoltaic units, as well as the changes in energy consumption behavior of users in the system. Presently, the commonly used methods to address the variability in output scenarios are largely based on probability density functions. Thus, this section employs the Fuzzy C-Means Clustering (FCM) algorithm to cluster historical data of output and load, in order to obtain typical scenarios of supply and demand in the regional distributed energy system, along with their probabilities of occurrence. This transformation of uncertain scenarios into strategic problems under deterministic scenarios is intended to provide a more reliable and efficient approach for managing the system’s energy fluctuations. The FCM algorithm was first proposed by E. Ruspini and then further developed into a fuzzy clustering algorithm by J. C. Dunn and J. C. Bezdek from a hard clustering algorithm. Unlike the traditional K-means clustering method, the FCM algorithm employs fuzzy mathematics and utilizes a membership function to represent the degree of membership of data points and clustering centers. For a given sample,
1) Initialization of the membership matrix. The initial membership matrix is generated using random numbers in the range of [0, 1], and it satisfies Eq. 1.
Where
2)The FCM algorithm involves calculating the clustering center using the following Eq. 2:
The parameter
3)Calculating the objective function value, which is defined by Eq. 3.
Where,
4)Update the membership matrix by applying Eq. 4.
5)Repeat the iteration steps (2)–(4), so that the objective function value is continuously reduced until convergence.
The FCM algorithm is an unsupervised fuzzy clustering method, which means it does not require human intervention during the algorithm implementation process. However, the algorithm does have some limitations, such as the requirement to set parameters in advance, and the initial selection of parameters can have an impact on the clustering results.
China’s electricity spot market is still in its early stages of development. The price mechanism of China’s distributed energy trading market requires improvement, and the trading data are insufficient to accurately describe the impact of market price fluctuations on trading decisions. Therefore, considering that the IGDT model does not need to rely on large-scale data for probabilistic statistical analysis, this paper employs the IGDT model to deal with the uncertainty of market price fluctuations in the case of limited market information to provide a scientific foundation for RDES to participate in power trading-assisted decision-making.
Typically, the IGDT model consists of three parts, which are the system model, the uncertainty model (Ben-Haim, 2004), and the performance requirement (Zhao, 2020) or implementation requirement.
The uncertainty of the spot wholesale market price is modeled using the IGDT’s uncertainty processing model, as shown in Eq. 5.
where
To reflect the decision effects under different risk preferences, IGDT is used to develop a robust optimization model and an opportunity optimization model. The robust optimization model seeks the greatest possible range of market price fluctuations while ensuring that the decision outcome is not less than expected, as expressed in Eq. 6.
where Q is the purchasing power of the DERA,
Corresponding to the robust function, the IGDT chance model can be expressed as Eq. 7.
where
To minimize the operating cost of RDES, DERA determines the unit operating state by optimizing the reporting strategy. Therefore, the operating cost function for DERA’s participation in day-ahead trading is shown in Eq. 8.
Where,
1) The cost of power purchased by the system from the main grid at time t, as shown in Eq. 9.
where
2) Fuel cost, as shown in Eqs. 11–13.
where
3) Operation and maintenance costs, as shown in Eq. 14.
where
The objective function of a DERA’s day-ahead trading strategy is shown in Eq. 17.
The constraints for each type of resource in the system are shown in Eqs 18–40.
1) PV
2) Wind power
3) Micro gas turbines (MT)
1) Equipment output constraint
where
2) Equipment start-stop constraints
where
3) Climbing power constraint
where
4) Rotate alternate constraint
(4) Gas fired boiler
where
5) Electrochemical energy storage
where
6) Suction chiller
where
(7) Electric chiller
where
8) Transaction constraints with the main network
where
9) Power balance constraints of system operation
where
When RDES containing multiple stakeholders participate in day-ahead market electricity trading, there are
The day-ahead trading opportunity decision model is shown in Eq. 42.
where
Robust bidding subjects are risk-averse in their bidding decisions and prefer to obtain more robust decisions by increasing their costs (Dong et al., 2023). Therefore, the physical meaning of the IGDT robust bidding model is to find the worst-case scenario of market price fluctuation by using optimization methods under the given cost expectation. At the same time, none of the costs obtained may be higher than their expected costs. On the contrary, the opportunistic bidding subjects are risky and speculative in their bidding decisions, and they are more willing to chase the minimum possible cost under high risk and the decision is more aggressive. Therefore, the physical meaning of the IGDT opportunity bidding model is that, under the given cost expectation, the optimization method is used to find the scenario with the minimum market price fluctuation, and the minimum cost that the decision subjects can achieve is their expected cost when the market price varies within the range of opportunity fluctuation.
Both the robust model and the opportunity model are essentially two-layer optimization models. The outer and inner layers of the robust model are the maximum cost and maximum deviation that DERAs can pay when the market price fluctuates, respectively. The outer and inner layers of the opportunity model are the minimum cost and the minimum deviation that DERAs may pay when the market price fluctuates. From the cost function shown in Eq. 42, it is clear that DERAs’ electricity trading costs are affected by market price fluctuations. The DERA transaction cost is maximum when the market price is taken to be maximum within the uncertainty range. Conversely, the cost is minimized when the market price is taken to be the smallest within the uncertainty range. As a result, the equivalent forms of the IGDT robust model and the opportunity model for the day-ahead trading decision can be represented by Eqs 43, 44, respectively.
where
where
This paper employs the IGDT model to address subject risk preferences. The IGDT model is composed of a two-layer optimization problem, where the participation in the day-ahead trading strategy is continuously iterated based on the upper market volatility and the minimization of the day-ahead trading cost in the lower layer. To solve this constitutive model, the Opposition Learning Grey Wolf Optimizer (OLGWO) is utilized due to the significant number of constraints involved (Zhang et al., 2021a).
The OLGWO is a variant of the Grey Wolf Optimizer (GWO) that simulates the social hierarchy of a group of grey wolves using four distinct layers, namely,
As the number of iterations increases, individual grey wolves in the Grey Wolf Optimizer algorithm tend to move towards the same region, which can lead to convergence and increase the risk of falling into local optima. However, the use of a reverse learning strategy can help to mitigate the risk of local optima and enhance the speed of the algorithm in finding the best solution. Additionally, to identify the most promising
In the formula, the variables
where
In the process of searching for an optimal solution to a given function, initial solutions are often chosen randomly. If a solution is close to the optimal solution, it can converge quickly. However, if it is far from the optimal solution, convergence may be slow or even in the opposite direction. To address this issue, this paper introduces a backward learning strategy in the classical gray wolf search iteration process. In this strategy,
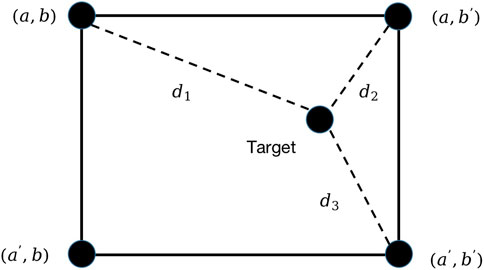
FIGURE 3. Reverse learning strategy displayed in a two-dimensional coordinate system.
The traditional gray wolf optimization algorithm determines the optimal solution through the best position selected by the head wolf after multiple iterations. Nevertheless, the head wolf’s movement trend during the hunting process tends to increase in the same area, resulting in reaching a local optimal solution. To address this, this paper proposes the OLGWO. Essentially, this algorithm adds head wolves that move in the opposite direction based on the head wolf’s hunting trend. Additionally, the correlation coefficient carries out correlation traction between the head wolf and the bottom wolf to ensure that they are not under control during the hunting process. Hunting is carried out in reverse and multi-angles using the bottom wolf’s initial position to discover more potential bottom wolves. Since reverse learning doubles the hunting direction, the likelihood of comprehensively selecting the better one can be increased by nearly half. As a result, it is possible to closely approach the global optimal solution and improve the optimization speed of the OLGWO. This algorithm was compared with PSO, GWO, and others in terms of optimization results’ mean and standard deviation in the article (Xing-hui et al., 2021b), where it effectively avoided local optimal solutions and consequently increased the optimization speed. To achieve a global optimal solution, this paper conducts multiple optimization solutions using different risk preference schemes.
The paper presents a comprehensive model for power transaction auxiliary decision-making in distributed energy systems. This model takes into account the risk preferences of multiple stakeholders, as shown in Figure 4.
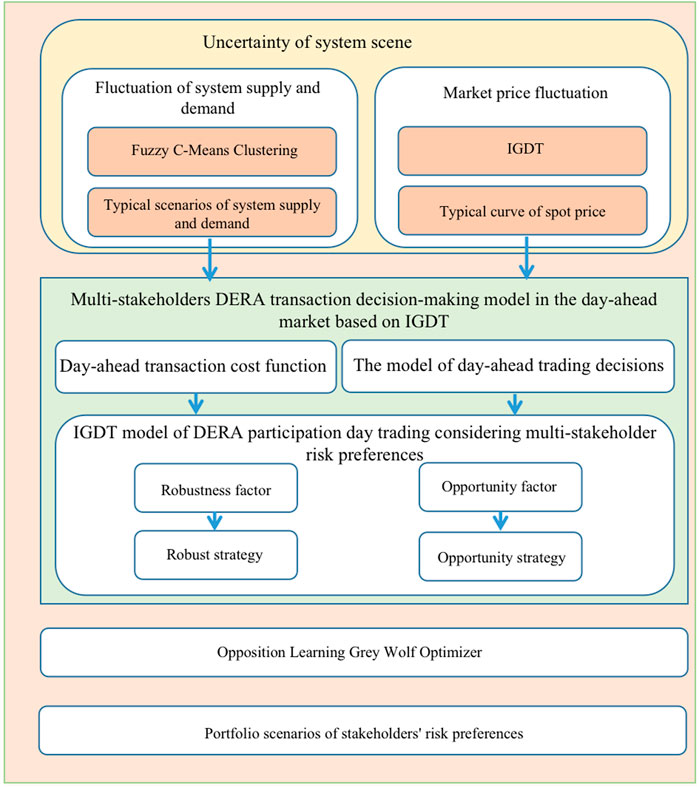
FIGURE 4. The diagram of the model architecture.
In this section, RDES containing gas-fired power plants, wind farms, and low-carbon communities are used as examples. It is assumed that all three types of resource subjects show risk preferences in trading decisions. DERA determines the final trading strategy of RDES by considering the risk preferences of different stakeholders. The population size in this section of the model is set to 100 and the maximum number of iterations is 8000. The simulation model is implemented through Python 3.7.
The MT and wind power are rated at 4MW and 10 MW respectively. 2 MW of rooftop PV, commercial and residential customers are included in this low carbon community. The maximum electrical, thermal, and cooling load requirements are 10 MW, 4 MW, and 2.5 MW, respectively, and the technical and economic parameters of each type of unit are shown in Tables 1, 2, 3.
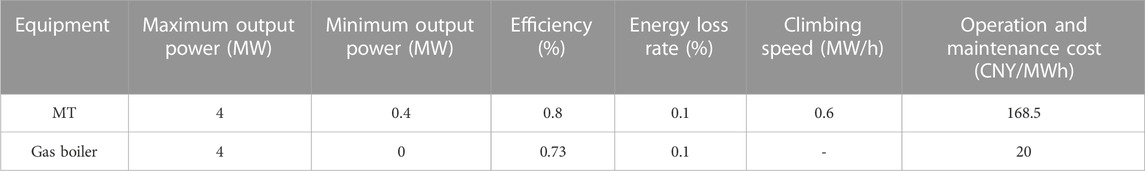
TABLE 1. Technical and economic parameters of micro gas generating unit.

TABLE 2. Technical and economic parameters of wind power units.
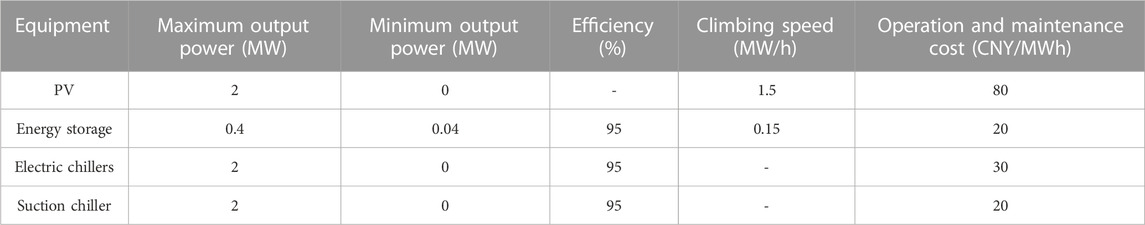
TABLE 3. Technical and economic parameters of equipment in low-carbon community.
In addition, the gas price is 3.24 CNY/m3, the low calorific value of natural gas is 9.7 MJ/m3, and the conversion efficiency of the waste heat boiler is 75%.
The decision time for DERA to participate in day-ahead trading is set to 24 h, with each hour being a decision unit.
First, this section selects the 87-day historical output curves of distributed wind power and PV in the summer of a province in China, and uses the FCM algorithm to screen the typical scenarios of wind power and PV unit outputs. Table 4 shows the probability of each scenario.
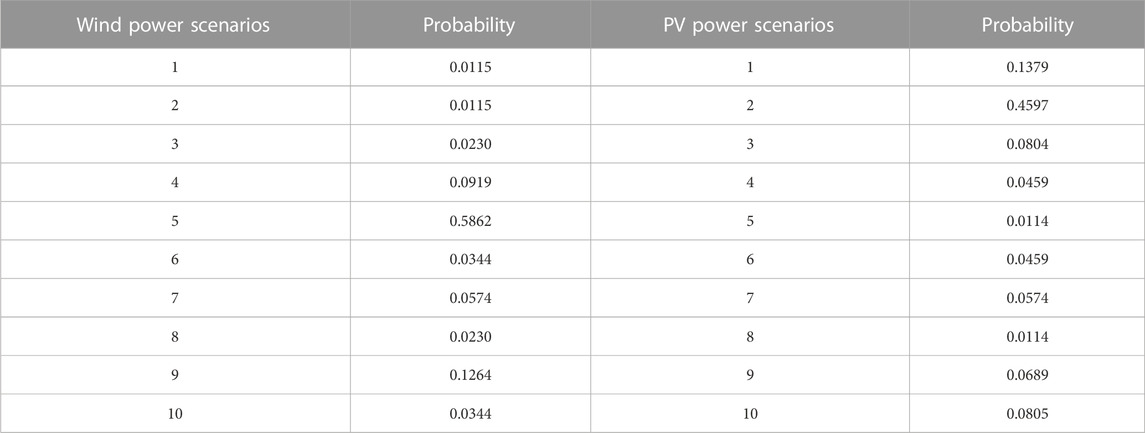
TABLE 4. Probabilities of ten sets of wind and PV power scenarios.
Therefore, the expected output scenarios of distributed wind power and PV are obtained as inputs to the IGDT model based on the occurrence probability of each type of scenario, as shown in Figure 5A.
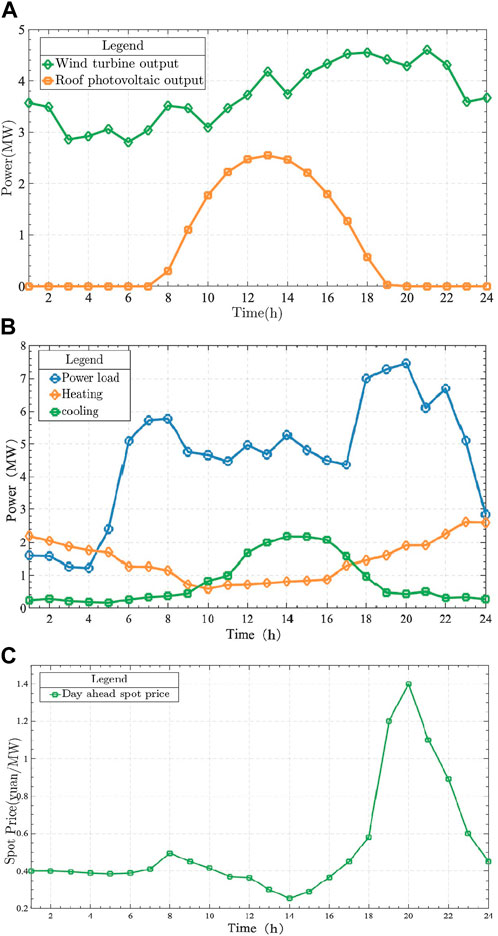
FIGURE 5. Basic scenarios of RDES.
Similarly, the FCM algorithm was used to obtain typical data of various RDES loads from the historical data of power, heat, and cooling loads of an industrial park in central China, as shown in Figure 5B.
In this section, a spot pilot historical clearing price in China is selected as the forecast data of electricity price for the trading decision model, as shown in Figure 5C.
Based on the risk preferences of the multi-stakeholders in RDES, there are eight risk preference scenarios for DERA in bidding decisions, as shown in Table 5. The risk preferences of the stakeholders in the other models differ from each other, while the risk preferences of the market players in models 1 and 8 are consistent.
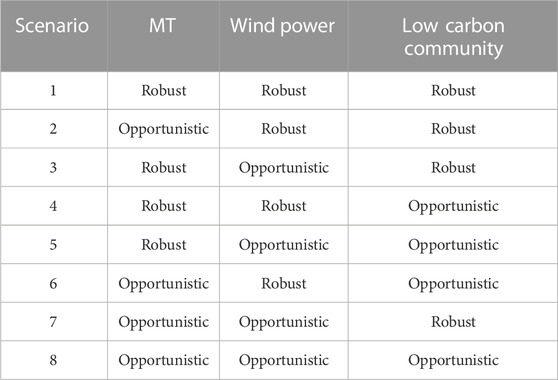
TABLE 5. Multi-stakeholder risk preference combination scenarios in RDES.
When the risk preferences of the stakeholders are not considered, the trading decision is determined according to the risk preferences of DERA, that is, the system is a single robust decision or an opportunistic decision. By solving the day-ahead trading strategy optimization model, the minimum operating cost of RDES can be obtained as 57872.7 CNY when market price fluctuations are not considered. For the robust DERA, when the subjects in the system show the same preference and the robustness factors are all 0.3, the expected operating cost of the system is 51363.06 CNY and the robustness deviation is 0.254. This result indicates that the expected operating cost of the system is not higher than 51363.06 CNY when the market price fluctuation does not exceed 25.4%. The day-ahead trading bid strategy for the DERA is shown in Figure 6A.
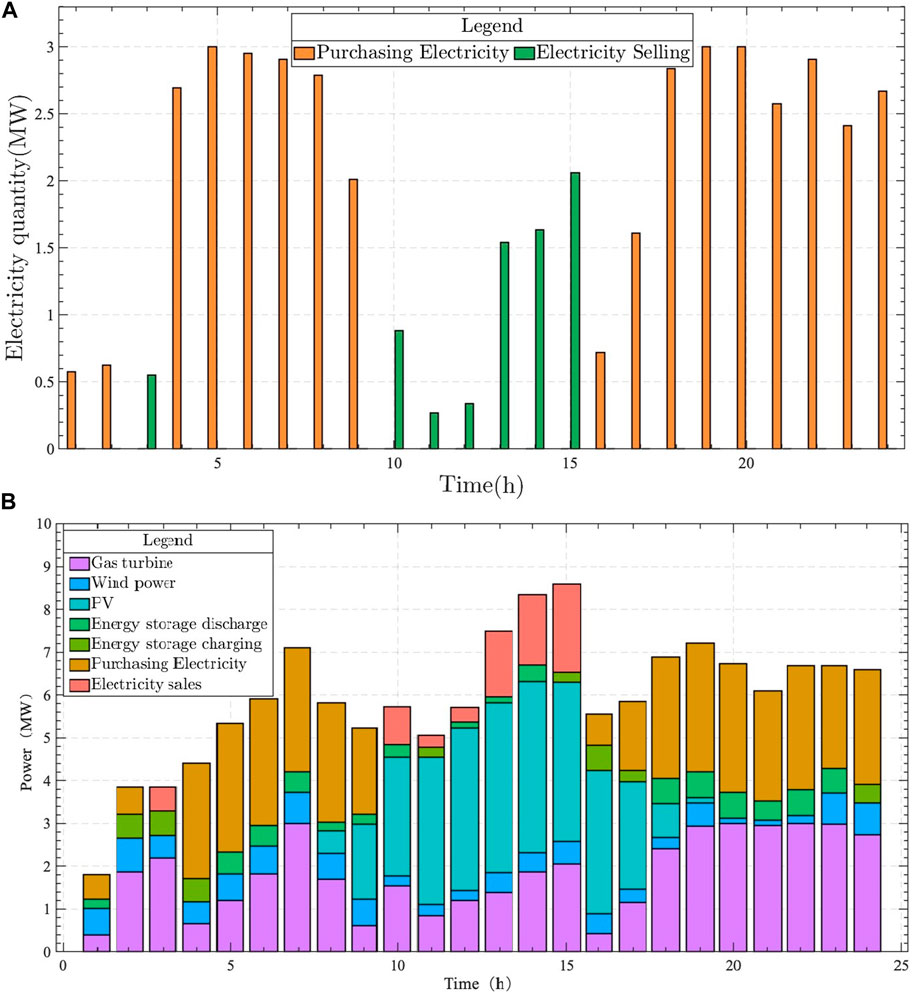
FIGURE 6. Robust trading decision scheme and electrical unit output.
As can be seen from Figure 6A, during the hours of 3:00 and 10:00–15:00, the overall supply of RDES is greater than the demand, and DERA carries out surplus power to the grid, with the maximum power sold being 0.6862 MW. The system’s supply is less than the demand during the other hours, and it needs to purchase power from the main grid, with the maximum power purchased being 1 MW.
In the robust decision scenario, DERA’s power purchase cost for participating in the day-ahead power trading is 46035 CNY and the revenue from power sales is 7603 CNY. It is worth noting that DERA’s power sales to the main grid mainly occur when the combined PV and wind power output is high, and the system is closest to the supply and demand balance at 11:00. In addition, the robustness factor reflects the decision maker’s tolerance for risk, and DERA’s day-ahead trading bid strategy changes when the robustness factor varies between 0.1 and 1. As the robust factor increases, the system supply-demand deviation generally increases. The situation is because DERA’s strategy becomes more conservative as the robust factor increases, and the range of tolerable external market price fluctuations increases, exhibiting risk-averse characteristics. The output of each generating unit in the system under the robust decision scheme is shown in Figure 6B.
Similarly, when all stakeholders in RDES show the same risk-chasing preference and the opportunity factor is 0.2, the expected cost level of the system is 23469.47 CNY and the opportunity deviation factor is 0.24. This result indicates that the minimum operating cost of RDES can be 23469.47 CNY when the market price fluctuation exceeds 24%. The day-ahead trading bid of the DERA strategy is shown in Figure 7A.
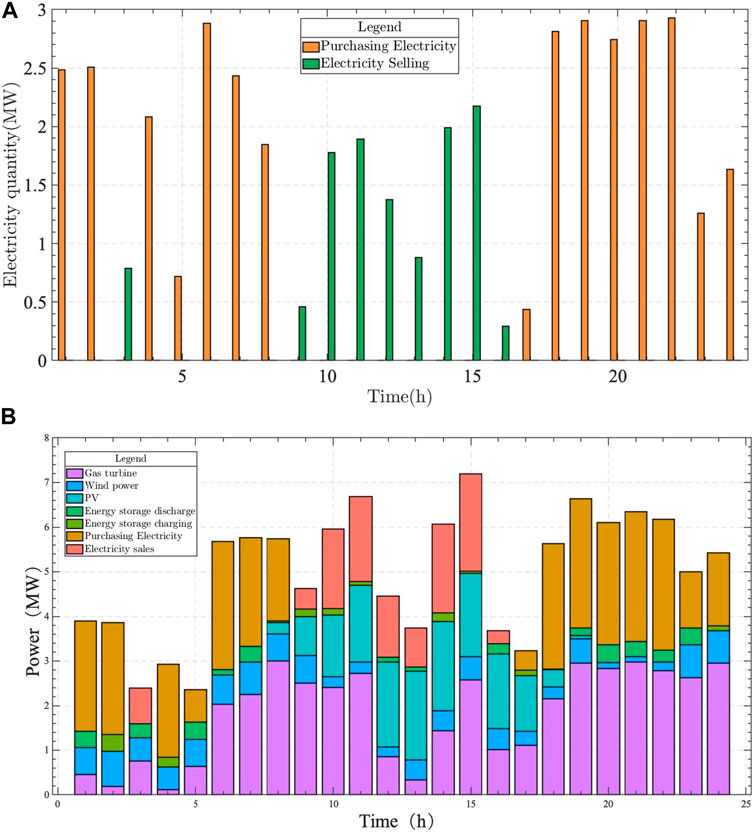
FIGURE 7. Opportunity trading decision scheme and electrical unit output.
As can be seen in Figure 7A, at 3:00 and 9:00–16:00, the overall supply of RDES is greater than the demand, and DERA carries out surplus power to the grid with the maximum power sold of 2.176 MW. The system has less supply than demand at other times and needs to purchase power from the main grid with the maximum power purchase of 2.929 MW. The cost of power purchase for DERA to participate in the day-ahead power trading in the opportunity decision scenario is 6,361 and the revenue from electricity sales is 1189 CNY. It is worth noting that DERA’s power sales to the main grid mainly occur during periods of high wind power output. In addition, as the opportunity factor increases, the aggregator’s strategy tends to chase risk more, the range of deviations from market price fluctuations to chase decreases, and the probability of achieving the optimal strategy while meeting cost expectations decreases, and DERA exhibits risk-chasing characteristics. The output of each generating unit in the system under the opportunity-based decision scheme is shown in Figure 7B.
When all stakeholders in RDES show robust strategy preferences (scenario 1) or all opportunistic strategy preferences (scenario 8), the DERA final decision is the same as the stakeholders’ trading strategies. In which, the robustness and opportunity factors are assumed to be the same for each stakeholder under the same risk preferences. When MT, wind power farm, and low carbon community in RDES are opportunistic, robust and robust respectively (scenario 2), the expected cost levels and robust and opportunity factors of each stakeholder are shown in Table 6.
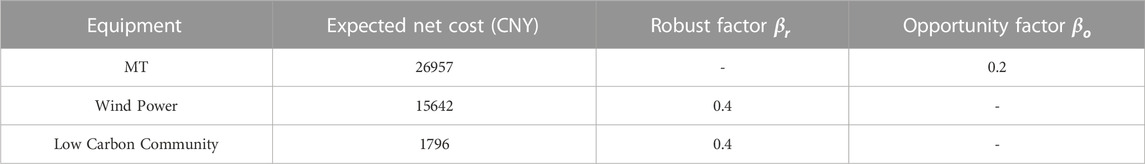
TABLE 6. Risk preferences of participants in RDES.
From the perspective of the overall operational efficiency of RDES, the expected cost of each stakeholder is its actual operational production cost when the power trading situation between the subjects within RDES is not considered. The costs of gas-fired power plants mainly include fuel costs and operation and maintenance costs. The wind power plant and low carbon community costs are mainly equipment operation and maintenance costs. When the gas power plant is opportunity preference and the opportunity factor is 0.2, if the wind power station and low carbon community are robust preference and the robust factor is 0.4, then the day-ahead trading strategy of DERA is shown in Figure 8A.

FIGURE 8. Trading strategies and operation scheduling of electrical units of DERA in scenario 2.
As seen in Figure 8A, in Scenario 2, DERA sells the surplus of the system to the main grid with a maximum sale of 2.576 MW during 3:00–5:00 and 9:00–16:00, and purchases power from the main grid during the other periods. The cost of power purchase for DERA is 21462.616 CNY and the revenue from power sales is 4597.589 CNY. In addition, although the results show that wind farms and low-carbon communities show robust preferences in trading, the overall system opportunity preference is stronger due to the expected cost level of gas-fired power plants. The minimum deviation from the average market price fluctuation at this time is 0.13. The operating states of each unit in RDES are shown in Figure 8B.
In Figure 8B, the horizontal axis indicates period t, and the vertical axis shows DERA’s participation in the day-ahead market power purchase and unit operation at time t. There is a close relationship between gas-fired unit output and new energy output. At noon, the gas-fired unit output decreases in the figure because the wholesale market spot price becomes lower at noon due to the abundance of centralized PV resources in the wholesale market, and DERA’s power purchase cost is smaller than the gas-fired unit generation cost at this time. Therefore, it is economical for DERA to choose gas-fired units to maintain a minimum output.
Similarly, the risk appetite factors and expected cost levels for gas-fired power plants, wind farms, and low-carbon communities in other scenarios are shown in Table 7.
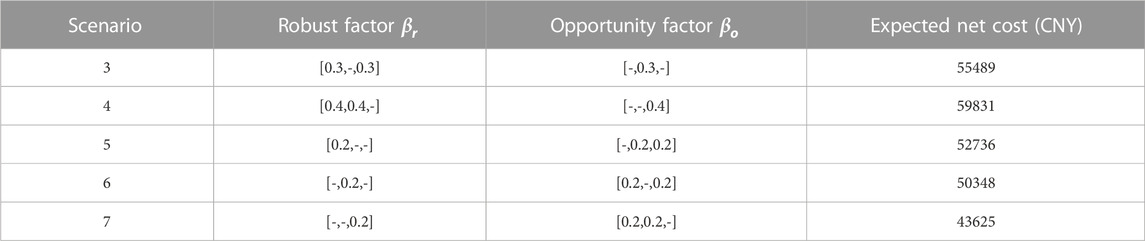
TABLE 7. Analyses result in the other scenarios.
By solving the day-ahead trading decision model considering multi-stakeholder risk preferences, the obtained day-ahead trading strategies for DERA in each scenario are shown in Figure 9.
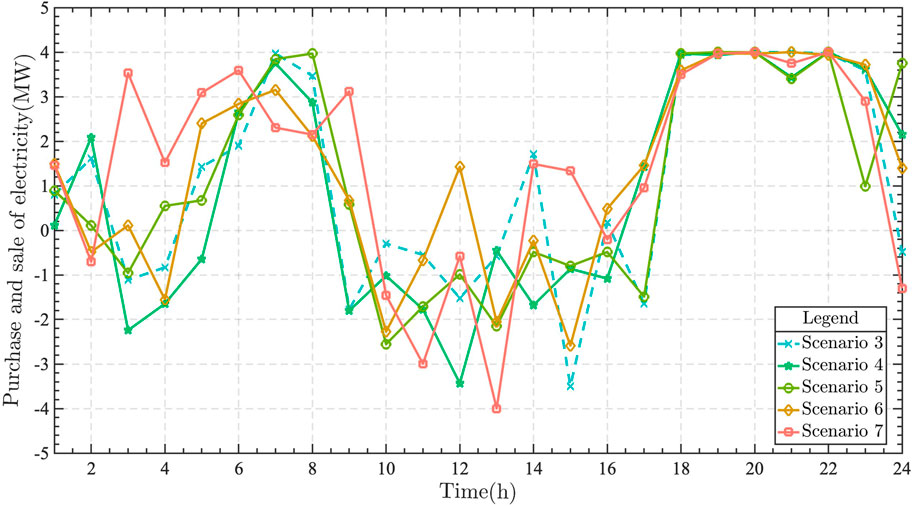
FIGURE 9. Trading strategies for RDES in scenario 3-7.
In Figure 9, the horizontal coordinates indicate the time, and the vertical coordinates indicate the purchased and sold power traded by DERA with the main grid at time t. When the traded power is positive, it means that the supply of RDES is less than the demand, and it needs to purchase power from the main grid. When the traded power is positive, it means that the RDES supply is less than the demand, and power needs to purchase from the main grid. When the traded power is negative, it means that the RDES supply is greater than the demand and sells the power to the main grid. The simulation results show that DERA shows an overall robust preference under scenarios 3, 4 and 5, while it shows an overall opportunistic preference in scenarios 6 and 7. By comparing scenarios 3 and 4, it is found that the choice of gas-fired power plants for risk preference has a greater impact on the decision outcome of DERA compared to wind farms and low-carbon communities. Therefore, it can be concluded that stakeholders with high expectation costs in RDES dominate the decision-making.
The operating cost of a distributed energy system is impacted by the level of risk involved in conducting market transactions. This paper examines the relationship between risk and operating cost by analyzing the risk coefficient of a market situation involving the same risk appetite. A sensitivity analysis of cost is then performed using the equation cost factor = (optimized cost—expected cost)/risk coefficient. The result is shown in Figure 10.
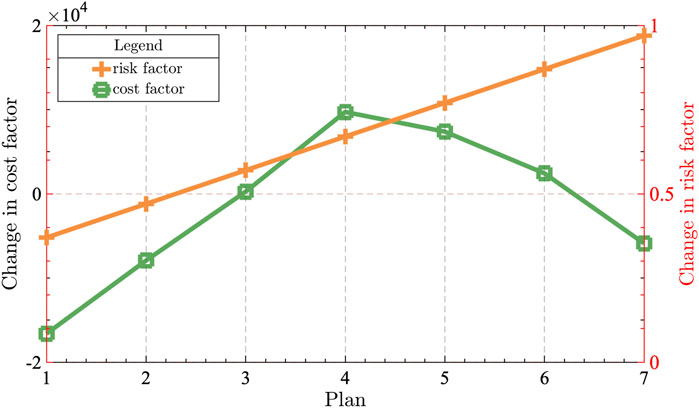
FIGURE 10. Risk factor and cost factor interaction trends.
It can be seen from the table that the curve is steeper when the risk aversion is lower than 0.5, indicating a strong correlation between cost and risk coefficient. However, the cost coefficient is negative due to the system’s increased wind power generation and consequent increase in power purchase cost when the risk coefficient is too low, i.e., aggressive. When the risk coefficient is higher than 0.9, the system tends to be more conservative, reducing the level of new energy generation to ensure stability. This, in turn, leads to increased operating costs for traditional energy sources. In the range of 0.5–0.8, the cost coefficient is positive, indicating that moderate risk levels facilitate optimization of the system’s cost structure.
This paper utilizes Python 3.7 as the programming platform and the widely used commercial software CPLEX for solving the problem. This model is a MINLP model. Table 8 presents the variables and constraints solved in this paper, as well as the solution’s performance.
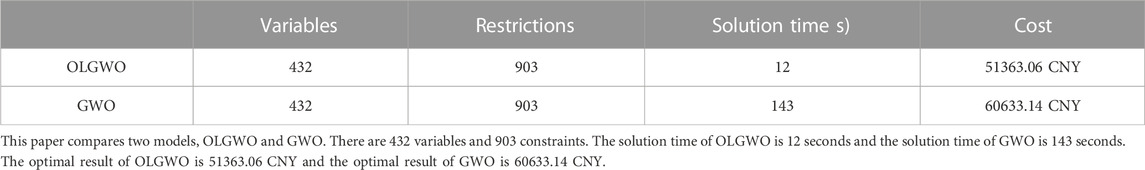
TABLE 8. Model solving performance.
This paper includes 432 variables and 903 constraints, and the OLGWO algorithm proposed herein takes approximately 12 s to complete. As the energy trading period in the day-ahead market is in 15-min intervals, the proposed algorithm can also be used for actual trading decisions. After the improvements made, a comparison of the solution results between the proposed OLGWO algorithm and the conventional GWO algorithm shows that the solution’s efficiency significantly improved. Compared to the conventional GWO algorithm, using the OLGWO algorithm saves 113 s in solution time. Additionally, using the OLGWO algorithm to solve the problem can further reduce the operating cost of the distributed energy aggregator, indicating that the improved algorithm avoids falling into a local optimal solution to a certain extent.
Through the above case study, the transaction-assisted decision model proposed in this paper can help multi-interest entities within the distributed energy system to develop reasonable transaction strategies and clarify the operating costs of system operation under the scenarios of robust and opportunity strategy combinations of different entities. Distributed energy aggregators can use the cost situation of different market operation scenarios as one of the indicators for future system planning, and in addition, the cost of different subjects obtained from the transaction-assisted decision model can be used as a criterion for benefit allocation.
In this paper, we propose an assisted decision model for day-ahead RDES trading that considers the preferences of multiple risk subjects. The model addresses the problem of different risk preferences of multi-interest subjects. It is based on the operational characteristics and trading process of such systems.
First, we use FCM and information gap to mitigate the uncertainty of spot market price fluctuations and scenic power output.
Second, we analyze the risk preference combination scenario of RDES subjects, and construct a trading decision model for the system based on the IGDT model that considers the risk preferences of multi-interest subjects. We solve the IGDT problem using OLGWO.
Lastly, we analyze the arithmetic results to demonstrate that the system’s trading strategies change during periods of increased or decreased robustness or chance factors for the subjects within the RDES. Moreover, in systems with multiple interested parties, different cost estimation levels can greatly affect their risk preferences and alter the overall operation scheme of the system.
The proposed assisted decision-making model that considers the risk preferences of multiple subjects can help different stakeholders in a RDES make more reasonable trading decisions to some extent. This can benefit the builders of RDES in better planning system structure.
The current study focuses on the behavior of market players. However, the Chinese electricity market differs from foreign complete markets. Therefore, we need to explore the decision characteristics of players in both complete and incomplete markets based on the actual nature of China’s dual-track electricity market. Moreover, the cost analysis system incorporates an internal multi-subject benefit distribution mechanism based on the behavioral preferences of diverse market participants.
The original contributions presented in the study are included in the article/supplementary material, further inquiries can be directed to the corresponding author.
JD: conceptualization, validation, supervision, and project administration. XD: conceptualization, software, validation, formal analysis, writing—original draft preparation, and visualization. DL: methodology, software, validation, and investigation. AB: data curation. DW: writing—review and editing. YZ: resources. PJ: resources.
The authors declare that the research was conducted in the absence of any commercial or financial relationships that could be construed as a potential conflict of interest.
All claims expressed in this article are solely those of the authors and do not necessarily represent those of their affiliated organizations, or those of the publisher, the editors and the reviewers. Any product that may be evaluated in this article, or claim that may be made by its manufacturer, is not guaranteed or endorsed by the publisher.
An, J., Lee, M., Yeom, S., and Hong, T. (2020). Determining the Peer-to-Peer electricity trading price and strategy for energy prosumers and consumers within a microgrid. Appl. Energ 261, 114335. doi:10.1016/j.apenergy.2019.114335
Ben-Haim, Y. (2004). Uncertainty, probability and information-gaps. Reliab Eng. Syst. Safe 85, 249–266. doi:10.1016/j.ress.2004.03.015
Di Silvestre, M. L., Gallo, P., Sanseverino, E. R., Sciume, G., and Zizzo, G. (2020). Aggregation and remuneration in demand response with a blockchain-based framework. Ieee T Ind. Appl. 56, 4248–4257.
Dong, J., Dou, X., Liu, D., Bao, A., Wang, D., and Zhang, Y. (2023). Energy trading strategy of distributed energy resources aggregator in day-ahead market considering risk preference behaviors. Energies 16, 1629. doi:10.3390/en16041629
Fan, R., Meng, D. Z., and Xu, D. S. (2014). Survey of research process on statistical correlation analysis. Math. Model. Its Appl. 3, 1–12.
Fang, X., Zhao, Q., Wang, J., Han, Y., and Li, Y. (2021). Multi-agent deep reinforcement learning for distributed energy management and strategy optimization of microgrid market. Sustain Cities Soc. 74, 103163. doi:10.1016/j.scs.2021.103163
Golla, N. K., Sudabattula, S. K., and Suresh, V. (2022). Optimal placement of charging station and distributed generator along with scheduling in distribution system using arithmetic optimization algorithm. Int. J. Renew. Energy Res. (IJRER) 12, 970–980.
Guerrero, J., Gebbran, D., Mhanna, S., Chapman, A. C., and Verbič, G. (2020). Towards a transactive energy system for integration of distributed energy resources: Home energy management, distributed optimal power flow, and peer-to-peer energy trading. Renew. Sustain. Energy Rev. 132, 110000. doi:10.1016/j.rser.2020.110000
Jin, Y., Choi, J., and Won, D. (2020). Pricing and operation strategy for peer-to-peer energy trading using distribution system usage charge and game theoretic model. Ieee Access 8, 137720–137730. doi:10.1109/access.2020.3011400
Kang, J., Yu, R., Huang, X., Maharjan, S., Zhang, Y., and Hossain, E. (2017). Enabling localized peer-to-peer electricity trading among plug-in hybrid electric vehicles using consortium blockchains. Ieee T Ind. Inf. 13, 3154–3164. doi:10.1109/tii.2017.2709784
Lei, Y., Wang, D., Jia, H., Li, J., Chen, J., Li, J., et al. (2021). Multi-stage stochastic planning of regional integrated energy system based on scenario tree path optimization under long-term multiple uncertainties. Appl. Energ 300, 117224. doi:10.1016/j.apenergy.2021.117224
Li, C., Xu, Y., Yu, X., Ryan, C., and Huang, T. (2017). Risk-averse energy trading in multienergy microgrids: A two-stage stochastic game approach. Ieee T Ind. Inf. 13, 2620–2630. doi:10.1109/tii.2017.2739339
Lu, T., Zhang, W., and Ding, X. (2021). Operation strategy of electricity retailers based on energy storage system to improve comprehensive profitability in China’s electricity spot market. Energies 14, 6424. doi:10.3390/en14196424
Mashhour, E., and Moghaddas-Tafreshi, S. M. (2010). Bidding strategy of virtual power plant for participating in energy and spinning reserve markets—Part I: Problem formulation. Ieee T Power Syst. 26, 949–956. doi:10.1109/tpwrs.2010.2070884
Mirzaei, M. A., Hemmati, M., Zare, K., Abapour, M., Mohammadi-Ivatloo, B., Marzband, M., et al. (2020). A novel hybrid two-stage framework for flexible bidding strategy of reconfigurable micro-grid in day-ahead and real-time markets. Int. J. Elec Power 123, 106293. doi:10.1016/j.ijepes.2020.106293
Monroe, J. G., Hansen, P., Sorell, M., and Berglund, E. Z. (2020). Agent-based model of a blockchain enabled peer-to-peer energy market: Application for a neighborhood trial in Perth, Australia. Smart Cities-Basel 3, 1072–1099. doi:10.3390/smartcities3030053
Nguyen, D. T., and Le, L. B. (2014). Optimal bidding strategy for microgrids considering renewable energy and building thermal dynamics. Ieee T Smart Grid 5, 1608–1620. doi:10.1109/tsg.2014.2313612
Rodrigues, D. L., Ye, X., Xia, X., and Zhu, B. (2020). Battery energy storage sizing optimisation for different ownership structures in a peer-to-peer energy sharing community. Appl. Energ 262, 114498. doi:10.1016/j.apenergy.2020.114498
Sadeghi, S., Jahangir, H., Vatandoust, B., Golkar, M. A., Ahmadian, A., and Elkamel, A. (2021). Optimal bidding strategy of a virtual power plant in day-ahead energy and frequency regulation markets: A deep learning-based approach. Int. J. Elec Power 127, 106646. doi:10.1016/j.ijepes.2020.106646
Shamsi, M., and Cuffe, P. (2021). A prediction market trading strategy to hedge financial risks of wind power producers in electricity markets. Ieee T Power Syst. 36, 4513–4523. doi:10.1109/tpwrs.2021.3064277
Shinde, P., Boukas, I., Radu, D., Manuel De Villena, M., and Amelin, M. (2021). Analyzing trade in continuous intra-day electricity market: An agent-based modeling approach. Energies 14, 3860. doi:10.3390/en14133860
Sun, Q., Wang, X., Liu, Z., Mirsaeidi, S., He, J., and Pei, W. (2022). Multi-agent energy management optimization for integrated energy systems under the energy and carbon co-trading market. Appl. Energ 324, 119646. doi:10.1016/j.apenergy.2022.119646
Ullah, Z., Mirjat, N. H., and Baseer, M. (2022). Optimisation and management of virtual power plants energy mix trading model. Int. J. Renew. Energy Dev. 11, 83–94. doi:10.14710/ijred.2022.39295
Wang, H-R., Feng, T-T., and Xiong, W. (2022a). How can the dynamic game be integratedinto blockchain-based distributed energy resources multi-agent transactions fordecision-making? Energy 254, 124318. doi:10.1016/j.energy.2022.124318
Wang, L., Zhang, Y., Song, W., and Li, Q. (2021). Stochastic cooperative bidding strategy for multiple microgrids with peer-to-peer energy trading. Ieee T Ind. Inf. 18, 1447–1457. doi:10.1109/tii.2021.3094274
Wang, R., Cheng., S., Wang., Y. Q., Dai, J., and Zuo, X. W. (2022b). Low-carbon and economic optimization of a regional integrated energy system based on a master-slave game with multiple stakeholders. Power Syst. Prot. Control 50, 12–21.
Wu, H., Liu, X., Ye, B., and Xu, B. (2020). Optimal dispatch and bidding strategy of a virtual power plant based on a Stackelberg game. IET Generation, Transm. Distribution 14, 552–563. doi:10.1049/iet-gtd.2019.0493
Xing-hui, Z., Xiu-mei, F., Axida, S., Shu-jia, F., and Wen-yu, W. (2021). Grey wolf algorithm optimization of reverse learning and its application in traffic flow prediction [ J ]. Electron. J. 49 (5), 879–886.
Yan, L., Chen, X., Chen, Y., and Wen, J. (2022). A hierarchical deep reinforcement learning-based community energy trading scheme for a neighborhood of smart households. Ieee T Smart Grid 13, 4747–4758. doi:10.1109/tsg.2022.3181329
Yang, P., Fang, D., and Wang, S. (2022). Optimal trading mechanism for prosumer-centric local energy markets considering deviation assessment. Appl. Energ 325, 119933. doi:10.1016/j.apenergy.2022.119933
Yang, X., Niu, D., Chen, M., Wang, K., Wang, Q., and Xu, X. (2020). An operation benefit analysis and decision model of thermal power enterprises in China against the background of large-scale new energy consumption. Sustainability-Basel 12, 4642. doi:10.3390/su12114642
Yu, Z., Lu, F., Zou, Y., and Yang, X. (2022). Quantifying energy flexibility of commuter plug-in electric vehicles within a residence–office coupling virtual microgrid. Part II: Case study setup for scenario and sensitivity analysis. Energ Build. 254, 111552. doi:10.1016/j.enbuild.2021.111552
Yu., J., Zhang, T. T., Ding, Q., Tu, M. F., and Cao, R. Z. (2021). Power retailersrolling correction trading strategy in monthly market considering clean energy accommodation. Electr. Power Autom. Equip. 41, 240–247.
Zhang, X. H., Fan, X. M., Fan, S. J., and Wu, W. Y. (2021). Grey Wolf Optimization Based on Opposition Learning and Its Application in Traffic Flow Forecasting[J]. Acta Electronica Sinica, 49(5): 879–886.
Zhao, Y. X. (2020). Diploma thesis. Hangzhou, China: Zhejiang University.The scheduling strategies of concentrating solar power plants considering multi-uncertainties and multi-resources coordination
Zheng, B., Wei, W., Chen, Y., Wu, Q., and Mei, S. (2022). A peer-to-peer energy trading market embedded with residential shared energy storage units. Appl. Energ 308, 118400. doi:10.1016/j.apenergy.2021.118400
Zhu, Z., Chan, K. W., Xia, S., and Bu, S. (2022). Optimal bi-level bidding and dispatching strategy between active distribution network and virtual alliances using distributed robust multi-agent deep reinforcement learning. Ieee T Smart Grid 13, 2833–2843. doi:10.1109/tsg.2022.3164080
Keywords: regional distributed energy system, multi-stakeholders, risk preference, decision support, information gap decision theory, opposition learning grey wolf optimizer
Citation: Dong J, Dou X, Liu D, Bao A, Wang D, Zhang Y and Jiang P (2023) Energy trading support decision model of distributed energy resources aggregator in day-ahead market considering multi-stakeholder risk preference behaviors. Front. Energy Res. 11:1173981. doi: 10.3389/fenrg.2023.1173981
Received: 25 February 2023; Accepted: 11 April 2023;
Published: 21 April 2023.
Edited by:
Zhien Zhang, The Ohio State University, United StatesReviewed by:
Rong Li, Global Energy Interconnection Development and Cooperation Organization, ChinaCopyright © 2023 Dong, Dou, Liu, Bao, Wang, Zhang and Jiang. This is an open-access article distributed under the terms of the Creative Commons Attribution License (CC BY). The use, distribution or reproduction in other forums is permitted, provided the original author(s) and the copyright owner(s) are credited and that the original publication in this journal is cited, in accordance with accepted academic practice. No use, distribution or reproduction is permitted which does not comply with these terms.
*Correspondence: Dongxue Wang, MjAyMTEwMTA1MDA3OUB3aHUuZWR1LmNu
Disclaimer: All claims expressed in this article are solely those of the authors and do not necessarily represent those of their affiliated organizations, or those of the publisher, the editors and the reviewers. Any product that may be evaluated in this article or claim that may be made by its manufacturer is not guaranteed or endorsed by the publisher.
Research integrity at Frontiers
Learn more about the work of our research integrity team to safeguard the quality of each article we publish.