 Xiu Zhou1
 Yan Luo
 Tian Tian
 Haonan Bai
95% of researchers rate our articles as excellent or good
Learn more about the work of our research integrity team to safeguard the quality of each article we publish.
Find out more
ORIGINAL RESEARCH article
Front. Energy Res. , 27 April 2023
Sec. Smart Grids
Volume 11 - 2023 | https://doi.org/10.3389/fenrg.2023.1169508
This article is part of the Research Topic High Quality and Reliability of Transformers View all 8 articles
When the transformer is running, the vibration which is generated in the core and winding will spread outward through the medium of metal, oil, and air. The magnetic field of the core changes with the variation of the transformer excitation source and the state of the core, so the corresponding vibration and noise change. Therefore, the vibration and noise of the transformer contain a lot of information. If the information can be associated with the fault characteristics of the transformer, it is significant to evaluate the running state of the transformer through the vibration and noise signal, which improve the intelligence, safety, and stability of the transformer operation. Based on this, modeling and simulation of transformer multi-point grounding, DC bias, and short-circuit between silicon steel sheets fault are first carried out in this paper, and vibration and noise distribution of transformer under different faults are given. Second, a fault diagnosis method based on transformer vibration and noise characteristics is proposed. In the process of implementation, vibration and noise signals under multi-point grounding, DC bias, and short-circuit between silicon steel sheets are taken as the sample data, and the probabilistic neural network algorithm is used to effectively predict the transformer fault. Finally, the effectiveness of the proposed scheme is verified by identifying the simulation faults-the proposed fault diagnosis method based on PNN can be effectively applied to transformer.
Once a power transformer is damaged, it may cause a large area of power outage, which will have a huge impact on the national economy. Improving the safety and reliability of power transformer operation is of great significance to the stable operation of the entire power grid and development of the national economy (Chen et al., 2017).
Studies have shown that transformer faults caused by DC bias, short-circuit between silicon steel sheets, and core multi-point grounding account for more than 70% of the total faults (Li, 2005; Xiong and Zhao, 2006; Dang et al., 2009; Li et al., 2009; Borucki, 2011; Mazurek et al., 2012; Hamzehbahmani et al., 2014; Asheraf and Fatih, 2016; Pan et al., 2020).
Due to the influence of geomagnetic storm, UHV DC transmission, and other factors, DC which passes through the neutral point of the power transformer will generate DC flux in the core, which will lead to the asymmetry of the core magnetization curve, namely, DC bias. DC bias will aggravate core saturation, excitation current increase, and waveform distortion and cause transformer vibration and noise to increase, or even cause transformer damage.
Based on this, many scholars have carried out systematic research on the DC bias of transformers. According to the spatial geometry structure of the core and windings of power transformers, Li et al. (2009) propose a magnetic circuit model of DC-biased magneto-electric circuit that can effectively reflect the coupling relationship of the flux chain inside power transformers. Dang et al. (2009) analyze the DC bias fault signal by combining empirical mode decomposition (EMD) and the Hilbert transform. The DC bias is measured accurately using this method. The distortion time of excitation current can also be obtained, and the frequency amplitude change of distorted signal can be directly reflected by graphs. Through the experimental study on DC bias of the converter transformer, Li (2005) concludes that the main influence of DC bias on transformer is the increase of winding heating due to overheating caused by the increase of winding resistance loss and core loss. Wang Zezhong et al. analyzed the variation of transformer vibration noise under several DC bias conditions through experiments. Figure 1 shows damage of cable insulation of the converter transformer.
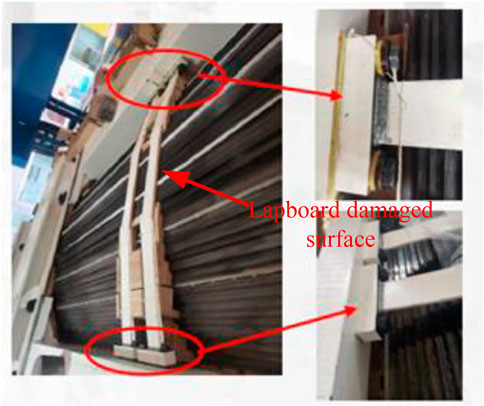
FIGURE 1. Damage of cable insulation of the converter transformer.
When short circuit between silicon steel sheets occurs in the transformer core, the short-circuit area will induce eddy current, leading to the increase of eddy current loss in the core. In severe cases, the heat generated will even melt the silicon steel sheets and burn the core (Hamzehbahmani et al., 2014), (Mazurek et al., 2012) (Asheraf and Fatih, 2016). If the abnormal state in the operation of the transformer cannot be found in time and eliminated, the transformer will be in an unsafe state for a long time and may develop into a serious fault. Therefore, the scientific and effective state detection and fault diagnosis of the power transformer is the key to ensure the stable operation of the power grid system.
Borucki (2011) measured vibration signals when the cores were clamped, loosened, or completely loosened by placing the accelerometer on the yoke above and below the cores of dry transformers. The differences of vibration signals in different parts and under different circumstances are compared and analyzed. Pan et al. (2020) studied the characteristics of transformer excitation current and core acceleration under different DC perturbations through simulation and experiment. In the literature (Xiong and Zhao, 2006), the energy spectrum and boundary spectrum were obtained after the Hilbert–Huang transform of the vibration signal of the core so as to distinguish the normal condition and the hidden fault condition of the transformer. Zhu et al. (2018) use multi-physical field coupling to simulate vibration signals under no-load and different harmonics, and analyze their differences through the transformer vibration signal spectrum diagram.
Under the combined action of electric and magnetic fields inside the transformer during operation, the core and other components have different potentials. Assuming that the core grounding is not reliable, due to the different potentials of various parts of the core, discharge will occur and the insulation will be destroyed. Figure 1 shows the damage of the tensile belt insulation of the converter transformer. At the same time, when the transformer core has multi-point grounding, the two ground points form a closed loop through the core and the grounding wire, in which a large grounding current will be generated and the converter transformer core grounding fault will occur (Wang, Li, Liu, Yang).
Geng (2013) estimated the working current of transformer core grounding at one point and established the model of the transformer core grounding current at one-point grounding. A transformer model with multi-point grounding connection was established, and the influence of the transformer core homogenization was considered by Zhou et al. (2018). Based on the online grounding system of converter transformer core grounding current, Zhang et al. (2019) conducted measurement research on converter transformer core grounding current and summarized the rules of ground current. Zhang et al. (2021) conducted an experimental study on the harmonic characteristics of converter transformer core ground current, obtained the data curve of converter transformer core ground current and its harmonic characteristics under different transmission power, and summarized the rules.
In transformer fault diagnosis, neural network, support vector machine, Bayesian classifier, and extreme learning machine are generally used in combination with DGA technology, and good results have been achieved (Seifeddine et al., 2012; Javed et al., 2015; Malik and Mishra, 2015; Li et al., 2018). Artificial neural network (ANN) mimics biological nerves to establish connections between the input and output. It has a good adaptive ability and self-learning ability and has good fault tolerance in the field of fault diagnosis (Seifeddine et al., 2012; Li et al., 2018). Malik and Mishra, (2015) combined IEC TC10 and related data sets and using RapidMiner software to analyze and identify the characteristic variables corresponding to faults and realized the fault classification of the transformer by ELM. After analysis, its performance was better than that of fuzzy logic and artificial neural network.Javed et al. (2015) used extreme learning machine and fuzzy clustering algorithm to establish a state prediction model for predicting possible faults of mechanical devices and used engines for verification, proving the outstanding performance of the algorithm based on the extreme learning machine in fault diagnosis and prediction direction. Lin Y. proposed a method based on the combination of the parameter optimization of variational mode decomposition (VMD) with cuckoo search (CS) and the probabilistic neural network (PNN) for intelligent identification of gearbox faults. The feasibility of using the neural network algorithm for fault diagnosis is proved by inputting experimental data into the neural network model and judging various fault modes (Javed et al., 2015). Oussama Laayati diagnosed power transformer faults using artificial neural networks for gas analysis of transformer oil (Lin et al., 2022).
Based on the aforementioned analysis, there is no comprehensive research work on DC bias of the transformer, short circuit between core pieces, and multi-point grounding fault of the core. Based on this, this paper carries out a systematic study on the phenomenon of DC bias, short circuit between core pieces, and multi-point grounding of the transformer; analyzes the vibration and noise of transformer when DC bias, short-circuit between core pieces, and multi-point grounding occur; and takes the vibration and noise of transformer core as the characteristic parameters. A fault prediction method of transformer DC bias, short circuit between core pieces, and multi-point grounding based on the probabilistic neural network algorithm is proposed. The vibration and noise distribution of the transformer under DC bias, short circuit between core pieces, and multi-point grounding conditions are given. Based on the vibration noise value, based on the probabilistic neural network algorithm, the fault modeling and prediction of the transformer DC bias, short circuit between core pieces, and multi-point grounding are carried out, which provides a new idea for transformer fault diagnosis.
In order to accurately describe the vibration and noise distribution of the converter transformer under DC bias, short circuit between core pieces, and multi-point grounding fault, a single-phase four-column transformer is used to form a converter transformer scaling model. Table 1 shows the basic parameters of single-phase four-column transformer. Figure 2 shows the basic structure of a single-phase four-column transformer.
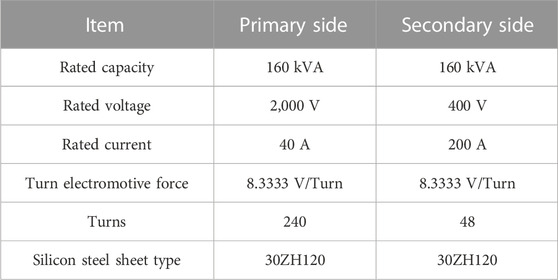
TABLE 1. One-phase four-leg power transformer basic parameters.
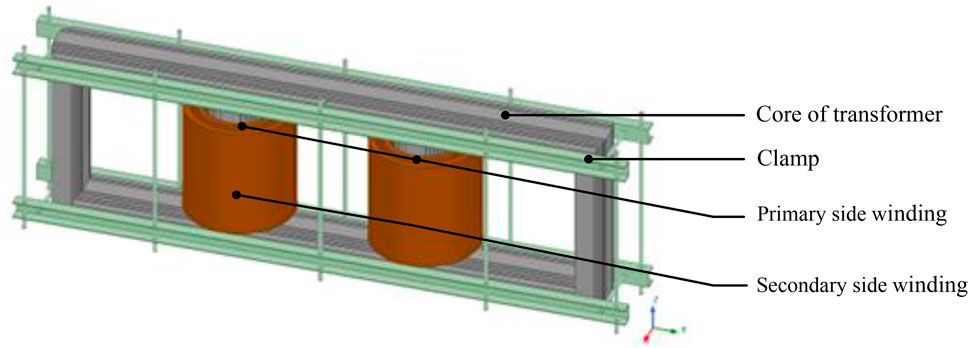
FIGURE 2. Basic structure of the single-phase four-column transformer.
As shown in Table 1, the rated capacity of the transformer is 160 kVA, the primary side voltage is 2,000 V, the secondary side voltage is 400 V, the primary side turns are 240, the secondary side turns are 48, and the turns ratio is 5.
As shown in Figure 2, the transformer adopts a single-phase four-column structure, which can effectively reduce the height of the transformer and facilitate transportation. At the same time, the high voltage winding and low voltage winding are wound by the left and right core column of the transformer, and the high voltage winding and low voltage winding on the left and right side are used in parallel.
The vibration and noise of the transformer core mainly come from the magnetostriction effect of the core silicon steel sheet, and no-load operation can effectively reflect the vibration and noise of the transformer core. Therefore, the simulation state of this paper is set so that the primary side applies the rated voltage, and the secondary side runs no-load.
In the aspect of core fault calculation and simulation, the homogenization modeling method is usually adopted, that is, the difference of equivalent conductivity is used to distinguish the fault area from the non-fault area.
The equivalent conductivity of the core failure area is set as:
The equivalent conductivity of the non-fault area of the core is set to:
where F is the core lamination coefficient; σ and σ’ are the electrical conductivity of silicon steel sheets.
In general, the elastic mechanics method is one of the efficient and convenient methods in the calculation of magnetostriction forces, as the excitation source of the structural force field. In the structure force field, the magnetostriction force of the core is calculated, and the acceleration distribution of each structural part is determined as the excitation source for the calculation of the sound field. To calculate the sound field, the acceleration of the structure is taken as initial load of the sound field calculation, and spatial distribution of the sound pressure is obtained. The calculation process is shown in Figure 3.
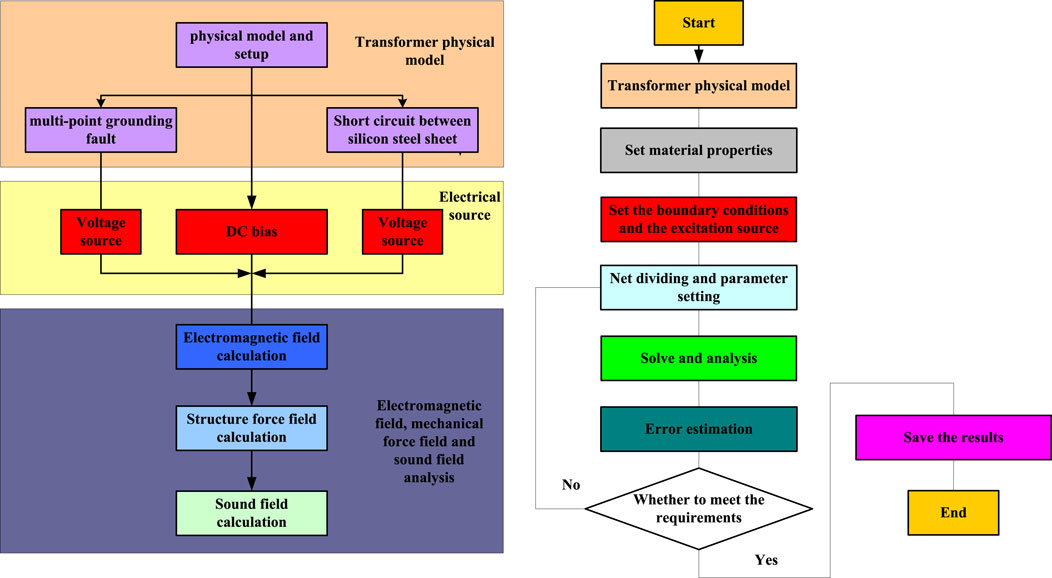
FIGURE 3. Calculation flow of transformer electromagnetic vibration and noise.
In the calculation of the transformer magnetic field, the unknown variable is the vector magnetic potential A. The outer layer of the air domain is set as the boundary condition of magnetic insulation; solving the following magnetic field governing equation:
where J is the external current density, μ is the permeability, and σ is the material conductivity. The vector magnetic potential A of each node is calculated according to the formula, and the magnetic field distribution of the core under no-load condition is obtained.
The Lorenz force due to eddy currents can be achieved by loading additional boundary conditions due to the addition of additional boundary conditions. The dependent variable of the transformer structure field calculation is the displacement u of the core and other components. The acceleration of each node in the transformer component in three directions can be obtained by differentiating u. According to the theory of solid mechanics, the differential equation of the structural force field is established.
Among them, ζ is the damping coefficient matrix, m is a mass matrix, the velocity of the particle vibration u, and the stiffness matrix is k.
As shown in Figure 3, a physical model of the transformer is first established. The influence of core homogenization is considered in the physical model, and the normal working mode of the core, the short-circuit mode between core pieces, and the multi-point grounding mode of the core are set, respectively. Second, the electromagnetic field is calculated by applying AC voltage source and the AC/DC hybrid power source, respectively. Finally, the structural force field and sound field are calculated, and the results are saved. At the same time, this paper mainly studies the vibration and noise change rule of the transformer core under the fault state, so the no-load simulation analysis method is adopted, that is, in the transformer DC bias fault simulation, the primary side of the AC/DC hybrid power supply, and the secondary side open circuit. In the simulation of transformer short-circuit between silicon steel sheets and core grounding fault, AC current is applied on the primary side and kept open on the secondary side.
In this paper, the vibration and noise of a 160-kVA/2,000-V/400-V single-phase four-column transformer under the condition of DC bias are calculated and analyzed. The single-phase four-column transformer shown in Figure 2 is subdivided, and the calculation is carried out according to the calculation flow shown in Figure 3.
Figure 4 shows the distribution of the transformer magnetic field when Idc = 0 A, 1.2 A, and 2.3 A. Figure 5 shows the transformer vibration distribution when Idc = 0 A, Idc = 1.2 A, and Idc = 2.3 A. Figure 6 shows the transformer noise distribution when Idc = 0 A, 1.2 A, and 2.3 A.
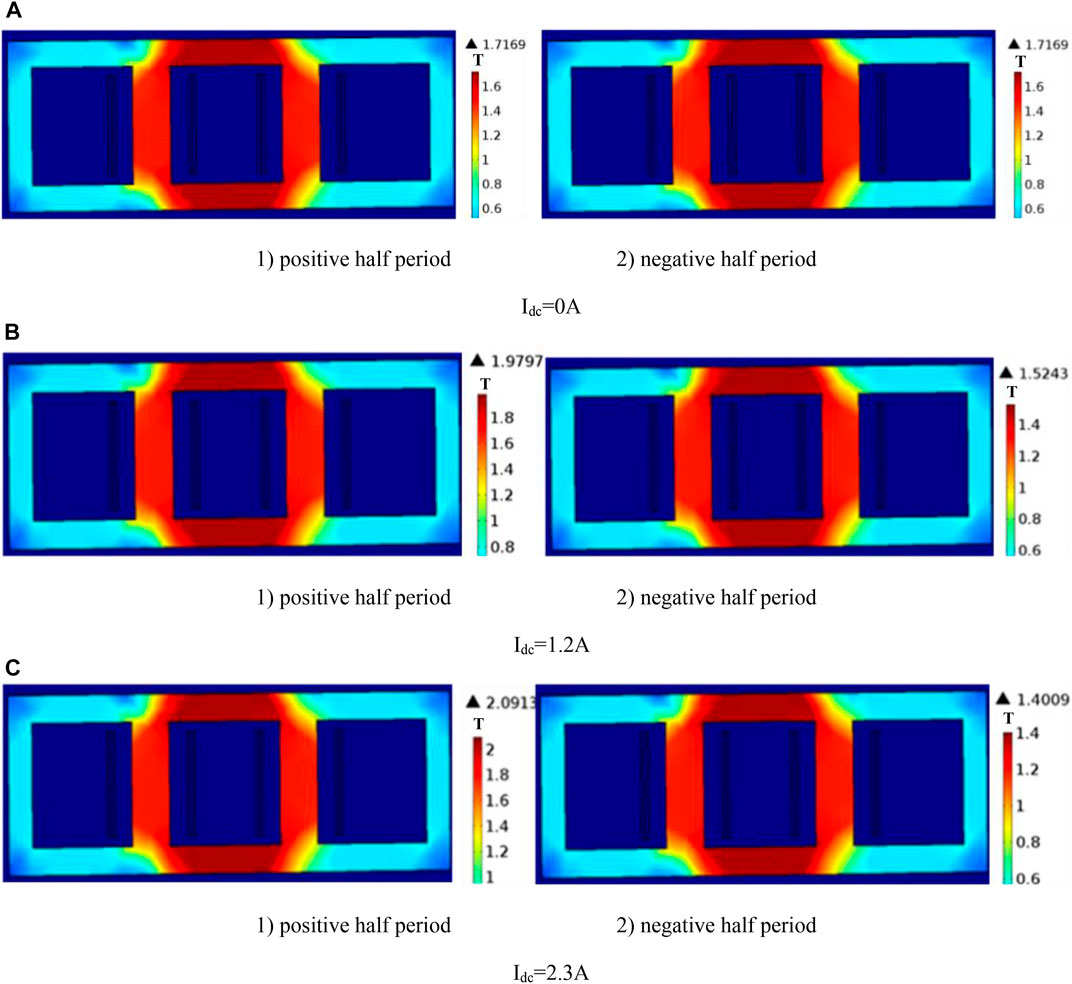
FIGURE 4. Transformer magnetic field distribution under different DC biases: (A) DC bias is 0 A; (B) DC bias is 1.2 A; (C) DC bias is 2.3 A.
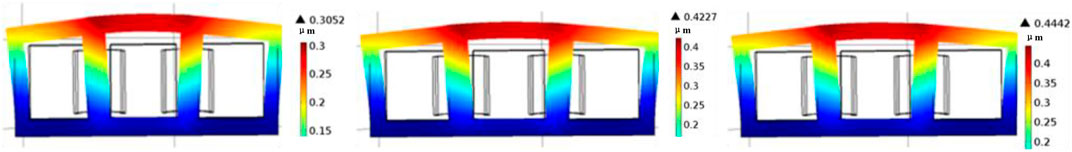
FIGURE 5. Transformer vibration distribution under different DC biases.

FIGURE 6. Transformer sound pressure distribution under different DC biases.
As can be seen from Figure 4, when Idc = 0 A, the maximum magnetic density of the positive half-cycle and negative half-cycle core of the transformer is 1.7169T, with positive and negative half-cycle symmetry. When Idc = 0 A, the maximum positive half-period magnetic density of the transformer is 1.9797T, the maximum negative half-period magnetic density is 1.5243T, and the difference between positive and negative half-period magnetic density is 0.4554T. When the DC bias further increases, the asymmetry between positive and negative half-period magnetic density of the transformer core is intensified, and the maximum deviation is 0.6904T.
As shown in Figure 5, vibration displacement of the core and noise increases with the increase of the DC bias. When the DC bias is 1.2 A, the maximum vibration displacement of the core is 0.4227 μm; when the DC bias is 2.3 A, the maximum vibration displacement of the core is 0.4442 μm.
According to IEC 6007610:2016, the relationship between the sound pressure level and sound pressure is as follows:
where Lp is the sound pressure level, dB. P is the sound pressure, Pa. P0 is the reference sound pressure, Pa, which is equal to 20 × 10−6 Pa.
As shown in Figure 6, the sound pressure under different DC magnetic biases is given, which can be converted into the noise value (dB) by Eq. 5. When DC bias is 1.2 A, the maximum noise value is 69.96 dB; when DC bias is 2.3 A, the maximum noise value is 72.96 dB.
Figure 7 shows the location of the transformer core multi-point grounding fault point.
FIGURE 7. Core multi-point grounding the fault-point setting.
For the core fault area, its conductivity is set as isotropic, and its conductivity is set as follows:
The finite element simulation program of transformer core multi-point grounding is established, and the simulation of electromagnetic vibration and noise of transformer core multi-point grounding is carried out. Figure 8 shows the simulation results of transformer core multi-point grounding.
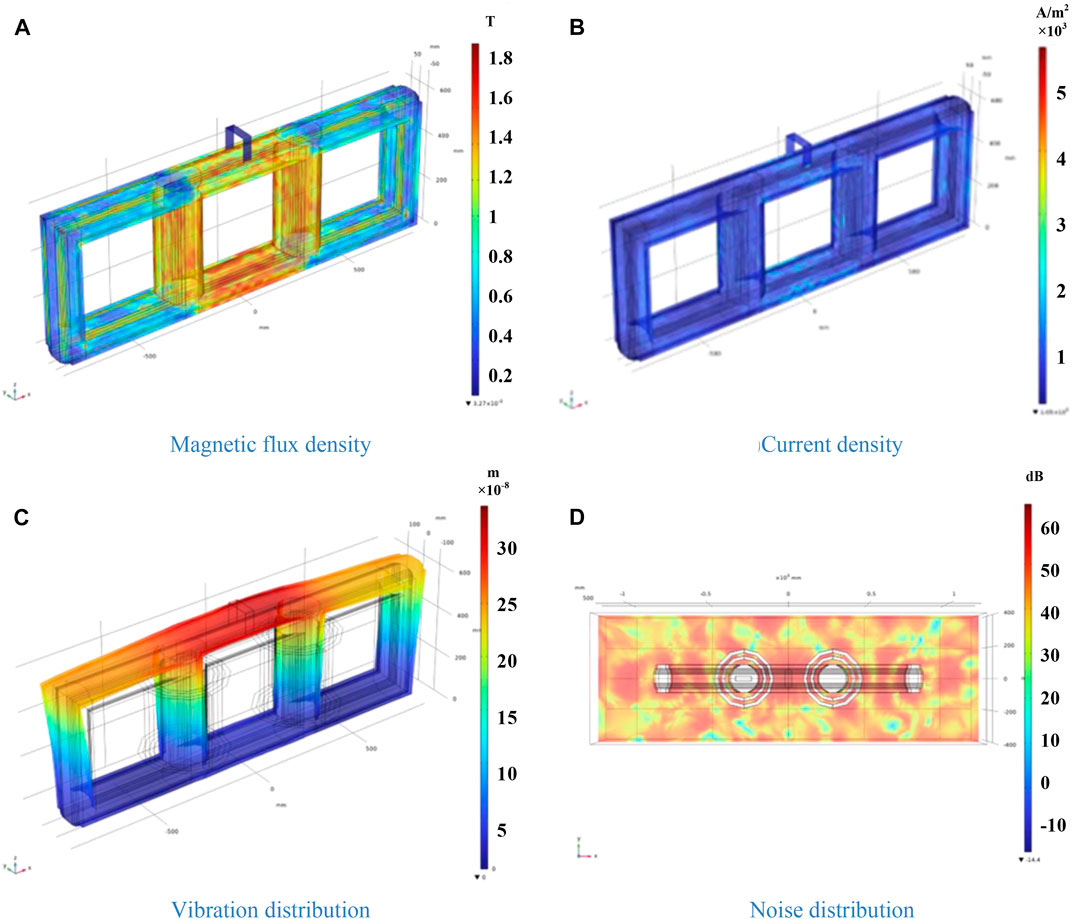
FIGURE 8. Simulation results of transformer core multi-point grounding: (A) Magnetic flux density; (B) Current density; (C) Vibration distribution; (D) Noise distribution.
As shown in Figure 8, when multi-point grounding occurs, the induced flux generated by eddy current cancels out the main flux in the core, resulting in a decrease in the flux density in the fault area, while the flux density in the non-fault area does not change much.
As shown in Figure 8, with the occurrence of multi-point grounding fault in the transformer core, the transformer vibration displacement and noise decrease.
Figure 9 shows the setting position of short-circuit fault between transformer pieces. For the fault position of short circuit between core pieces, the conductivity is set as isotropic, and the conductivity is set as shown in Eq. 7.
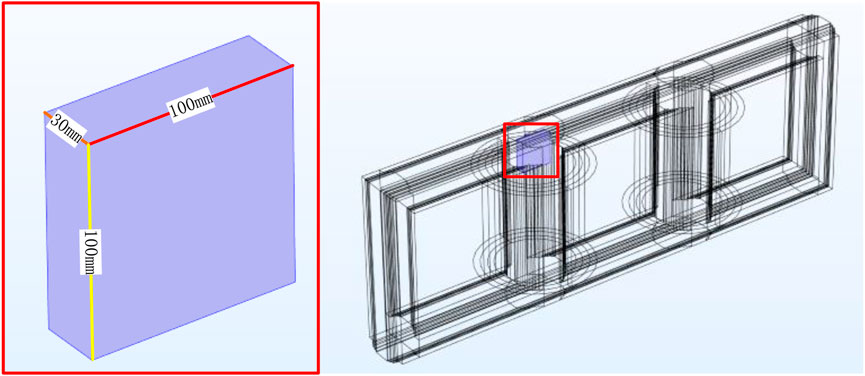
FIGURE 9. Setting of short-circuit fault point between core pieces.
According to Eq. 8, the short-circuit fault between core plates affects the vibration and noise of the transformer by changing the magnetic field distribution in the transformer core.
The finite element simulation program of short circuit between transformer core pieces is established to simulate the electromagnetic vibration and noise of short-circuit underground between transformer pieces. Figure 10 shows simulation results of internal short circuit of the transformer core.
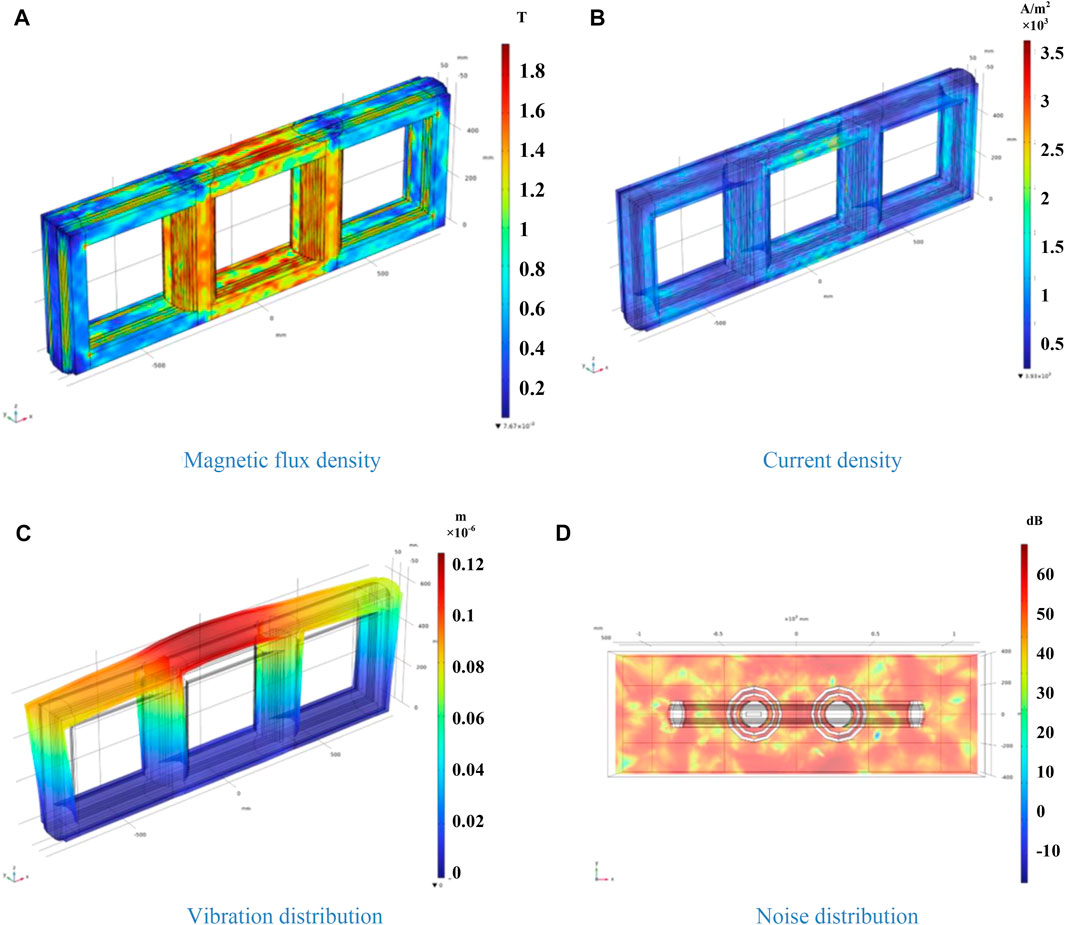
FIGURE 10. Simulation results of internal short circuit of transformer core: (A) Magnetic flux density; (B) Current density; (C) Vibration distribution; (D) Noise distribution.
As shown in Figure 10, when short circuit between core pieces occurs, the induced flux generated by eddy current cancels out the main flux in the core, resulting in a decrease in the flux density in the fault area, while the flux density in the non-fault area has little change, with the occurrence of inter-chip short-circuit fault in the transformer core, and the transformer vibration displacement and noise decrease.
Figure 11 shows a comparison of transformer vibration acceleration under fault conditions (normal status; short-circuit between silicon steel sheets; core multi-point grounding). Figure 12 draws transformer noise comparison under fault conditions.
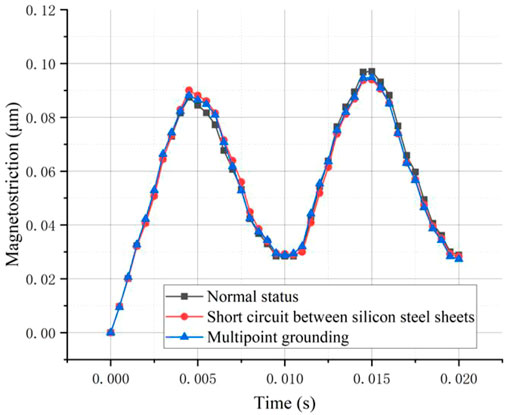
FIGURE 11. Comparison of transformer vibration acceleration under fault conditions (normal status; short circuit between silicon steel sheets; core multi-point grounding).
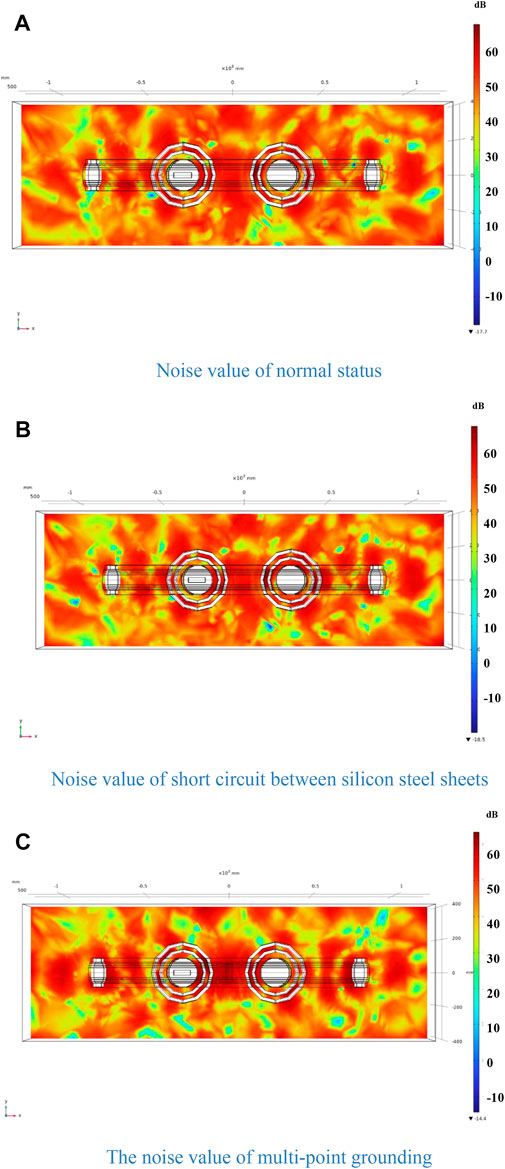
FIGURE 12. Transformer noise comparison under fault condition: (A) Noise value of normal status; (B) Noise value of short circuit between silicon steel sheets; (C) The noise value of multi-point grounding.
As shown in Figures 11 and 12, when the fault occurs, transformer vibration acceleration and amplitude decrease, resulting in the decrease of noise amplitude. This is caused by partial flux induced by the eddy current generated after the local failure of the core changing the distribution of the core’s main flux. The change of the core geometry affects the spectrum distribution.
Through the finite element simulation calculation of normal working conditions, short circuit between silicon steel sheets, multi-point grounding, and DC bias, it can be found that there are differences in vibration and noise values of measuring points. Based on this, this paper uses probabilistic neural networks to learn vibration and noise values under different working conditions and identify faults.
Based on the aforementioned simulation and experimental results, the vibration and over-hotspot database of the power transformer, such as three-phase unbalance, overload, DC bias, and core fault, is established. The genetic algorithm and the neural network algorithm were used to train with the expected output value of the fault type and the vibration and temperature values of the power transformer housing corresponding to each fault location as the input learning samples. Thus, the fault diagnosis of the power transformer is completed.
First, based on Bayesian decision theory:
where x is the fault mode of the DC bias fault, multi-point grounding fault, and short circuit between core pieces fault corresponding to the transformer, and
The probability density function
where
The structure of the typical transformer fault diagnosis program based on the PNN and input–output relationship of each layer is shown in Figure 13. It is composed of four layers, which can effectively calculate Eq. 10 when processed.
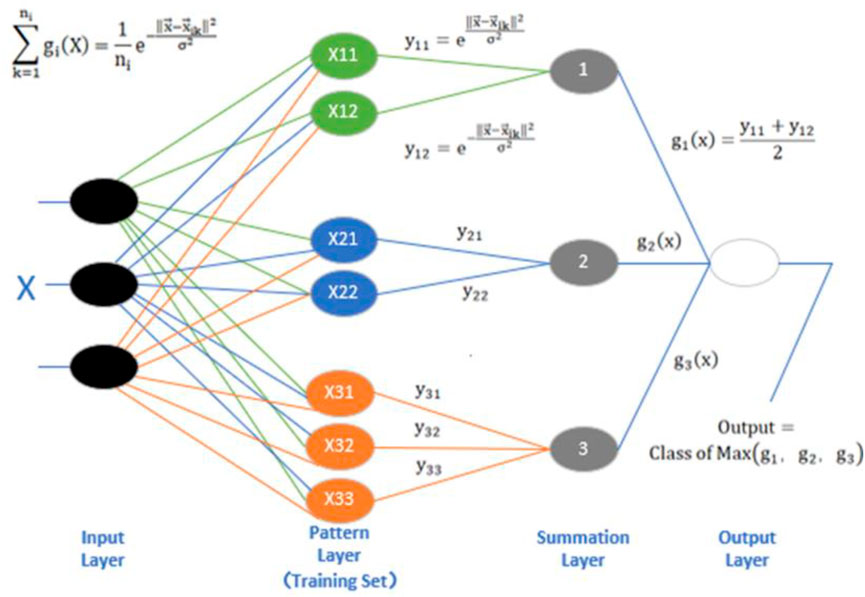
FIGURE 13. Probabilistic neural network structure.
As shown in Figure 13, the PNN network is composed of four parts: input layer, sample layer, summation layer, and competition layer. The working process of the PNN is as follows: first, input vector
In order to reduce the error, the input matrix is normalized, and the input matrix is set as:
As can be seen from Eq. 11, there are m learning samples of this matrix, and each sample has n characteristic attributes. Before normalizing the factors, the BT matrix must be computed:
Furthermore, calculation of Cm×n can be obtained:
where
The normalized m samples are sent into the network sample layer, where m = k*c.
The following is the calculation of the mode distance. The matrix composed of P n-dimensional vectors is called the sample matrix to be identified. After normalization, the input sample matrix to be identified is:
The center vector of each network node in the sample layer, and the distance between the corresponding quantities of these two vectors is:
After the learning sample and the sample to be recognized are normalized, the radial basis function neurons of the sample layer are activated. Usually, a Gaussian function with standard deviation σ = 0.1 is taken. After activation, the initial probability matrix is obtained:
Assuming that there are m samples, it can be divided into a total of c types, and the number of all types of samples is the same. The initial probability is set as k, and the sum of all types of samples can be obtained at the summation layer of the network:
where Sij represents, among the samples to be recognized, the ith sample belongs to the initial probability sum of the j-th class.
Finally, the probability probij is calculated, that is, the probability that the ith sample belongs to the j-th class.
Sixty sets of data were collected in this paper. Thirty sets of data were randomly selected from these sixty sets of data and used to train the neural network. The remaining data were analyzed by network simulation. In order to obtain accurate output information of the diagnostic network, the vibration and noise signal under DC bias, the vibration and noise value of multi-point underground connection, and the vibration and noise value of the inter-chip short circuit are selected as the basic input information of the probabilistic neural network.
A total of three types of faults were diagnosed as prototype faults. It mainly includes DC bias fault, multi-point grounding fault, and inter-chip short-circuit fault. If the normal state is considered as a type, there are four states, and the four fault states are described by binary coding, as shown in Table 2.
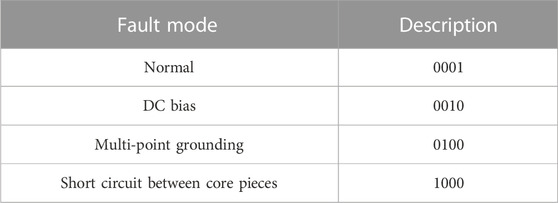
TABLE 2. Fault type and the corresponding code.
First, the modes to be classified are input into the network, and the corresponding judgment function values are obtained at each node of the mode layer. The winners are generated by the summation and layer. Finally, the categories of fault modes are judged by the winners obtained by the competition layer.
In this paper, measurement parameters corresponding to four transformer working states (normal working state, DC bias working state, short circuit between core pieces working state, and multi-point grounding working state) are used as a sample. All samples constitute the sample space, and the prior probability of each fault is assumed to be the same. The simulation results (vibration of different point and sound) are shown in Tables 3, 4.
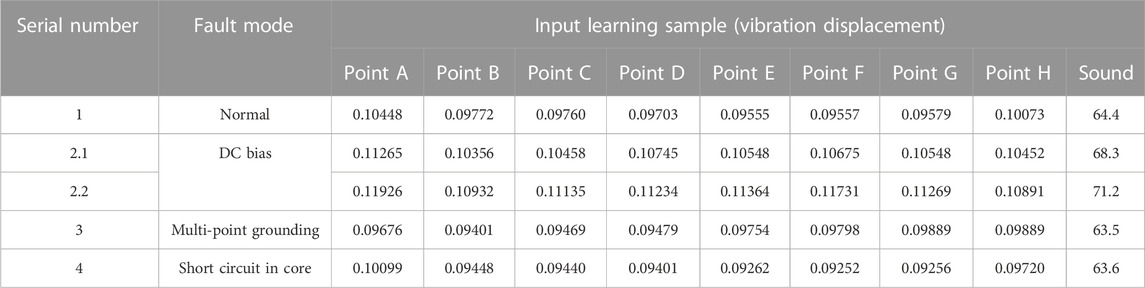
TABLE 3. Test sample data set.
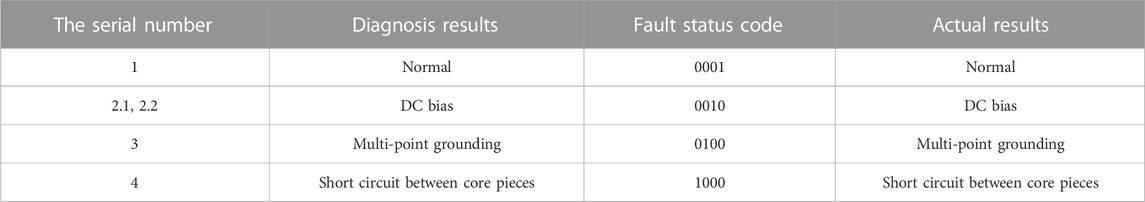
TABLE 4. Output test results.
As shown in Table 4, the probabilistic neural network has good classification ability for the learned samples after learning. It has a simple learning process, overcomes the disadvantages of local minimization and long time, and has very good classification ability for signals with interference and noise.
At present, transformer fault diagnosis based on PNN is rare. The scheme proposed in this paper can be widely used in various transformer types.
(a) The homogenization modeling method is proposed, and the multi-physical field coupling simulation method of electromagnetic, force–sound field is used to establish the fault simulation method of DC bias fault of transformer, short circuit between core pieces, and multi-point grounding of core. The electromagnetic vibration and noise finite element simulation of a 160-kVA transformer under fault conditions is carried out. The results show that the transformer fault simulation method based on multi-physical field coupling can well reflect the changes of transformer acoustic and vibration characteristics caused by the fault.
(b) Through the analysis of the electromagnetic vibration and noise calculation results of the multi-physical field-coupled short circuit between the core and the core multi-point grounding of the transformer, it can be seen that when the core multi-point grounding and the short-circuit between the core and the chip occur in different places, the changes will be different, and the influence on the final vibration and noise of the transformer will be different, but the vibration and noise will decrease overall.
(c) The analysis of the calculation results of the electromagnetic vibration and noise of the transformer under the DC bias shows that the vibration and noise of the transformer increase with the increase of the DC bias. When the DC bias increases to a certain extent (transformer oversaturation), the vibration and noise no longer increase and tend to be stable.
(d) Based on the vibration and noise signals of the transformer under the fault state, the characteristic fault diagnosis of the transformer based on the probabilistic neural network is realized, which can effectively predict the DC bias, the short circuit between the core pieces and the multi-point ground fault of the core, providing an effective means of analysis and method for the comprehensive fault analysis of large power transformers
The original contributions presented in the study are included in the article/Supplementary Material; further inquiries can be directed to the corresponding author.
Conceptualization, XZ; methodology, YL; software, TT; writing—original draft preparation, HB; writing—review and editing, PW and WL.
This research was funded by The Key Research and Development Program of Ningxia Hui Autonomous Region (2021BDE931018); Science and Technology Project of State Grid Ningxia Electric Power Co., Ltd. (5229DK20004N).
Authors XZ, YL, TT, PW, and WL were employed by State Grid Ningxia Electric Power Co., Ltd., and Maintenance Company of State Grid Ningxia Electric Power Co., Ltd.
The remaining authors declare that the research was conducted in the absence of any commercial or financial relationships that could be construed as a potential conflict of interest.
The authors declare that this study received funding from Science and Technology Project of State Grid Ningxia Electric Power Co., LTD. The funder had the following involvement in the study: Transformer Fault Diagnosis Based on Probabilistic Neural Networks Combined with Vibration and Noise Characteristics.
All claims expressed in this article are solely those of the authors and do not necessarily represent those of their affiliated organizations, or those of the publisher, the editors, and the reviewers. Any product that may be evaluated in this article, or claim that may be made by its manufacturer, is not guaranteed or endorsed by the publisher.
Asheraf, E., and Fatih, A. (2016). Evaluation of loss generated by edge burrs in electrical steels. IEEE Trans. Magnetics 52 (5), 1–4. doi:10.1109/tmag.2016.2527361
Borucki, S. (2011). Time-frequency Analysis of mechanical vibrations of the dry type power transformer core. Acta Phys. Pol. A 120 (4), 571–574. doi:10.12693/aphyspola.120.571
Chen, D., Fang, S., Kwon, B. I., and Bai, B. (2017). Measurement research on magnetic properties of electrical sheet steel under different temperature, harmonic and dc bias. AIP Adv. 7 (5), 056682. doi:10.1063/1.4979490
Dang, K., Zhang, X., and Zhang, F. (2009). Simulative study on power transformer with DC magnetic biasing. Power Syst. Technol. 33 (20), 189–192. doi:10.1016/j.proeng.2011.12.740
Geng, J., and Wang, P. (2013). Current calculation duing one point earthing of transformer core. TRANSFORMER 50 (04), 33–35.
Hamzehbahmani, H., Anderson, P., Hall, J., and Fox, D. (2014). Eddy current loss estimation of edge burr-affected magnetic laminations based on equivalent electrical network-Part II: Analytical modeling and experimental results. IEEE Trans. Power Deliv. 29 (2), 651–659. doi:10.1109/tpwrd.2013.2279634
Javed, K., Gouriveau, R., and Zerhouni, N. (2015). A new multivariate approach for prognostics based on extreme learning machine and fuzzy clustering. IEEE Trans. Cybern. 45 (12), 2626–2639. doi:10.1109/tcyb.2014.2378056
Li, H., Cui, X., Lu, T., and Cheng, Z. (2009). “Electric circuit and magnetic circuit combined model of DC biased power transformer,” in Proceedings of the CSEE, Berlin, Heidelberg, March 2009.
Li, X., Chen, Z., Fan, X., and Xu, Q. (2018). Fault diagnosis of transformer based on BP neural network and ACS-SA. High. Volt. Appar. 54, 134–139. doi:10.13296/j.1001-1609.hva.2018.02.022
Lin, Y., Xiao, M., Liu, H., Li, Z., Zhou, S., Xu, X., et al. (2022). Gear fault diagnosis based on CS-improved variational mode decomposition and probabilistic neural network. Measurement 192, 110913. doi:10.1016/j.measurement.2022.110913
Malik, H., and Mishra, S. (2015). Extreme learning machine based fault diagnosis of power transformer using IEC TC10 and its related data, 1–5.Proceedings of the Annual IEEE India Conference (INDICON). IEEEDecember 2015New Delhi, India
Mazurek, R., Hamzehbahmani, H., Moses, A. J., Anderson, P. I., Anayi, F. J., and Belgrand, T. (2012). Effect of artificial burrs on local power loss in a Three-phase transformer core. IEEE Trans. Magnetics 48 (4), 1653–1656. doi:10.1109/tmag.2011.2173668
Pan, C., Su, H., Cai, G., and Fan, J. (2020). Study on vibration characteristics of abnormal current representation under DC bias of transformer. Trans. China Electrotech. Soc. 35 (09), 1868–1879. doi:10.1016/j.ijepes.2020.106725
Seifeddine, S., Khmais, B., and Abdelkader, C. (2012). “Power transformer fault diagnosis based on dissolved gas analysis by artificial neural network,” in Proceedings of the First International Conference on Renewable Energies and Vehicular Technology. IEEE, Nabeul, Tunisia, March 2012, 230–236.
Wang, Z., Li, B., Liu, H., and Yang, Y. Experimental study on vibration and noise of 500kV single-phase transformer under DC bias. Beijing China: Transactions of China Electrotechnical Society.
Xiong, W., and Zhao, G. (2006). Analysis of vibration characteristics of transformer core based on Hilbert Huang. Trans. China Electrotech. Soc. 21 (8), 9–13.
Zhang, J., Su, M., Zhou, D., He, Y., and Xiao, Y. (2019). Grounding current of converter transformer core and its harmonic characteristics. TRANSFORMER 56 (09), 31–35. doi:10.1109/ISGT-Asia.2019.8881546
Zhang, X., Wang, M., and Gao, Q. (2021). Reason analysis and countermeasures on monitoring abnormal date of converter transformer core grounding current. Northeast Electr. Power Technol. 38 (03), 59–62. doi:10.1016/j.ijepes.2014.07.048
Zhou, L., Liu, H., Gao, S., and Jiang, J. (2018). A homogenization modeling method of transformer cores considering multi-point grounding faults. Proc. CSEE 38 (12), 3709–3716. doi:10.13334/j.0258-8013.pcsee.170449
Keywords: Transformer, vibration and noise, probabilistic neural networks, DC bias, multi-point grounding, short-circuit between silicon steel sheets, fault diagnosis
Citation: Zhou X, Luo Y, Tian T, Bai H, Wu P and Liu W (2023) Transformer fault diagnosis based on probabilistic neural networks combined with vibration and noise characteristics. Front. Energy Res. 11:1169508. doi: 10.3389/fenrg.2023.1169508
Received: 19 February 2023; Accepted: 31 March 2023;
Published: 27 April 2023.
Edited by:
Wenliang Zhao, Shandong University, ChinaReviewed by:
Weimin Guan, Wuhan University, ChinaCopyright © 2023 Zhou, Luo, Tian, Bai, Wu and Liu. This is an open-access article distributed under the terms of the Creative Commons Attribution License (CC BY). The use, distribution or reproduction in other forums is permitted, provided the original author(s) and the copyright owner(s) are credited and that the original publication in this journal is cited, in accordance with accepted academic practice. No use, distribution or reproduction is permitted which does not comply with these terms.
*Correspondence: Tian Tian, dGlhbnQwNTMxQDE2My5jb20=
Disclaimer: All claims expressed in this article are solely those of the authors and do not necessarily represent those of their affiliated organizations, or those of the publisher, the editors and the reviewers. Any product that may be evaluated in this article or claim that may be made by its manufacturer is not guaranteed or endorsed by the publisher.
Research integrity at Frontiers
Learn more about the work of our research integrity team to safeguard the quality of each article we publish.