 Kezheng Jiang
 Dan Liu
 Kan Cao1
 Pan Hu
95% of researchers rate our articles as excellent or good
Learn more about the work of our research integrity team to safeguard the quality of each article we publish.
Find out more
ORIGINAL RESEARCH article
Front. Energy Res. , 15 May 2023
Sec. Smart Grids
Volume 11 - 2023 | https://doi.org/10.3389/fenrg.2023.1168274
With the high proportion of renewable energy through high-voltage direct current (HVDC) transmission into the grid and the application of high proportion of power electronic equipment, in the modern power system, the traditional electromagnetic conversion equipment represented by synchronous generators is gradually replaced by power electronic equipment, which in a high level has been affecting the dynamic behavior of the power system. In recent years, the wide-band oscillation problem of unknown mechanism continues to appear in power systems, which poses a major threat to the security, stability, and operation of power systems. Therefore, based on the typical oscillation event, this paper constructs a typical small-signal model of the new power system which is composed of synchronous generator, HVDC transmission equipment, and renewable energy generation equipment. The model is suitable for the analysis of wide-band oscillation problem of the new power system with renewable energy as the main body. The comparison of time-domain response with the detailed time-domain model shows that the proposed small-signal model can well reflect the dynamic behavior of the detailed time-domain model. Based on the model, the influence of access distance, access proportion, and operation and control modes of renewable energy integrated through LCC-HVDC on the wide-band oscillation characteristics of the system is analyzed, and the correctness of the analysis is verified by the detailed time-domain model.
With the transformation of energy consumption, more and more renewable energy is connected to the power system. The renewable energy generation equipment based on power electronic technology is gradually replacing the traditional synchronous generator and becoming the main power source of the power system (Zhuo et al., 2021; Xie et al., 2021). With the large-scale renewable energy through high-voltage direct current transmission into the grid and the application of high proportion of power electronic equipment, the structure and running state of power systems have changed dramatically (Yuan et al., 2022; Hu et al., 2019; Chen et al., 2019). The intermittency and volatility of renewable energy also increase the uncertainty of the operation mode of the power grid, leading to new stability problems; the oscillation instability phenomenon has appeared successively in the world (Guo et al., 2022). The oscillation frequency range of the new power system is wider than that of the conventional power system, which ranges from a few Hz to a thousand Hz; it has aroused the attention of the industry to the security and stability of the new power system with renewable energy as the main body (Cheng et al., 2022).
In recent years, the oscillation instability events of power systems related to renewable energy and high-voltage direct current transmission have continued to occur in practical engineering, which seriously threatens the safe and stable operation of power systems. Some oscillation instability phenomena caused by renewable energy generation equipment were reported; in October 2009, the sub-synchronous oscillation problem of the wind farm delivery system was first reported in Texas, United States, causing a large number of doubly fed induction generators to fail (Adams et al., 2012; Irwin et al., 2011; Larsen, 2012). Since 2010, hundreds of sub-synchronous oscillations occurred in the doubly fed wind farm in Guyuan, Hebei, China, with oscillation frequencies varying from 3 to 10 Hz, and it led to the centralized off-grid of thousands of wind turbines (Dong et al., 2017; Xie et al., 2017). In March 2014, oscillations of about 260 Hz occurred in the offshore wind farm in northern Germany via the flexible HVDC system, which led to the damage of the filter capacitor of the rectifier station and the system shutdown (Sun and Liu, 2017). In 2015, the 19.4–90.8 Hz oscillation component excited by the disturbance of the wind farm in Hami, Xinjiang, China, was transmitted to the thermal power units 300 km away, and it caused three 660 MW thermal units to jump due to torsional vibration protection, with a total power loss of 1.28 million kW; during this period, the oscillation frequency showed a dynamic change process, with the sub-synchronous frequency fluctuating from 16 to 24 Hz (Liu et al., 2017). In December 2018, a 1,810 Hz resonance of AC voltage of the Hubei-side AC system occurred in Chongqing–Hubei back-to-back HVDC project of China, resulting in damage to the station’s oscillator (Guo et al., 2020a). The “8.9” power outage in the UK in 2019 was a wide-band oscillation event caused by fault, after the single-phase ground fault was caused by lightning strike; the SVC of the station showed two periods of synchronous oscillation, which lasted for two periods before the overcurrent protection of the wind turbine that led to a large-scale off-grid (Fan et al., 2020). Several studies reported that the sub-synchronous oscillation of 58.5 Hz occurred in the Zhangbei project of China in 2020 and 2021, which led to oscillation off-grid between the HVDC transmission and renewable energy stations (Shao et al., 2021) (Wang et al., 2022a). It can be seen that with the application of renewable energy generation, DC transmission, and other power electronic devices, the dynamic behavior of the power system has been profoundly changed, which brings great challenges to the safe and stable operation of the grid.
The oscillation problem of grid-connected power electronic devices such as renewable energy generation and DC transmission has become a hot topic of current research, and scholars at home and abroad have carried out relevant studies for the power system oscillation problem. The problem of sub-synchronous oscillations caused by the interaction between the rotor-side converter of a doubly fed wind turbine and the series compensation is studied in Fateh et al. (2020). Du et al. (2020) analytically examine how the condition of weak grid connection affects the torsional sub-synchronous oscillations (SSOs) induced by a grid-connected DFIG in a power system; the oscillation mechanism is explored based on the intuitive analysis of the system impedance frequency characteristics in Sun et al. (2021). The influence of short-circuit ratio and phase-locked loop parameters and current control parameters on the stability of LCC-HVDC systems under weak grid is analyzed in Jiang et al. (2022), and in some studies the modal analysis method is used to analyze the oscillation modes of large-scale PV plants (You et al., 2017; Silva-Saravia et al., 2021). In addition, the impedance analysis method is applied to analyze the problem of the long-link delay parameters, phase-locked loop parameters, and operating power and voltage feed-forward links on high-frequency resonance (Guo et al., 2020b). However, the aforementioned analysis mainly focuses on the system stability analysis of single equipment access to weak power grid, and the research on the analysis of wide-band oscillation of multiple equipment access to weak power grid is still in the initial stage. The impedance analysis method is used to analyze the oscillation problem caused by the interactions of multiple grid-connected converters in Fu et al. (2021), and an impedance analysis model is established for the offshore wind turbines which transmit power outward through VSC-HVDC and LCC-HVDC systems (Wang et al., 2022b; Gontijo et al., 2022), but the DC control strategy of offshore wind turbines is very different from the land-based HVDC system in the weak grid, and its conclusions are not applicable to the weak grid scenario. It can be seen that the oscillation problem of grid-connected power electronic devices such as renewable energy generation and DC power transmission is still in the exploration stage. In this paper, a typical small-signal model of the new power system, which is composed of synchronous generator, HVDC transmission equipment, and renewable energy generation equipment, is constructed, the influence of access distance, access proportion, and operation and control modes of new energy on the wide-band oscillation characteristics of the system is explored, and the correctness of the analysis is verified by the detailed time-domain model.
The remainder of the article is organized as follows: Section 2 presents the configuration of the system. Subsequently, a small-signal model of the system is put forward in Section 3. Section 4 is devoted to the risk analysis of wide-band oscillation. Conclusions are summarized in Section 5.
This section mainly introduces the basic configuration of the system including physical topology and control scheme.
To gain a better understanding, Figure 1 gives a typical new power system composed of synchronous generator, HVDC transmission equipment, renewable energy generation equipment, and external equivalent circuit. The synchronous machine includes a generator (GEN), exciter (EX), and turbine with the multi-mass block, where the turbine contains a high-pressure cylinder (HP), a medium-pressure cylinder (IP), and two low-pressure cylinders (LPA and LPB). The basic unit of the converter for LCC-HVDC is a 6-pulse rectifier bridge. The typical structure of LCC-HVDC in actual engineering is a 12-pulse converter, which is composed of two 6-pulse rectifier bridges in series. The detailed topology and parameters of each part refer to CIGRE HVDC Benchmark (Szechtman et al., 1991). The PV station is connected to the grid through the inverter, where Xf is the filter reactance, Cf is the filter capacitor, and Cvdc is the DC bus capacitor, and it is connected to the AC network through the transformer.
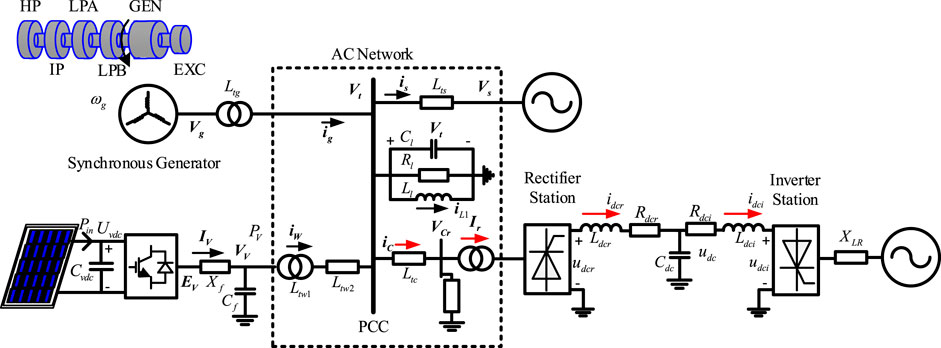
FIGURE 1. Typical physical topology of the new power system.
Figure 2 gives the typical control mode of the PV inverter and LCC-HVDC system. The double closed-loop control strategy is applied to the inverter of the PV station, the inner loop adopts dq current vector control mode, when the voltage vector control mode is adopted, the dq current indicates the active and reactive current components, the outer-loop control forms a current command value, the current command value of the d-axis is formed by active power control, and the current command of the q-axis value is formed by reactive power control. The rectifier station of the LCC-HVDC system adopts DC current control and phase-locked loop (PLL) control, and the PLL control provides the reference phase for the pulse generator, which produces the pulse sequence together with the output of the DC current control. The inverter station operates in DC voltage control whose output is the reference value of the firing angle, and the PLL control provides the reference phase for the pulse generator, which produces the pulse sequence together with the firing angle order.
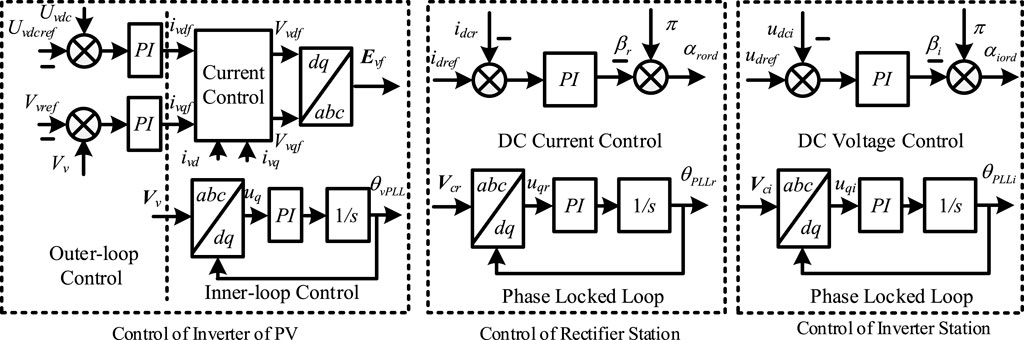
FIGURE 2. Control structure of the system.
Since a lot of work has been carried out on the synchronous generator modeling, this section simplifies the modeling process and gives only the modeling of the AC electrical part of the synchronous machine. The voltage and chain equations for the stator and rotor windings of the synchronous machine are given as follows:
Combining the rotor winding magnetic chain equation and the rotor winding voltage equation of the d-axis and substituting into the stator magnetic chain equation, the stator magnetic chain equation of the d-axis can be obtained as
Define
Therefore, Formula (3) can be written as
Since the effect of excitation control is not considered, the variation in excitation voltage is ignored, i.e.,
Similarly, the rotor winding magnetic chain equation and the rotor winding voltage equation for the q-axis are combined and substituted into the stator magnetic chain equation to obtain the stator magnetic chain equation of the q-axis:
Define
Therefore, Formula (6) can be written as
Formulas (5) and (8) contain the dynamic characteristics of the rotor winding, and substituting them into the voltage equation of the stator winding and linearizing the voltage equation while making
where
Figure 1 and Figure 2 give the typical topology of LCC-HVDC and the control structure of the sending/receiving-terminal system, respectively. This section takes the small-signal modeling of the sending-terminal system as an example as the receiving-terminal system modeling is similar and will not be explained in detail.
First, the assumptions of the small-signal model of LCC-HVDC are given.
1) The three phases of an AC system are considered under the symmetric voltage and current without harmonics.
2) The three-phase AC current of the converter considers only the fundamental component, and the DC current and DC voltage on the DC side remain constant in the steady state.
3) The direction of the three-phase AC current of the converter is the same as the active power; that is, the three-phase AC current of the rectifier side lags behind the voltage of the PCC point, and the three-phase current of the inverter exceeds the voltage of the PCC point; the power factor angle at the converter port is equal to the phase difference between the fundamental component of the output three-phase AC current and the voltage of the PCC point.
For example, the quasi-steady-state equation of the 12-pulse converter of the sending-terminal system is
Linearization of the aforementioned equation at the stable operating point yields
The aforementioned equation shows that the small-signal model of the converter takes network side AC voltage amplitude and phase of the grid side of the transformer, with DC current and fire angle as the input, and the DC voltage, AC amplitude, and phase of the converter as the output.
The sending-terminal system control includes constant DC current control and phase-locked loop (PLL) control, and the original relationship of current controller can be expressed as
The original relationship of PLL controller can be expressed as
Linearization of Formula (12) and Formula (13) at the stable operating point yields
Since the pulse control of the LCC-HVDC system is based on the output of PLL to generate the firing angle, the dynamic behavior of the PLL affects the actual firing angle, and the schematic is given in Figure 3. The relationship between the actual firing angle of the sending-terminal system and the dynamics of PLL and the dynamics of constant DC current control can be obtained as
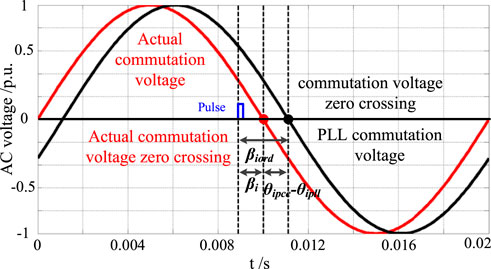
FIGURE 3. Influence of PLL on the actual firing angle of the inverter station.
This section of the PV inverter controller takes the example of using constant DC voltage control in the d-axis and constant AC voltage control in the q-axis and considers in detail the internal coupling of the PV inverter.
Ignoring the losses of PV inverter switching and conduction, the mathematical equation of DC voltage and DC voltage controller can be obtained according to the relationship between the input and output power of the DC capacitor and its energy variation:
Linearization of the aforementioned equation at the stable operating point yields
The constant AC voltage control is applied to the q-axis, and the original relationship can be expressed as
Linearization of the aforementioned equation at the stable operating point yields
The PV inverter uses double closed-loop control, where the original relationship of the inner-loop current control is
Linearization of the aforementioned equation at the stable operating point yields
The phase-locked loop structure of the PV inverter is shown in Figure 2, and its original relationship can be expressed as
Linearization of the aforementioned equation at the stable operating point yields
Multiple systems are specifically modeled in the paper, and the control strategies of the devices are modeled based on the PLL-dq reference frame, while the AC network is modeled based on the synchronous dq reference frame. Therefore, it is very necessary to establish the conversion relationship at the interfaces between the PLL-DQ reference frame and the synchronous DQ reference frame, and there exists the conversion relationship between the two coordinate systems as follows:
where the δ is the angle between the two coordinate systems.
This section verifies the accuracy of the proposed model. The detailed time-domain model is composed of synchronous generator, HVDC transmission equipment, and renewable energy generation equipment, and the PV station is built in PSCAD, and its structure is shown in Figure 1. The short-circuit ratio of the grid is set to 2.5. In MATLAB/Simulink, the proposed model is built, with the same parameter settings for the detailed time-domain model, and the parameters of the system are listed in the Supplementary Material. The simulation results of the proposed model are compared with the time-domain results of the detailed time-domain model to verify the accuracy.
Initially, the PV inverter operates at Uvdcref = 1 (pu). A minor disturbance of 0.01 pu is added to the DC voltage reference value of the PV station at 3 s, and the comparison of dynamic responses between the detailed time-domain model and proposed model is displayed in Figure 4, Figure 5, and Figure 6. Figure 4 gives the time-domain response waveforms of the electrical torque and speed of the synchronous generator, respectively; Figure 5 gives the time-domain response waveforms of the DC voltage and DC current of the PV inverter, respectively; and Figure 6 gives the time-domain response waveforms of the firing angle and DC voltage of the sending-terminal system of LCC-HVDC, respectively. From the comparison results of the time-domain response of the equipment, it can be seen that the proposed model well reflects the dynamic behavior of the detailed time-domain model, which verifies the correctness of the proposed model.
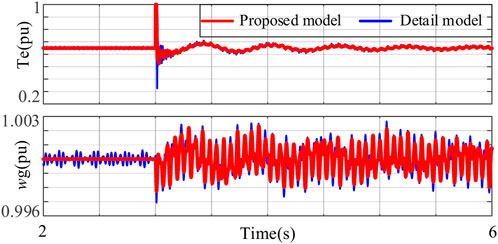
FIGURE 4. Time-domain response waveforms of the electrical torque and speed of the synchronous generator.
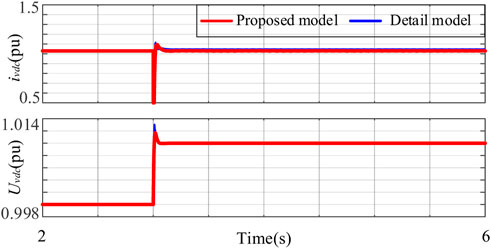
FIGURE 5. Time-domain response waveforms of the DC voltage and DC current of the PV inverter.
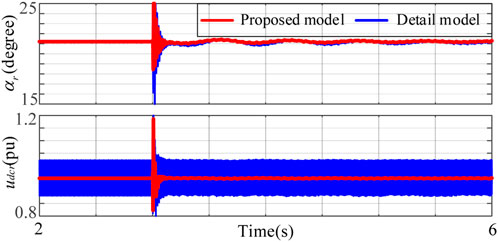
FIGURE 6. Time-domain response waveforms of the firing angle and DC voltage of the sending-terminal system.
In this section, the typical small-signal model of the new power system is used to analyze the wide-band oscillation problem, and the influence of distance, access proportion, and operation and control modes of renewable energy on the wide-band oscillation characteristics of the system is analyzed.
Different access distances of renewable energy generation equipment connected to the sending-terminal system of LCC-HVDC change the system impedance value, thus changing the dynamic stability characteristics of the system. The system topology diagram is shown in Figure 1. The influence of the change in distance of renewable energy generation connected to the sending-terminal system on the wide-band oscillation characteristics of the system is investigated, and the correctness of the analysis is verified by the detailed time-domain model.
The output power of the synchronous machine is 580 MVA, and the output power of the PV station is 1000 MVA. Increasing the impedance value of PV station access to the system, the influence on system stability of the new power system is shown in Figure 7 with varying access distances of the PV station. In this paper, there are many eigenvalues with great differences. In order to make the trend of eigenvalue trajectory obvious, only the main eigenvalues affecting the system stability are shown in Figure 7. In this scenario, the system poles monotonically move from the right plane to the left half plane and cross the virtual axis to the left half plane, and the system stability changes from the unstable state to stable state. When the impedance of PV station access to the system is 0.28 pu, the model presents one pair of eigenvalues located in the right half plane (0.00187 ± 203i). When the impedance of PV station access to the system increases to 0.5 pu, the largest pair of eigenvalues of the real part monotonically moves from the right plane to the left half plane and cross the virtual axis to the left half plane (-0.00129 ± 203i). In order to verify the correctness of the aforementioned analysis, Figure 8 and Figure 9 give the response waveforms of the detailed time-domain model with the same parameters, switching the line parameters at 5 s. When the impedance of PV station access to the system is switched from 1 pu to 0.28 pu, the system is destabilized as shown in Figure 8; when the impedance of PV station access to the system is switched from 1 pu to 0.5 pu, the system is stabilized as shown in Figure 9, which is consistent with the results of eigenvalue trajectory analysis.
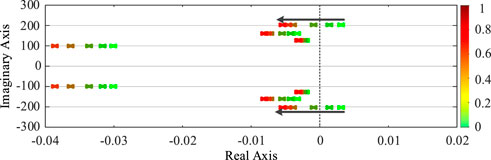
FIGURE 7. Eigenvalue trajectory of the sending-terminal system with varying AC line impedance values.
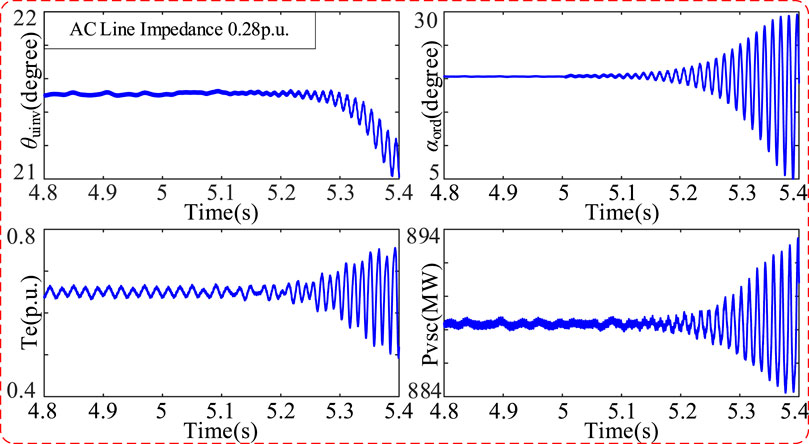
FIGURE 8. Response waveforms of the detailed time-domain model with the AC line impedance at 0.28 pu.
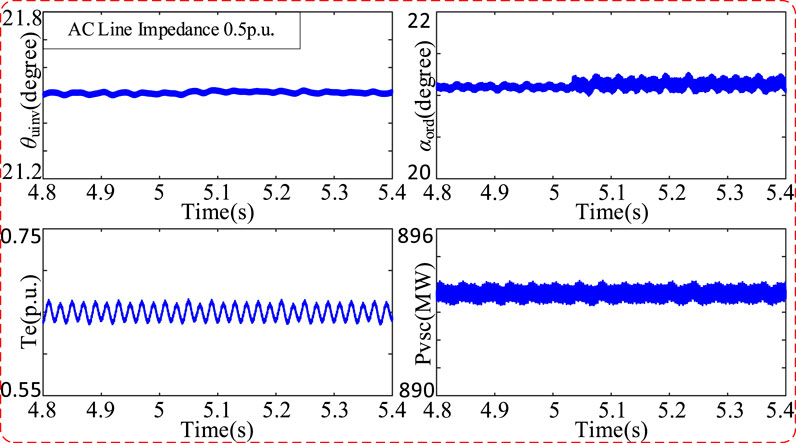
FIGURE 9. Response waveforms of the detailed time-domain model with the AC line impedance at 0.5 pu.
Different access distances of renewable energy generation equipment connected to the receiving-terminal system of LCC-HVDC change the system impedance value, thus changing the dynamic stability characteristics of the system. The influence of the change in distance of renewable energy generation connected to the receiving-terminal system on the wide-band oscillation characteristics of the system is investigated, and the correctness of the analysis is verified by the detailed time-domain model.
The output power of synchronous machine is 580 MVA, and the output power of PV station is 1000 MVA. Increasing the impedance value of PV station access to the system, the influence on system stability of the new power system is shown in Figure 10 with varying access distances of the PV station. In this paper, there are many eigenvalues with great differences. In order to make the trend of eigenvalue trajectory obvious, only the main eigenvalues affecting the system stability are shown in Figure 10. In this scenario, the system poles monotonically move from the right plane to the left half plane and cross the virtual axis to the left half plane, and the system stability changes from the unstable state to stable state. When the impedance of PV station access to the system is 0.28 pu, the model presents one pair of eigenvalues located in the right half plane (0.00258 ± 203i). When the impedance of PV station access to the system increases to 0.56 pu, the largest pair of eigenvalues of the real part monotonically moves from the right plane to the left half plane and cross the virtual axis to the left half plane (-0.00043 ± 203i). In order to verify the correctness of the aforementioned analysis, Figure 11 and Figure 12 give the response waveforms of the detailed time-domain model with the same parameters, switching the line parameters at 5 s. When the impedance of PV station access to the system is switched from 1 pu to 0.28 pu, the system is destabilized as shown in Figure 11; when the impedance of PV station access to the system is switched from 1 pu to 0.56 pu, the system is stabilized as shown in Figure 12, which is consistent with the results of eigenvalue trajectory analysis.
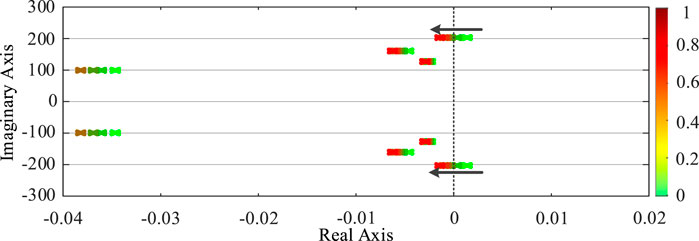
FIGURE 10. Eigenvalue trajectory of the receiving-terminal system with varying AC line impedance values.
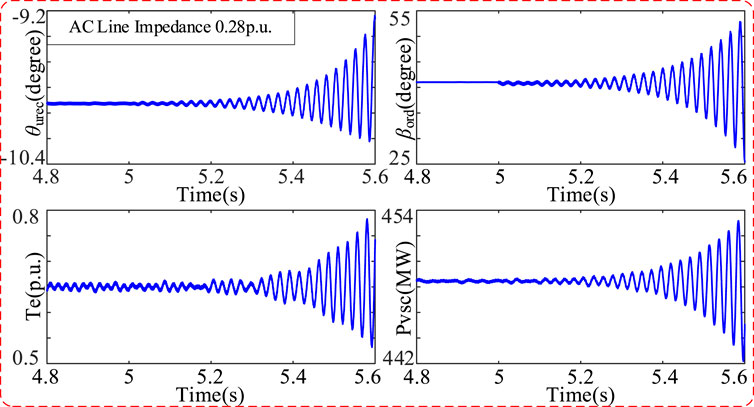
FIGURE 11. Response waveforms of the detailed time-domain model with the AC line impedance at 0.28 pu.

FIGURE 12. Response waveforms of the detailed time-domain model with the AC line impedance at 0.56 pu.
On the basis of the proposed model which contains the application of high proportion of power electronic equipment, changing the access distance of the PV station and comparing the influence of the change of control mode of power electronic equipment on multi-scale dynamic characteristics with and without voltage outer-loop control, when the controller of the PV station does not have the voltage outer-loop control, the DC side of the PV inverter uses an equivalent DC voltage source.
Short-time Fourier transform-based time–frequency analyses are conducted for electrical torque responses, and their results are shown in Figure 13. When the output and capacity of the PV station are unchanged and the inverter has no voltage outer-loop control, the closer the access distance of the inverter of the PV station connected to the power grid, the more prone it is to oscillate and destabilize the 15 Hz mode of the synchronous machine shaft system in the dynamic process of the system; when the output and capacity of the PV station are unchanged and considering the multi-scale cascade control of the inverter, compared with the case with only the current inner-loop control, the oscillation phenomenon of the synchronous machine shaft system in the 15 Hz mode is the opposite.
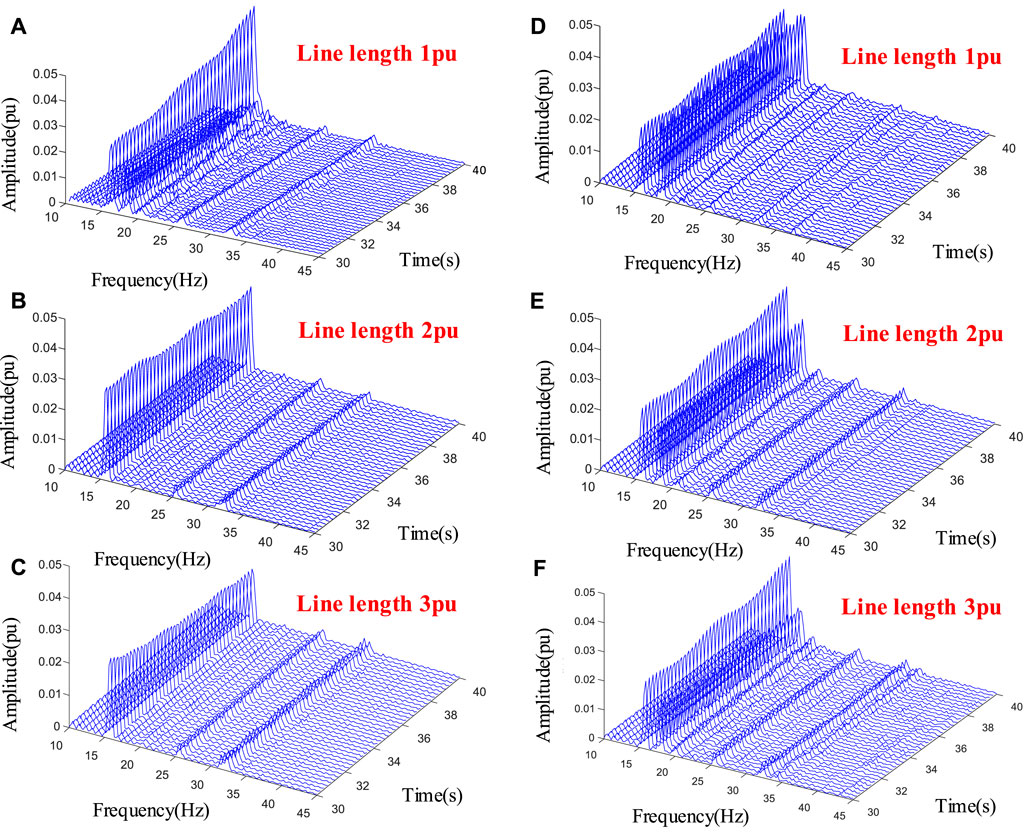
FIGURE 13. Time–frequency analyses of the electrical torque responses when changing the access distance of the PV station: (A),(B),(C) without voltage outer-loop control; (D),(E),(F) with voltage outer-loop control.
On the basis of the proposed model which contains the application of high proportion of power electronic equipment, the installed capacity of the PV station is changed, and without changing the output size of the PV station, comparing the influence of the change in control mode of power electronic equipment on multi-scale dynamic characteristics with and without voltage outer-loop control, when the controller of the PV station does not have the voltage outer-loop control, the DC side of the PV inverter uses an equivalent DC voltage source.
Short-time Fourier transform-based time–frequency analyses are conducted for electrical torque responses, and their results are shown in Figure 14. When the output of the PV station are unchanged, the smaller the capacity of the PV station is, the more prone it is to oscillate and destabilize the 15 Hz mode of the synchronous machine shaft system in the dynamic process of the system. When considering the multi-scale cascade control of the inverter of the PV station, compared with the case with only the current inner-loop control, the oscillation phenomenon of the synchronous machine shaft system in the 15 Hz mode is weakened or even disappeared, and the multi-scale interactions weaken the oscillation phenomenon in the system.
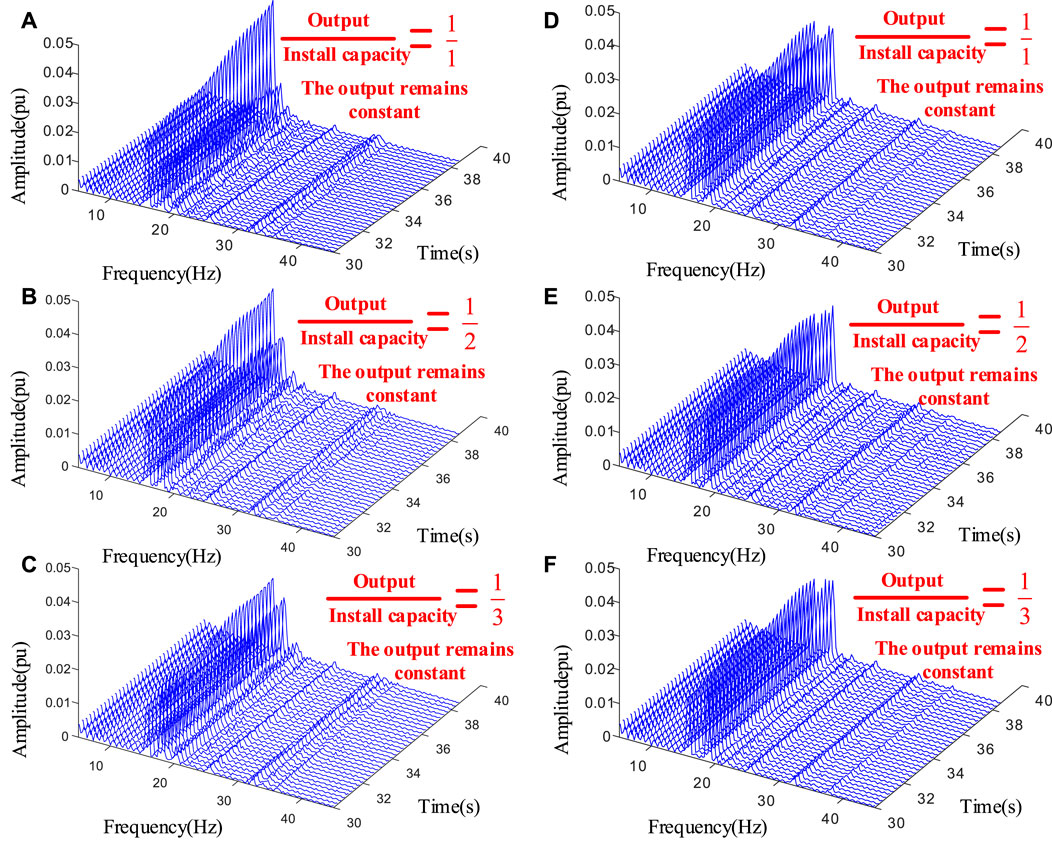
FIGURE 14. Time–frequency analyses of the electrical torque responses when the output size of the PV remains constant: (A),(B),(C) without voltage outer-loop control; (D),(E),(F) with voltage outer-loop control.
On the basis of the proposed model which contains the application of high proportion of power electronic equipment, the output size of the PV station is changed, and without changing the installed capacity of the PV station, comparing the influence of the change in control mode of power electronic equipment on multi-scale dynamic characteristics with and without voltage outer-loop control, when the controller of the PV station does not have the voltage outer-loop control, the DC side of the PV inverter uses an equivalent DC voltage source.
Short-time Fourier transform-based time–frequency analyses are conducted for electrical torque responses, and their results are shown in Figure 15. When the installed capacity of the PV station remains constant, the greater the output of the PV station is, the more prone it is to oscillate and destabilize the 15 Hz mode of the synchronous machine shaft system in the dynamic process of the system. When considering the multi-scale cascade control of the inverter of the PV station, compared with the case with only the current inner-loop control, the oscillation phenomenon of the synchronous machine shaft system in the 15 Hz mode is weakened, and the multi-scale interactions weaken the oscillation phenomenon in the system.
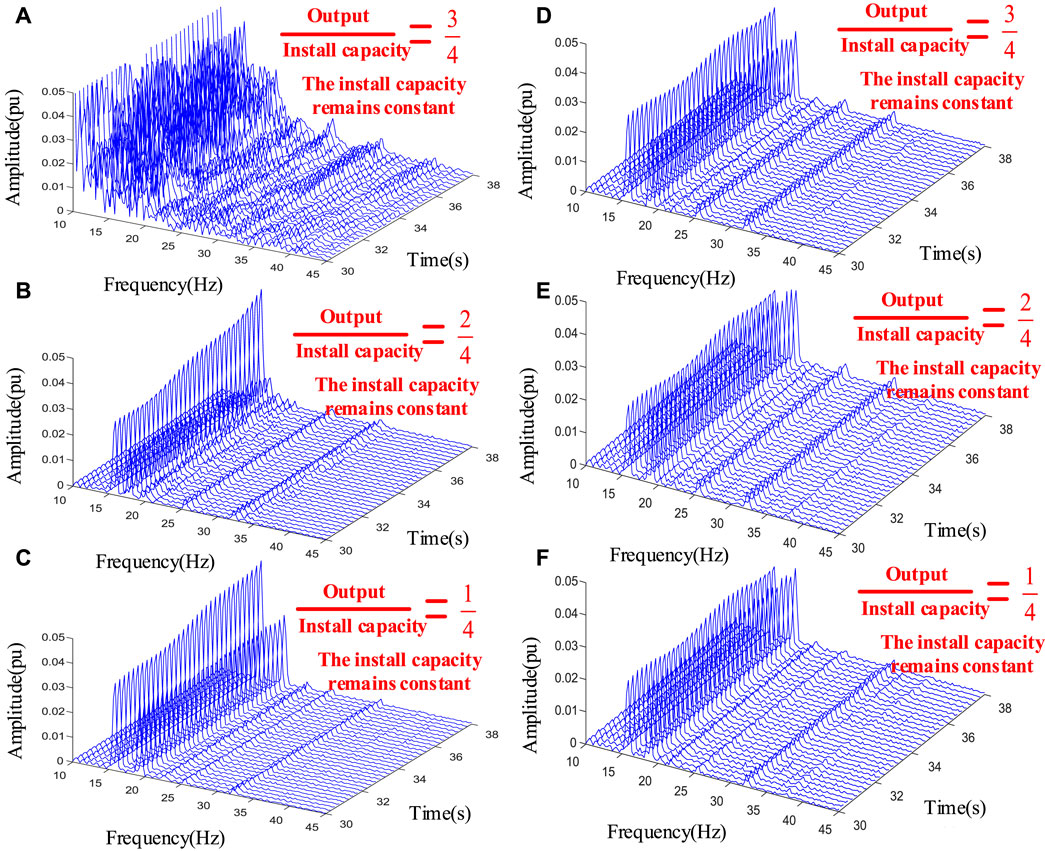
FIGURE 15. Time–frequency analyses of the electrical torque responses when installed capacity of the PV station remains constant: (A),(B),(C) without voltage outer-loop control; (D),(E),(F) with voltage outer-loop control.
This paper studies the oscillation problem of grid-connected power electronic devices such as renewable energy generation and DC power transmission. A typical small-signal model of the new power system which is composed of synchronous generator, HVDC transmission equipment, and renewable energy generation equipment is constructed, the influence of access proportion, access distance, and operation and control modes of renewable energy on the wide-band oscillation characteristics of the system is explored, and the correctness of the analysis is verified by the detailed time-domain model.
1) The larger the AC impedance value of the PV station connected to the DC system, the better the system stability. Under the same output of the PV station, the PV station connected to the receiving-terminal system of LCC-HVDC is more prone to oscillation risk than that connected to the sending-terminal system of LCC-HVDC.
2) Under the condition that the output and capacity of the PV station are unchanged, with the increase in the access distance of the inverter of the PV station connected to the power grid, the system stability changes from the stable state to oscillating instability state when there is only current inner-loop control and from the oscillating instability state to stable state when considering the multi-scale cascade control.
3) Under the condition that the output of the PV station is unchanged, the smaller the capacity of the PV station is, the more prone it is to oscillate, and under the condition that the installed capacity of the PV station is unchanged, the greater the output of the PV station is, the more prone it is to oscillate. The multi-scale cascade control can make the oscillation phenomenon diminish or even disappear.
The original contributions presented in the study are included in the article/Supplementary Material; further inquiries can be directed to the corresponding author.
KJ conducted the investigation, designed the structure of the manuscript, and wrote the original draft of the manuscript. DL and KC contributed to supervision over the study of the literature and review of the manuscript. PH and PX validated the model of this paper. YW studied the sources. All authors contributed to manuscript revision and read and approved the submitted version.
This research received funding from the Science and Technology Project of State Grid Corporation of China (project number: 4000-202222070A-1-1-ZN).
Authors KJ, DL, KC, PH, PX were employed by State Grid Hubei Electric Power Research Institute. Author YW was employed by state Grid Hubei Electric Power Company Limited.
The authors declare that this study received funding from science and technology project of state grid corporation of China. The funder had the following involvement in the study: data collection and analysis, decision to publish.
All claims expressed in this article are solely those of the authors and do not necessarily represent those of their affiliated organizations, or those of the publisher, the editors, and the reviewers. Any product that may be evaluated in this article, or claim that may be made by its manufacturer, is not guaranteed or endorsed by the publisher.
Adams, J., Pappu, V., and Dixit, A. (2012). “ERCOT experience screening for Sub-Synchronous Control Interaction in the vicinity of series capacitor banks,” in IEEE Power and Energy Society General Meeting, San Diego, CA, USA, 22-26 July 2012.
Chen, X., Mcelroy, M. B., Wu, Q., Shu, Y., and Xue, Y. (2019). Transition towards higher penetration of renewables: An overview of interlinked technical, environmental and socio-economic challenges. J. Mod. Power Syst. Clean Energy 7 (1), 1–8. doi:10.1007/s40565-018-0438-9
Cheng, Y., Fan, L., Rose, J., Huang, S. H., Schmall, J., Wang, X., et al. (2022). Real-world subsynchronous oscillation events in power grids with high penetrations of inverter-based resources. IEEE Trans. Power Syst. 38, 316–330. doi:10.1109/TPWRS.2022.3161418
Dong, X., Tian, X., Zhang, Y., and Song, J. (2017). Practical SSR incidence and influencing factor analysis of DFIG-based series-compensated transmission system in guyuan farms. High. Volt. Eng. 43 (1), 321–328.
Du, W., Wang, Y., Wang, H., Xiao, X., Wang, X., and Xie, X. (2020). Analytical examination on the amplifying effect of weak grid connection for the DFIGs to induce torsional sub-synchronous oscillations. IEEE Trans. Power Deliv. 35 (4), 1928–1938. doi:10.1109/tpwrd.2019.2957005
Fan, C., Yao, J., and Zhang, Q. (2020). Reflection and analysis for oscillation of the blackout event of 9 August 2019 in UK. Power Eng. Technol. 39 (4), 34–41.
Fateh, D., Birjandi, A., and Guerrero, J. (2020). Safe sub synchronous oscillations response for large DFIG-based wind farms. IEEE Access 8, 169822–169834. doi:10.1109/access.2020.3019234
Fu, Q., Du, W., Wang, H., and Ren, B. (2021). Analysis of small-signal power oscillations in MTDC power transmission system. IEEE Trans. Power Syst. 36 (4), 3248–3259. doi:10.1109/tpwrs.2020.3043041
Gontijo, G., Bakhshizadeh, M., Kocewiak, L., and Teodorescu, R. (2022). State space modeling of an offshore wind power plant with an MMC-HVDC connection for an eigenvalue-based stability analysis. IEEE Access 10, 82844–82869. doi:10.1109/access.2022.3196368
Guo, J., Ma, S., Wang, T., Jing, Y., Hou, W., and Xu, H. (2022). Challenges of developing a power system with a high renewable energy proportion under China's carbon targets. iEnergy 1 (1), 12–18. doi:10.23919/ien.2022.0005
Guo, X., Liu, B., Mei, H., Liu, J., Yu, H., and Cao, F. (2020). Analysis and suppression of resonance between AC and DC systems in chongqing-hubei back-to-back HVDC project of China. Automation Electr. Power Syst. 44 (20), 157–164.
Guo, X., Liu, Z., and Li, Y. (2020). Characteristic analysis of high-frequency resonance of flexible high voltage direct current and research on its damping control strategy. Proc. CSEE 40 (01), 19–29.
Hu, J., Yuan, X., and Cheng, S. (2019). Multi-time scale transients in power-electronized power systems considering multi-time scale switching control schemes of power electronics apparatus. Proc. CSEE 39 (18), 5457–5467.
Irwin, G., Jindal, A. K., and Isaacs, A. L. (2011). “Sub-synchronous control interactions between type 3 wind turbines and series compensated AC transmission systems,” in IEEE Power and Energy Society General Meeting, Detroit, USA, 24-28 July 2011.
Jiang, K., Hu, P., Cao, K., Liu, D., and Ye, C. (2022). Small-signal modeling and interaction analysis of LCC-HVDC systems based on harmonic state space theory. IEEE Access 10, 109937–109948. doi:10.1109/access.2022.3213709
Larsen, E. V. (2012). “Wind generators and series-compensated AC transmission lines,” in IEEE Power and Energy Society General Meeting, San Diego, USA, 22-26 July 2012.
Liu, H., Xie, X., He, J., Xu, T., Yu, Z., Wang, C., et al. (2017). Subsynchronous interaction between direct-drive pmsg based wind farms and weak ac networks. IEEE Trans. Power Syst. 32 (6), 4708–4720. doi:10.1109/tpwrs.2017.2682197
Shao, B., Zhao, S., Yang, Y., Gao, B., and Blaabjerg, F. (2021). Sub-synchronous oscillation characteristics and analysis of direct-drive wind farms with VSC-HVDC systems. IEEE Trans. Sustain. Energy 12 (2), 1127–1140. doi:10.1109/tste.2020.3035203
Silva-Saravia, H., Pulgar-Painemal, H., Tolbert, L., Schoenwald, D., and Ju, W. (2021). Enabling utility-scale solar PV plants for electromechanical oscillation damping. IEEE Trans. Sustain. Energy 12 (1), 138–147. doi:10.1109/tste.2020.2985999
Sun, J., and Liu, H. (2017). Sequence impedance modeling of modular multilevel converters. IEEE J. Emerg. Sel. Top. Power Electron. 5 (4), 1427–1443. doi:10.1109/jestpe.2017.2762408
Sun, K., Yao, W., Yan, C., and Wen, J. (2021). Impedance modeling and analysis of medium-frequency oscillation caused by VSC-HVDC connected to local weak grid and DFIG-based wind farms. Front. Energy Res. 9. doi:10.3389/fenrg.2021.693903
Szechtman, M., Wess, T., and Thio, C. (1991). “A benchmark model for HVDC system studies,” in International Conference on AC and DC Power Transmission, London, UK, 17-20 September 1991, 374–378.
Wang, M., Cao, Z., Liu, B., Li, J., Fernando, T., and Liu, X. (2022). Impedance modeling and stability analysis of all-DC delivered offshore wind farm. IEEE J. Emerg. Sel. Top. Circuits Syst. 12 (1), 20–28. doi:10.1109/jetcas.2022.3150174
Wang, W., Li, G., and Guo, J. (2022). Large-scale renewable energy transmission by HVDC: Challenges and proposals. Engineering 19, 252–267. doi:10.1016/j.eng.2022.04.017
Xie, X., He, J., Mao, H., and Li, H. (2021). New issues and classification of power system stability with high shares of renewables and power electronics. Proc. CSEE 41 (2), 461–474.
Xie, X., Zhang, X., Liu, H., Li, Y., and Zhang, C. (2017). Characteristic analysis of subsynchronous resonance in practical wind farms connected to series-compensated transmissions. IEEE Trans. Energy Convers. 32 (3), 1117–1126. doi:10.1109/tec.2017.2676024
You, S., Kou, G., Liu, Y., Zhang, X., Cui, Y., Till, M. J., et al. (2017). Impact of high PV penetration on the inter-area oscillations in the U.S. Eastern interconnection. IEEE Access 5, 4361–4369. doi:10.1109/access.2017.2682260
Yuan, X., Zhang, M., Chi, Y., and Ju, P. (2022). Basic challenges of and technical roadmap to power-electronized power system dynamics issues [J]. Proc. CSEE 42 (5), 1904–1917.
Keywords: high proportion of renewable energy, high-voltage direct current, high proportion of power electronic, wide-band oscillation, dynamic behavior
Citation: Jiang K, Liu D, Cao K, Hu P, Xiong P and Wu Y (2023) Small-signal modeling and wide-band oscillation analysis with the high proportion of renewable energy integrated through LCC-HVDC. Front. Energy Res. 11:1168274. doi: 10.3389/fenrg.2023.1168274
Received: 17 February 2023; Accepted: 05 April 2023;
Published: 15 May 2023.
Edited by:
Jun Liu, Xi’an Jiaotong University, ChinaReviewed by:
Fang Shi, Shandong University, ChinaCopyright © 2023 Jiang, Liu, Cao, Hu, Xiong and Wu. This is an open-access article distributed under the terms of the Creative Commons Attribution License (CC BY). The use, distribution or reproduction in other forums is permitted, provided the original author(s) and the copyright owner(s) are credited and that the original publication in this journal is cited, in accordance with accepted academic practice. No use, distribution or reproduction is permitted which does not comply with these terms.
*Correspondence: Kezheng Jiang, amlhbmdrejIxQDE2My5jb20=
Disclaimer: All claims expressed in this article are solely those of the authors and do not necessarily represent those of their affiliated organizations, or those of the publisher, the editors and the reviewers. Any product that may be evaluated in this article or claim that may be made by its manufacturer is not guaranteed or endorsed by the publisher.
Research integrity at Frontiers
Learn more about the work of our research integrity team to safeguard the quality of each article we publish.