
94% of researchers rate our articles as excellent or good
Learn more about the work of our research integrity team to safeguard the quality of each article we publish.
Find out more
ORIGINAL RESEARCH article
Front. Energy Res., 30 May 2023
Sec. Sustainable Energy Systems
Volume 11 - 2023 | https://doi.org/10.3389/fenrg.2023.1167330
This article is part of the Research TopicAdvanced Technologies for Planning, Modeling, Optimization, Storage and Control of Urban Energy SystemView all 4 articles
 Xiaolin Wu*
 Decheng Fan
In the strategic context of promoting the comprehensive revitalization of Northeast China, green innovation, as the integration of the two development concepts of innovation-driven and green development, has become an essential means to promote sustainable and high-quality development in Northeast China. By constructing the Super-SBM model with undesired output and the Global Malmquist-Luenberger index model, the green innovation efficiency and green innovation total factor productivity of 34 prefecture-level cities in Northeast China from 2011 to 2020 are measured. Then the natural break point classification method, standard deviation ellipse and Dagum Gini coefficient decomposition method are used to explore their spatial and temporal evolution characteristics. Based on the measured results of green innovation efficiency and green innovation total factor productivity in Northeast China, all the cities are classified into four types: high-high, high-low, low-high and low-low. The study results show that the green innovation efficiency (GIE) of cities in the northeast region shows an excellent upward trend, and the distribution pattern of “strong in the North and weak in the South” is more prominent. The green innovation total factor productivity shows a fluctuating decline, and technical efficiency and technological progress inhibit the improvement of green innovation efficiency. The centre of gravity of efficiency has generally migrated towards the southwest, green innovation efficiency among cities has gradually tended to develop in a balanced manner, and inter-provincial differences are the primary source of spatial differences in green innovation efficiency. The study concludes that the northeast region should continuously improve its green innovation resource allocation capacity, accelerate the green transformation and upgrading of industrial structure, clarify green innovation subjects, optimize the green innovation environment and formulate differentiated development strategies to promote the synergistic development of green innovation among cities.
As the cradle of New China’s industry, the development of the old industrial bases in Northeast China has been highly valued by the Party Central Committee and the State Council. In recent years, relevant documents issued by the state have pointed out that the Northeast should rely closely on innovation to promote development, enhance the independent research and development capabilities of enterprises, and accelerate the construction of industrial innovation system to promote the further development of the economy in Northeast China (Xu et al., 2021). The strategy of “comprehensively revitalizing the old industrial bases in Northeast China” is an essential element of the national manufacturing power strategy and has achieved remarkable results. However, there is still a big gap between the innovation capacity of the urban clusters in the northeast and those in the economically developed Yangtze River Delta and Pearl River Delta. According to the “ 2021 China Urban Science and Technology Innovation Development Report,” among the top 50 cities in the urban science and technology innovation development index, only Shenyang, Dalian, Changchun and Harbin were selected in the northeast region (CISTDS, 2022). It shows that the differences in innovation and development among cities in Northeast China are significant. In addition, since implementing the green development strategy, the northeast region has increased its investment in environmental protection, and the proportion of investment in environmental pollution control has gradually increased. However, the long-term extensive economic development model has caused serious damage to the urban ecological environment in the northeast region, and the consumption of resources is also increasing. According to the “2019 China Green City Index TOP50 Report,” only Shenyang, Changchun, Harbin and Dalian are still selected in the northeast region (Chen, 2020). Under the new economic normal, how to get rid of the “New Northeast Phenomenon” and realize the green transformation of the economy in the three northeastern provinces is a crucial link to accomplish the goal of revitalizing the old industrial bases in Northeast China. As an important platform to promote economic development and environmental protection, cities are the critical breakthrough point to achieving green and sustainable development in Northeast China (Sáez et al., 2020).
In recent years, implementing the innovation-driven development strategy has given a new motivation to China’s economic growth. However, the rapidly growing economy has also imposed an enormous environmental burden (Fei et al., 2021). According to the “Global Environmental Performance Index 2022” jointly released by Yale University and other research units, China’s environmental performance index ranks only 160th out of 180 economies with 28.4 points (Lin et al., 2021). It can be seen that the economic growth brought about by traditional innovation has not led to an effective improvement in China’s environmental quality. In order to effectively alleviate the pressure of economic growth on resources and the environment, it is necessary to introduce green concepts into traditional technological innovation activities and promote green innovation (Yao et al., 2022). The Fifth Plenary Session of the 18th CPC Central Committee put forward the five development concepts of “innovation, coordination, green, openness and sharing “for the first time to realize the coordinated development of the economy and green environmental protection (Yang and Zhu, 2022). Subsequently, the report of the 19th National Congress of the Communist Party of China highlighted the innovation-driven green development strategy, which aims to promote high-quality green development of the economy (Song and Han, 2022). As the integration of “green development” and “innovation-driven,” green innovation helps to promote further the coordination between the regional innovation system and green economic system, and the key to accelerating the green transformation development lies in the improvement of green innovation efficiency (Xu et al., 2020).
At present, research on green innovation efficiency is divided into two main categories: the first category is the measurement of green innovation efficiency, and the research areas are mainly focused on the industry level and the regional level. The industrial level includes manufacturing industries (Wang et al., 2017; Gao et al., 2022), high energy-consuming industries (Li and Zeng, 2020; Zhu et al., 2021) and high-tech industries (Liu et al., 2020), while regional studies on green innovation efficiency are mainly located at the provincial level. Xu et al. (2020) studied the changes in green innovation efficiency in 15 provinces and cities in China’s Yangtze River Economic Belt from 2003–2015 (Xu et al., 2020). Wang et al. measured the overall, inter-period and regional green technology innovation efficiency of 30 Chinese provinces from 2012–2019 (Wang and Ren, 2022). The second category is the influencing factors of green innovation efficiency, which mainly includes internal factors of enterprises and external environmental factors. Among them, the internal factors of enterprises mainly include R&D intensity, technology level, enterprise scale, and talent quality, and the external environmental factors mainly include consumer demand, environmental regulation, and government policy system (Henriques and Sharma, 2005; Hashimoto and Haneda, 2008; Cuerva et al., 2014; Shao et al., 2016).
On this basis, the paper adopts the Super-SBM model and the Global Malmquist-Luenberger (GML) index model to measure the green innovation efficiency and green innovation total factor productivity of cities in Northeast China from both static and dynamic perspectives. Then using the standard deviation ellipse and Dagum Gini coefficient decomposition method, explore the spatial and temporal evolution trend and regional difference characteristics. It aims to enrich and expand the relevant research on green innovation efficiency, provide some reference for the green transformation and development of Northeast China, and promote the vigorous development of Northeast China’s economy.
The novelty of this study is mainly reflected in the following aspects.
(1) This paper makes an empirical analysis of the green innovation efficiency and its spatial and temporal evolution characteristics of cities in Northeast China, which is helpful to enrich the relevant research on green innovation efficiency. The existing empirical research on the efficiency of green innovation mainly focuses on the enterprise, industry and provincial levels. Few studies on the efficiency of urban green innovation primarily focus on the national perspective or the Yangtze River Economic Belt, and few studies on the efficiency of urban green innovation in Northeast China. The present study uses Northeast cities as the research object alone, expanding the boundary of green innovation-related research.
(2) Fully consider the economic, social and environmental benefits of green innovation and select reasonable input-output indicators to evaluate the efficiency of green innovation. This study not only evaluates the green innovation efficiency of cities in Northeast China from the static efficiency perspective but also further explores the dynamic change trend of green innovation efficiency from the dynamic perspective. It provides explanatory notes for tracing the root causes of the inter-period improvement or decline of green innovation efficiency of cities in Northeast China.
(3) This paper provides references to promote the coordinated development of green innovation among cities. Most of the studies on green innovation efficiency focus on measuring and exploring its influencing factors, and they are mainly based on industrial economics and environmental economics. There are few studies on green innovation from the perspective of spatial geography. This paper first evaluates the green innovation efficiency of cities in Northeast China and analyzes its time evolution process. Then, from the spatial perspective, this paper explores the differences and evolution distribution characteristics of green innovation efficiency among cities in Northeast China to improve overall green innovation efficiency.
The following sections are structured as follows. Section 2 is a literature review that mainly reviews and discusses the literature on green innovation efficiency. Section 3 is the research design, including introducing the methodology and constructing the evaluation index system. Section 4 is empirical results, which mainly explore the current situation of green innovation efficiency and its spatial-temporal evolution characteristics in Northeast cities. Section 5 discusses the main findings. Section 6 presents the conclusion, corresponding policy recommendations, theoretical and practical implications, limitations of the paper and prospects.
As traditional innovation drives rapid economic development, it is also accompanied by destroying the ecological environment. How to obtain economic benefits while considering environmental benefits has become a concern for scholars, and the research on green innovation has begun to rise. The academic community has not yet formed a unified concept regarding green innovation. Broadly speaking, as long as it has the characteristics of innovation and can achieve resource conservation and environmental improvement, it can be classified as the connotation of green innovation. Similar to green innovation, there are three kinds of “environmental innovation,” “ ecological in-novation,” and “ sustainable innovation.” The connotation of these concepts is largely consistent (Beise and Rennings, 2005; Foxon and Pearson, 2008; Lin and Tseng, 2012). Green innovation efficiency incorporates environmental factors into the green innovation process, optimizes the ratio of innovation input and output elements, improves resource allocation efficiency while minimizing pollutant emissions, and is an important indicator to measure the level of green innovation development (Luo et al., 2019).
The research on green innovation efficiency is mainly carried out from three aspects: efficiency evaluation, influencing factors and spatial-temporal evolution. The measures of green innovation efficiency mainly contain two kinds of methods, one is the parametric method represented by the stochastic frontier approach (SFA) proposed by Aigner et al. (1977). For example, Miao et al. (2017) analyzed the impact of green technology innovation on natural resource utilization in China based on the SFA model of the Cobb-Douglas production function (Miao et al., 2017). Li et al. studied the efficiency and heterogeneity of green innovation and traditional innovation in China’s high-end manufacturing industry from 2010 to 2015 based on the RAGA-PP-SFA model (Li et al., 2018). Another is the non-parametric method represented by data envelopment analysis (DEA) proposed by Charnes and Cooper (Charnes et al., 1978), such as Luo et al. measured the green innovation efficiency of strategic emerging industries based on the DEA-Malmquist model (Luo et al., 2019). Du et al. used the shared inputs two-stage network DEA to measure the green innovation efficiency of Chinese industrial enterprises. They explored the regional heterogeneity of green technology R&D efficiency and technological achievement transformation efficiency (Du et al., 2019). Deng calculated the green innovation efficiency of China’s high-tech manufacturing industry using a network DEA model considering undesired outputs (Deng et al., 2020). With the continuous in-depth research on innovation efficiency, Tone proposed a SBM model considering slack, non-radial and non-angle, which overcomes the influence of the traditional DEA model on the reliability of the model without considering slack variables and inefficiency (Tone, 2001). For example, Tao used the inseparable input-output SBM model to measure the inter-provincial green economic efficiency of China from 1995 to 2012 (Tao et al., 2016). Long et al. used the Super-SBM model to calculate the green innovation efficiency of 11 provinces and cities in China’s Yangtze River Economic Belt (Long et al., 2020). Liu et al. constructed an improved SBM-DEA model to measure the green innovation efficiency of China’s high-tech industrial clusters (Liu et al., 2020).
The research field of green innovation efficiency initially focused on the industrial and regional levels. With the development of the country’s new urbanization, the research on green innovation efficiency has gradually expanded to the urban level. For example, Zeng et al. measured the green innovation efficiency of 26 cities in the Yangtze River Delta region of China from 2011–2017. They used a spatial econometric model to examine when the green innovation efficiency of the Yangtze River Delta cities achieved synergistic regional integration (Zeng et al., 2021). Liu et al. explored the spatial and temporal evolution characteristics and influencing factors of green innovation in China’s urban agglomerations from 2005 to 2020 (Liu et al., 2023). Guo et al. included undesired output into the evaluation index system of green innovation efficiency and calculated the green innovation efficiency of China’s Pearl River Delta urban agglomeration from 2009 to 2017 (Guo et al., 2021). There are abundant studies on the influencing factors of green innovation efficiency. It includes internal factors such as R&D intensity and enterprise-scale and external environmental factors such as environmental regulation and financial support. Henriques et al. argue that sufficient innovation capacity and a proactive strategic management model can effectively stimulate the green innovation capacity of enterprises (Henriques and Sharma, 2005). Hashimoto et al. argued that financial support, technical support, government procurement and tax incentives act as green innovation incentives (Hashimoto and Haneda, 2008). Cuerva counted fluctuations in productivity in the United States over 3 years and argued that government environmental regulation could impact the efficiency of firms’ green technology innovation (Cuerva et al., 2014). Shao et al. confirmed that increases in labour productivity, R&D intensity, and energy efficiency could improve green technological efficiency, while capital deepening mitigated green technological efficiency (Shao et al., 2016). Zhou et al. investigate whether environmental regulation can promote the financial development of green innovation in China and found that developing green finance under the sustainable development goal will promote green technology progress (Zhou and Du, 2021). As the research on green innovation efficiency has gradually intensified, some scholars have shifted their research perspective to the spatial-temporal evolution characteristics of green innovation. For example, (Hu et al., 2022) used GIS spatial analysis techniques and spatial measurement tools such as ESDA to explore the spatial-temporal evolution patterns of green innovation efficiency in three major urban agglomerations in China from an economic geography perspective (Hu et al., 2022). Wang et al. used kernel density estimation, cold hotspot analysis and standard deviation ellipsometry to visually analyze the spatial-temporal pattern evolution characteristics of green innovation efficiency in 285 cities in China from 2004–2018 (Wang et al., 2023). Zhuang et al. used an improved gravity model and social network analysis to study the spatial spillover effects of regional green innovation efficiency in China from a network perspective (Zhuang et al., 2022). Most of the research results show that the regional differences of urban green innovation efficiency in China are obvious, decreasing from the eastern coastal areas to the central, western and northeastern regions.
The academic research on green innovation efficiency has gradually formed a relatively complete system. Still, less attention has been paid to green innovation development in cities in Northeast China. Therefore, this paper analyzes the regional heterogeneity of green innovation efficiency in Northeast China from the dual perspectives of static efficiency and dynamic total factor productivity. It also explores its spatial and temporal evolutionary characteristics. It is of great theoretical and practical significance to further enhance the overall innovation capacity of Northeast China and promote the transformation of economic development to a green innovation model.
DEA model is mostly used to measure the efficiency of urban green innovation. However, on the one hand, the traditional DEA directional distance function is radial and production angular (input or output perspective), ignoring the improvement of non-zero slack variables. On the other hand, the output terms of the traditional DEA model are all desired outputs, and some output indicators in practice may cause efficiency reduction. The SBM model proposed by Tone effectively solves the above problem. However, when the efficiency value of multiple regions is in the optimal state (the efficiency value is 1), it cannot be further discriminated. In order to compare the green innovation efficiency values between effective decision-making units, this paper chooses the non-radial and non-angle Super-SBM model proposed by Tone (Tone, 2001). This model not only overcomes the shortcomings of the traditional DEA model but also makes up for the defect that the SBM model cannot distinguish the decision-making units so that it can effectively compare the green innovation efficiency among different cities in Northeast China.
Assume that in each period
Where
The expression of the Super-SBM model considering undesirable output is:
Based on the traditional ML index (Chung et al., 1997), Oh proposed the Global Malmquist-Luenberger (GML) index model to measure the level of innovation efficiency that includes undesired outputs (Oh, 2010). By constructing a global production technology set, the model effectively overcomes the possible insolvability problem in solving linear programming with an ML index. Besides, the model has the advantages of transferability, cumulative multiplication and cyclic accumulation, which allows comparison between decision units in different periods and avoids “passive” efficiency improvement and “ technical regressions.” In order to evaluate the dynamic evolution trend of urban green innovation efficiency growth in Northeast China, the global production technology set is first defined. Oh defines the global production technology set as the union of all current production technology sets, that is
Based on the Super-SBM model, the GML index model and its decomposition items from
In Formula (5), the index
The standard deviation ellipse has been widely used as a spatial statistical tool in environmental science, geography, and economics. Combining centre of gravity analysis with distance analysis can accurately reveal the multifaceted characteristics of geographic elements in spatial distribution. In this paper, we introduce the SDE model to explore the evolutionary features of urban green innovation efficiency in Northeast China from an overall perspective through the basic parameters of mean centre, long semi-axis and short semi-axis in geographic space. Among them, the moving trajectory of the average centre reflects the evolution pattern of green innovation efficiency in geographic space. In contrast, the long and short semi-axes reflect the degree of dispersion of efficiency in spatial distribution, as shown in Eqs 6–8.
In Eq. 8,
As an essential method to study the difference in regional variables, the Dagum Gini coefficient has been widely used in academia. Compared with the traditional Theil index and Gini coefficient, the Dagum Gini coefficient can be decomposed, effectively solving the problem of cross-overlap between sample data and the source of regional disparity. This paper uses the Dagum Gini coefficient decomposition method to examine the intra-regional and inter-regional differences in green innovation efficiency of cities in Northeast China. The Dagum Gini coefficient decomposition method decomposes the overall Gini coefficient
In Eq. 9,
ArcGIS natural breakpoint classification refers to the segmentation of spatial data, where each segment has an identifier, and each part and variable has its different variable range. In order to further explore the spatial differentiation characteristics of urban green innovation efficiency in Northeast China and more intuitively understand the differences in green innovation efficiency among cities, this paper refers to the practice of (Zhang et al., 2021). We use ArcGIS natural breakpoint classification method to divide green innovation efficiency into five grades: low efficiency, lower efficiency, medium efficiency, higher efficiency and high efficiency.
To measure the efficiency of urban green innovation in Northeast China, it is necessary to consider economic, social and environmental benefits. This paper fully considers the scientific indicators and data availability. We construct the evaluation index system of urban green innovation efficiency in Northeast China from the two dimensions of input and output. As shown in Table 1
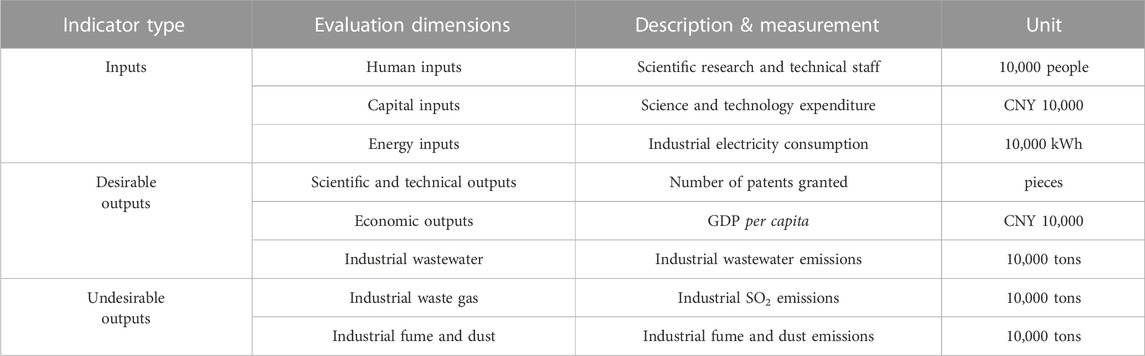
TABLE 1. Evaluation index system of green innovation efficiency in Northeast China.
The Cobb-Douglas function emphasizes the importance of labour and capital in production activities. Therefore, human and capital inputs are the fundamental resource elements of green innovation production activities. In addition, energy input elements must be added to the input index to reflect the innovation’s “green” attributes. Among them, high-quality talents are the basis and vital contributor to the green innovation activities of enterprises, and scientific research personnel can broadly reflect the labour of high-quality personnel in scientific and technological innovation. Therefore, this paper draws on Fei et al. (2021) and selects the number of scientific research and technical service personnel as the human input index of green innovation efficiency (Fei et al., 2021). Capital investment is the funds invested in green innovation activities to research and develop new products and technologies, which is a necessary financial expenditure for green innovation. In this paper, we refer to Shan et al. and select the science and technology expenditure in fiscal expenditure as the capital investment indicator of green innovation efficiency (Shan et al., 2022). Science and technology expenditures use a fixed-base GDP index with 2011 as the base period to eliminate the effect of price fluctuations. Energy input is usually characterized by energy consumption. Considering that this index cannot be obtained, this paper draws on the practice of Yang et al. (2022). and selects the total industrial electricity consumption to reflect the energy input of urban green innovation efficiency (Yang et al., 2022).
Green innovation should not only achieve considerable economic benefits but also strive to improve the ecological benefits of the environment. Therefore, this paper draws on existing research results and divides output indicators into desired and undesired outputs. Regarding the desired output, patents are the core of science and technology assets, reflecting the actual level of green innovation in the knowledge production process and including the number of patent applications and authorizations. Among them, the number of patent authorizations is not affected by the work capacity of the appraiser, and it can better reflect the knowledge output of green innovation than the number of patent applications. Therefore, this paper refers to Fankhauser et al. (2013) and selects the number of patent authorizations to measure green innovation’s potential market gain and value realization (Fankhauser et al., 2013). At the same time, to reflect the green innovation achievements more comprehensively, referring to the research of Wang et al. (2022) the per capita GDP is selected as the output indicator to measure the transformation benefits of green innovation achievements. The GDP index is used to deflate it with 2011 as the constant price to eliminate the influence of price factors (Wang et al., 2022). In terms of undesired output, we must consider the pollutants discharged by enterprises in green innovation to measure their negative impact on the development of urban green innovation. Based on the research of Xu et al. (2020), we select each city’s industrial sulfur dioxide, wastewater, smoke and dust emissions as undesired output indicators and use the entropy method to fit the three indicators into the environmental pollution index (Xu et al., 2020).
There are 36 prefecture-level cities (including regions and autonomous prefectures) in the three provinces of Northeast China. The Daxing ‘angling region and Yanbian Korean Autonomous Prefecture are eliminated due to the lack of data. Therefore, this study uses the remaining 34 prefecture-level and above cities in Northeast China as the research object. The original data required for the above evaluation index system are mainly derived from various yearbooks released by the National Bureau of Statistics from 2012 to 2021, including “The China City Statistical Yearbook,” “Liaoning Statistical Yearbook,” “Jilin Statistical Yearbook” and “Heilongjiang Statistical Yearbook.” The patent authorization data are derived from the CNRDS database platform, and a few missing data are supplemented by linear interpolation.
Based on the Super-SBM model considering undesired output, 34 prefecture-level and above cities in Northeast China from 2011 to 2020 are measured, as shown in Figure 1. Overall, the average value of green innovation efficiency of cities in Northeast China increased from 0.824 to 0.912 from 2011 to 2020. Although the overall efficiency of green innovation showed an excellent upward trend, it still did not reach an effective state, indicating that the efficiency of urban green innovation in Northeast China still had a large room for improvement. Among them, the efficiency of urban green innovation in Heilongjiang Province was the highest, followed by Liaoning Province, and Jilin Province was the weakest. The efficiency of green innovation in the three provinces showed significant differences in trends.
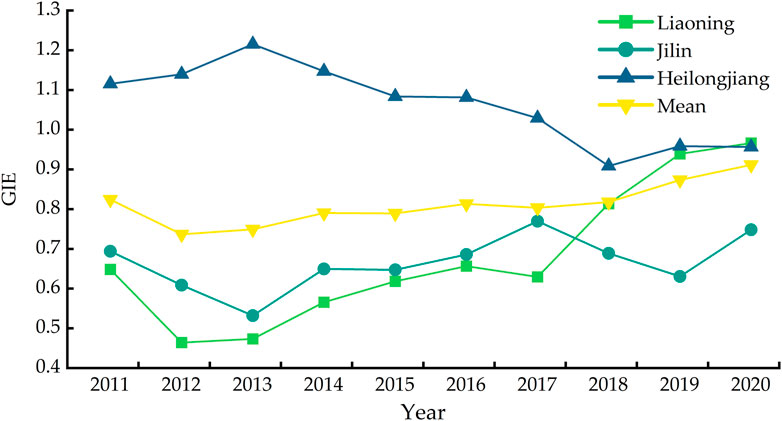
FIGURE 1. The trend of green innovation efficiency in three provinces of Northeast China.
From the regional perspective, as shown in Figure 1, the green innovation efficiency of Heilongjiang Province showed a fluctuating downward trend. However, it was always above the average urban green innovation efficiency value in Northeast China. The green innovation efficiency of Liaoning Province had the largest change range, showing a fluctuating upward trend from 2011 to 2017. However, it was lower than Heilongjiang Province and Jilin Province. After 2017, the green innovation efficiency of Liaoning Province increased rapidly, overtaking Heilongjiang Province to rank first among the three provinces by 2020. Although the green innovation efficiency of Jilin Province showed a slight upward trend, it was always lower than the average level of urban green innovation efficiency in Northeast China. During the study period, the average values of green innovation efficiency in Heilongjiang, Jilin and Liaoning provinces increased by −0.159, 0.054 and 0.318, respectively. The level of green innovation efficiency in the three provinces gradually evolved from a “large gap of low efficiency” to a “small gap of high efficiency,” indicating that the green innovation efficiency among the three provinces in Northeast China is gradually moving towards balanced development.
From the city level, as shown in Figure 2. Specifically, the green innovation efficiency of Harbin, Dalian, Liaoyuan, Hegang, Daqing and Kiamuze has always maintained a high level during the research period. Among them, Harbin and Dalian, as provincial capital cities and sub-provincial cities, respectively, play an important political and economic role in the development of Northeast China. They have sufficient innovative resources and rich environmental protection experience, so their green innovation efficiency is higher than others. Liaoyuan and Hegang are both declining resource cities. They are actively seeking green transformation and development in the case of lagging economic development, which has begun to bear fruit. As a mature resource city, Daqing can quickly respond to the new requirements of green and innovative development and has obvious latecomer advantages. Kiamuze has implemented the concept of green development in depth, balancing upgrading traditional industries with the cultivation of new industries, and green innovation is gaining momentum. As traditional old industrial cities, Chaoyang, Jilin, Tonghua and Siping are in the early stage of industrial transformation, with low investment in green innovation resources but high energy consumption and industrial emissions. Their green innovation efficiency is always low and belongs to the “green innovation depression.” The green innovation efficiency of 9 cities, such as Anshan, Fushun, Baishan and Heihe, has been improved to varying degrees. These cities have balanced the harmonious development of economy and green at the same time in their development process, and their green innovation capacity has been significantly enhanced. The green innovation efficiency of Songyuan, Baicheng, Mudanjiang and Suihua show a downward trend, which may be due to the extensive economic growth model and insufficient attention to green innovation.
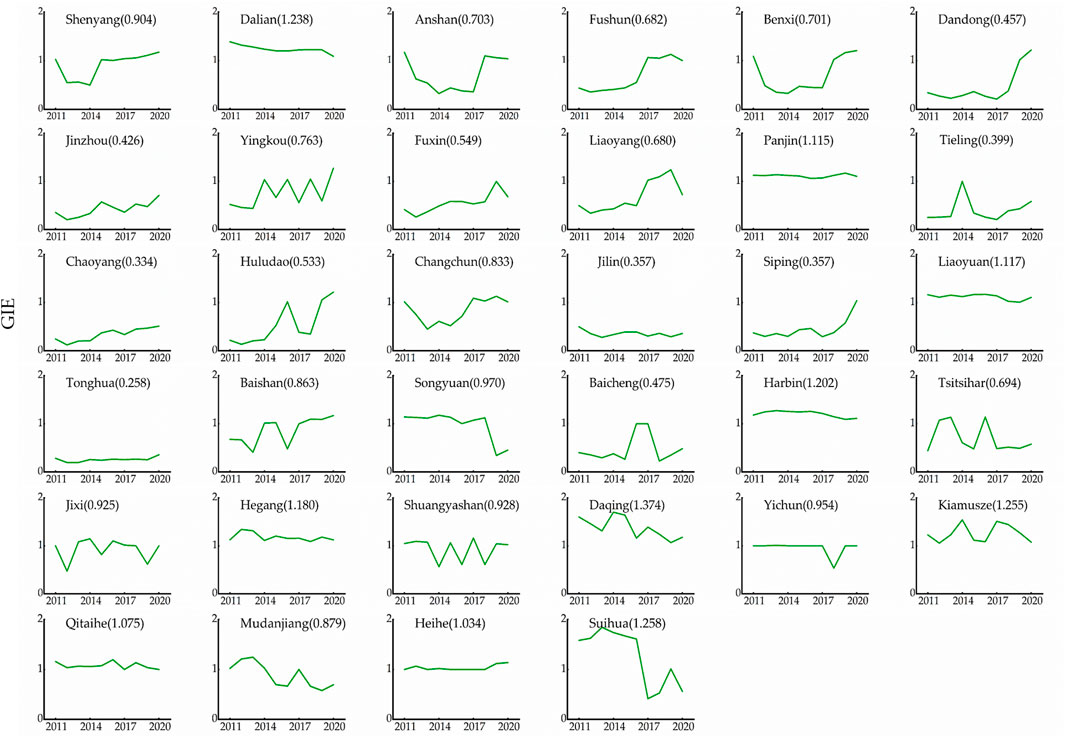
FIGURE 2. The trend of green innovation efficiency in cities in Northeast China.
In order to further examine the dynamic changes in green innovation efficiency of cities in Northeast China at different periods, this paper applied the Global Malmquist-Luenberger Index model to measure the total factor productivity of green innovation and obtained the annual average green innovation GML index and its decomposition term for each city level in Northeast China from 2011 to 2020 (Figure 3).
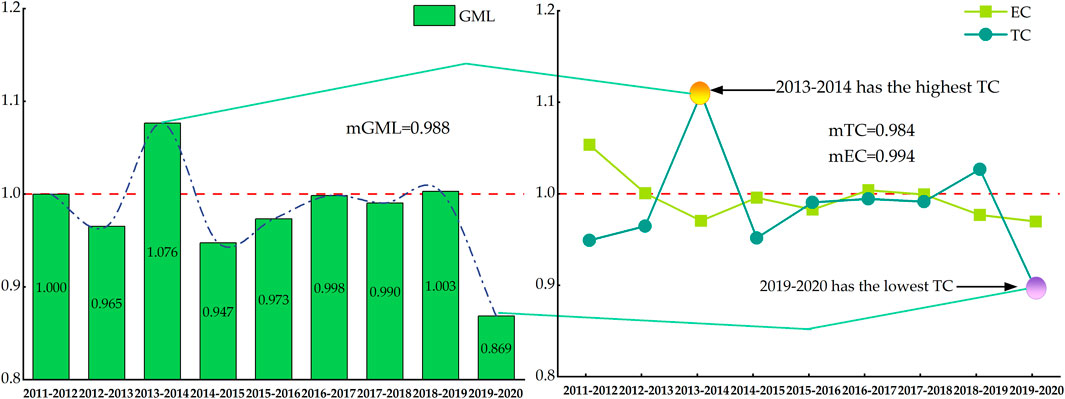
FIGURE 3. The GML index and its decomposition of green innovation efficiency in Northeast China from 2011 to 2020:
As shown in Figure 3, the GML index of urban green innovation in Northeast China decreased by 1.2% annually from 2011 to 2020. The overall green innovation productivity showed a significant downward trend, with positive growth only between 2013–2014 and 2018–2019. During the study period, the total factor productivity of urban green innovation in Northeast China reached the highest in 2013–2014 (1.076), while the lowest was in 2019–2020, and the total factor productivity of green innovation decreased by 13.1%. The GML index is further decomposed into a technical efficiency index (GEC) and a technical progress index (GTC), as shown in Figure 3. The technical efficiency index (GEC) declined at an average annual rate of 0.6%, with a slight fluctuating downward trend in the GEC index for cities in the Northeast between 2011 and 2020. The Technological Progress Index (GTC) declined at an average annual rate of 1.6%. Its trend is similar to the GML Index, which also showed a significantly fluctuating downward trend. Among them, GTC reached the maximum growth rate (10.9%) from 2013 to 2014, while the fastest decline was from 2019 to 2020, and the current GTC was only 0.896. The results show that technological progress is the main reason inhibiting the improvement of green innovation efficiency in cities in the Northeast. Therefore, the further improvement of green innovation efficiency must start with introducing new pollution control technologies, optimizing the environment and promoting green innovation technology progress. At the same time, green technology efficiency needs further improvement.
As shown in Table 2, the fastest increase in total factor productivity of urban green innovation during the study period was Songyuan, with an average annual increase of 4.3%, followed by Suihua and Qitaihe, with an average annual increase of 3.1% and 2.9%, and then Liaoyuan and Panjin, with average annual increases of 1.1% and 0.1%, respectively. In addition to the above five cities, the green innovation productivity of other cities in Northeast China was declining. Among them, the five cities with the fastest average annual decline were Huludao, Dandong, Yingkou, Siping and Shenyang. The Green Innovation GML Index was further decomposed into the Technical Efficiency Index (GEC) and the Technological Progress Index (GTC). For the technical efficiency index (GEC), there were 13 cities with an increase of more than 1. The high-value areas of GEC were mainly distributed in the southeast of Heilongjiang Province (Harbin, Suihua), the middle of Jilin (Songyuan, Jilin) and the south of Liaoning (Dalian, Panjin). The GTC values of Jixi, Yichun, and Hegang in Heilongjiang Province and Changchun in Jilin Province were all 1, and the GEC indexes of the remaining 17 cities were less than 1. For the technological progress index (GTC), except for Qitaihe, Liaoyuan, Heihe and Panjin, the GTC index of other cities was less than 1, indicating that technological progress was the primary source of resistance to improving the efficiency of green innovation in cities in the Northeast.
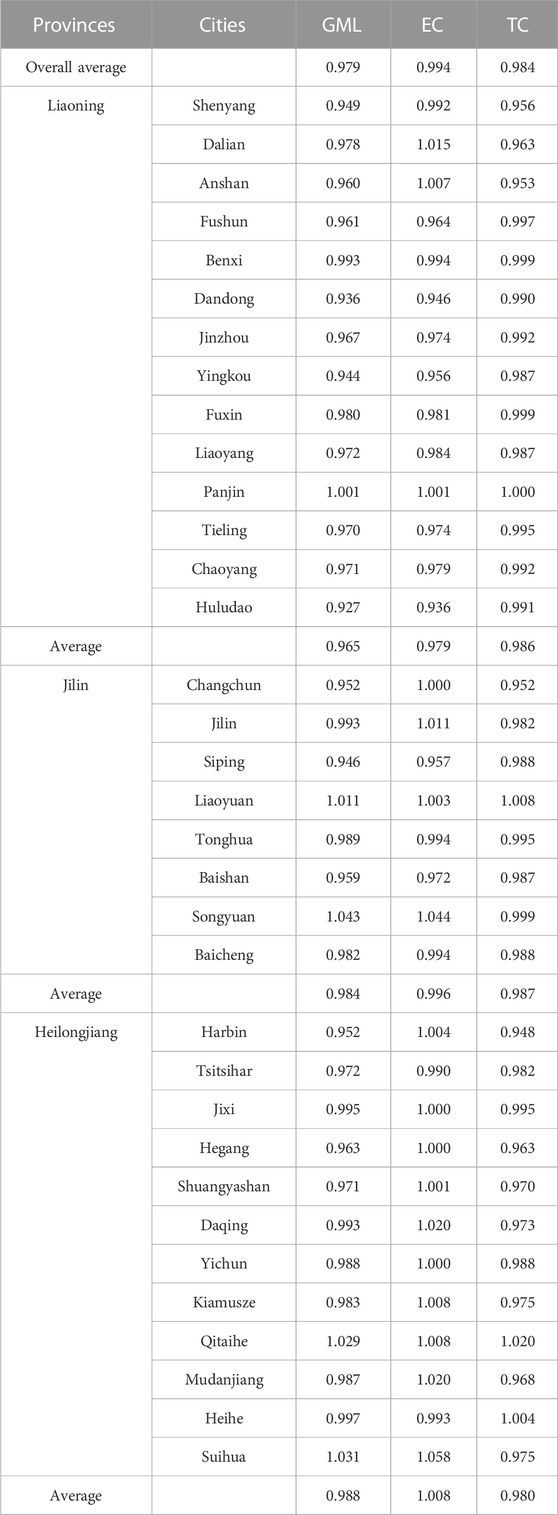
TABLE 2. The average annual green innovation efficiency GML index and its decomposition of 34 prefecture-level cities in Northeast China from 2011 to 2020.
This paper selects four-time sections 2011, 2014, 2017, and 2020. It divides the green innovation efficiency of 34 cities into five types: low efficiency, lower efficiency, medium efficiency, higher efficiency and high efficiency (Figure 4), based on the natural break point classification method with reference to Zhang et al. (2021), and draws a map of the distribution pattern of urban industrial green innovation efficiency (Figure 5) to study further the spatial divergence characteristics of urban GIE in Northeast China.
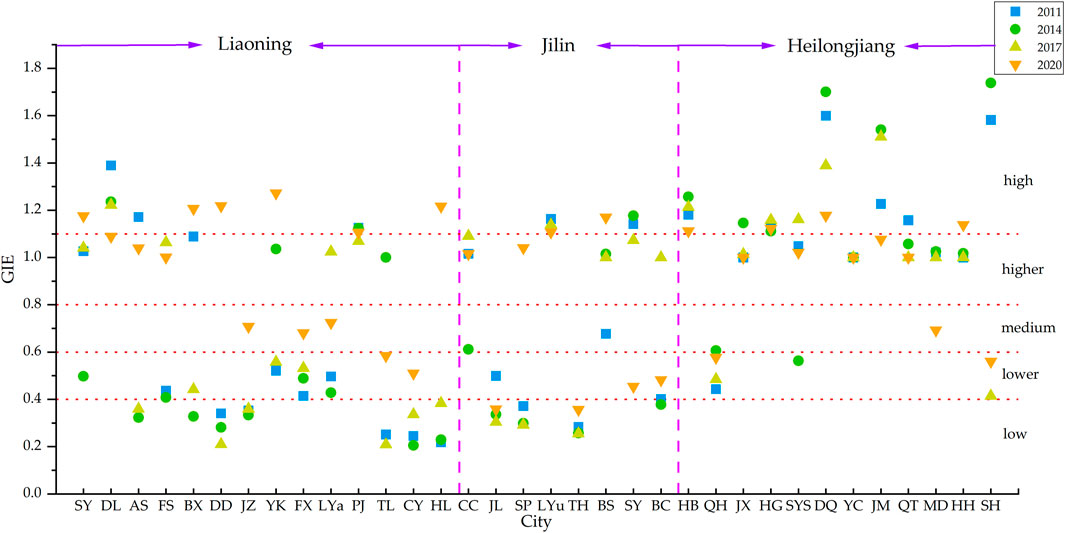
FIGURE 4. The scatterplot of green innovation efficiency of 34 cities in Northeast China.
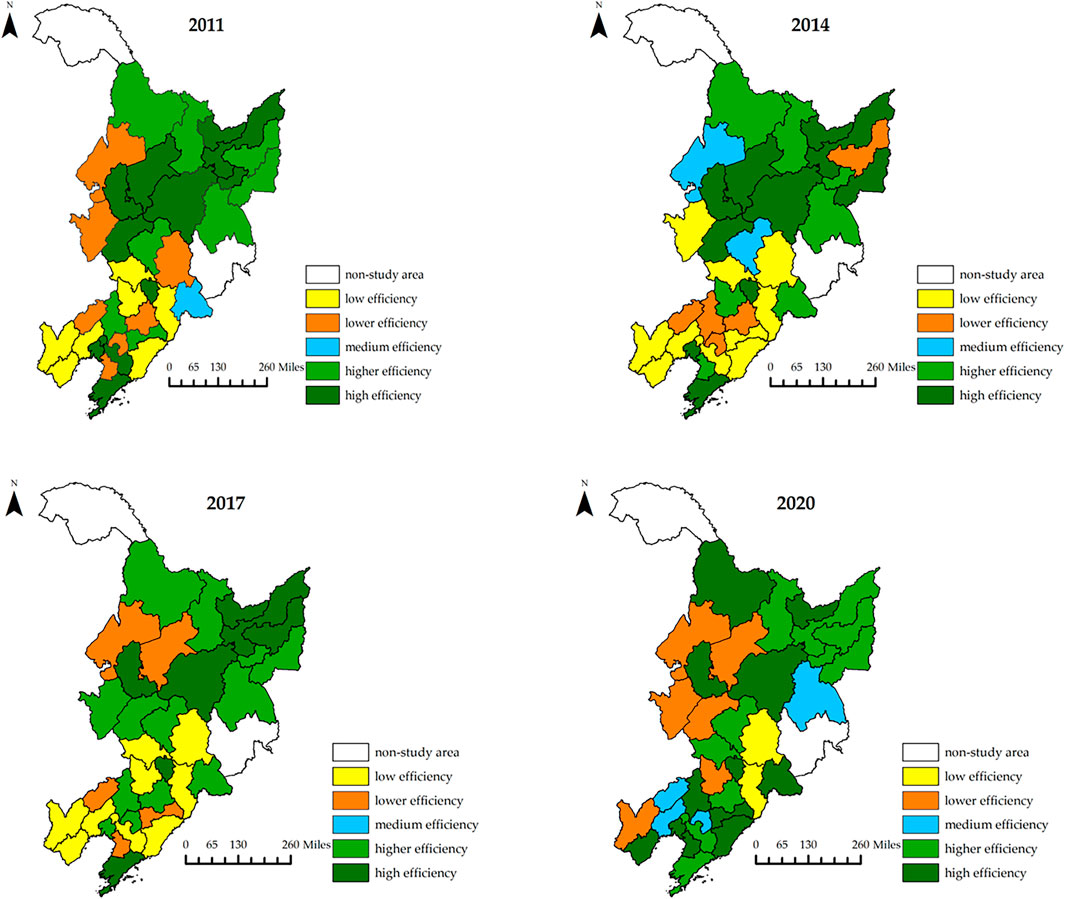
FIGURE 5. The spatial distribution pattern map of green innovation efficiency of 34 cities in Northeast China.
Figures 4, 5 show that in 2011, the green innovation efficiency of cities in Northeast China showed a clear distribution pattern of “ high in the north and low in the south.” Only Qiqihar in Heilongjiang Province was a low-efficiency city; the rest were higher-efficiency and high-efficiency cities. In Jilin Province, Songyuan and Liaoyuan were green innovation high-efficiency cities, Changchun was a high-efficiency city, Baishan was a medium-efficiency city, and the rest were lower-efficiency and low-efficiency cities. In Liaoning Province, the three high-efficiency cities of Dalian, Anshan and Panjin and the two higher-efficiency cities of Benxi and Shenyang form a spatially oriented north-south “belt divider,” and the green innovation efficiency of cities on both sides gradually decreased. By 2014, the overall green innovation efficiency of cities in the Northeast had declined, and the distribution pattern of “high in the north and low in the south” was further strengthened. In Heilongjiang Province, only Shuangyashan City was a lower-efficiency city, and Qiqihar was upgraded to a medium-efficiency city, while the rest were high-efficiency and higher-efficiency cities. In Jilin Province, there was no change in the high-efficiency cities. Baishan had been upgraded from a medium-efficiency city to a higher-efficiency city. Changchun had been downgraded to a medium-efficiency city. In contrast, the rest of the cities remained in the lower and low-efficiency categories. In Liaoning Province, except for Dalian, Panjin, Yingkou and Tieling, which were classified as high-efficiency and higher-efficiency cities, the rest of the cities continued to have low levels of green innovation efficiency. In 2017, the number of cities with high levels of green innovation efficiency declined, but the number of higher-efficiency cities increased. The overall distribution pattern of “high in the north and low in the south” weakened. In Heilongjiang province, the spatial distribution was high in the east and low in the west, except Qiqihar and Suihua, which are lower-efficiency cities; all other cities were high and higher-efficiency cities. In Jilin province, only Jilin, Siping and Tonghua were low-efficiency cities for green innovation. There was also an increase in the number of higher-efficiency cities in Liaoning province, such as Fushun and Liaoyang, which were spatially distributed in a North–South connected pattern. In 2020, the spatial distribution of urban green innovation efficiency in Northeast China was mainly characterized by one high-efficiency cluster in the north and one in the south, while the rest of the low and less-efficient cities are evenly distributed. In Heilongjiang Province, Shuangyashan and Kiamuze dropped from high-efficiency to higher-efficiency cities. At the same time, Heihe rose from higher-efficiency to high-efficiency cities, continuing the same spatial distribution structure of high in the east and low in the west as in 2017. In Jilin Province, the spatial distribution pattern of high and low cities was the same, with Song Yuan and Baicheng dropping to low-efficiency cities and Siping changing from low to higher-efficiency cities. In Liaoning province, the green innovation efficiency of cities had increased significantly, with only Tieling and Chaoyang remaining less efficient cities, changing from a distribution pattern of high in the middle and low on the sides to a distribution pattern of high in the south and low in the north. From the above analysis, it can be seen that the spatial distribution pattern of urban green innovation efficiency in Northeast China has been in a state of change. At the beginning of the study, the overall distribution pattern of “strong in the north and weak in the south” was presented. As time goes on, the gap between the north and the south gradually decreases, some high-efficiency areas slowly migrate from north to south, the number of cities in low-efficiency areas gradually decreases, and the green innovation efficiency between cities tends to be balanced.
Based on the measurement results of the Super-SBM model, this paper uses ArcGIS10.4 metric geographic distribution module (standard deviation ellipse) and selects 1_STANDARD_DEVIATION regarding (Xu et al., 2020). to explore the spatial dynamic evolution law of urban green innovation efficiency in Northeast China (Jiao et al., 2022). As shown in Figure 6, the green innovation efficiency of cities in Northeast China from 2011 to 2020 was generally distributed in the direction of “ northeast-southwest,” with the centre of gravity of efficiency moving between 125.599°E−126.576°E, 43.702°N–44.766°N, mainly distributed in Changchun City, Jilin Province. Taking 2013, 2016 and 2017 as the nodes, the centre of gravity shifted significantly towards the Northeast from 2011–2013, southwest from 2013–2016, Northeast from 2016–2017 and southwest again from 2017–2020. From the gravity centre migration distance, the longest migration distance was 61.08 km in 2018, and the shortest was 10.972 km in 2020. In particular, the distance moving west was 1.7 times the distance moving east, and the distance moving south was 2.3 times the distance moving north (Figure 7), indicating that the efficiency of urban green innovation in the southwest of Northeast China was gradually improving. During the study period, the ellipse area of green innovation efficiency in Northeast China showed an “M-shaped” trend, with the standard deviation of the long axis always larger than that of the short axis (Figure 7). Among them, the standard deviation of the long axis fluctuated from 535.57 km in 2011 to 548.66 km in 2020. The standard deviation of the short axis decreased from 214.53 km in 2011 to 209.62 km in 2020, indicating that the spatial distribution pattern of urban green innovation efficiency in Northeast China was expanding in the north-south direction and shrinking in the east-west direction.
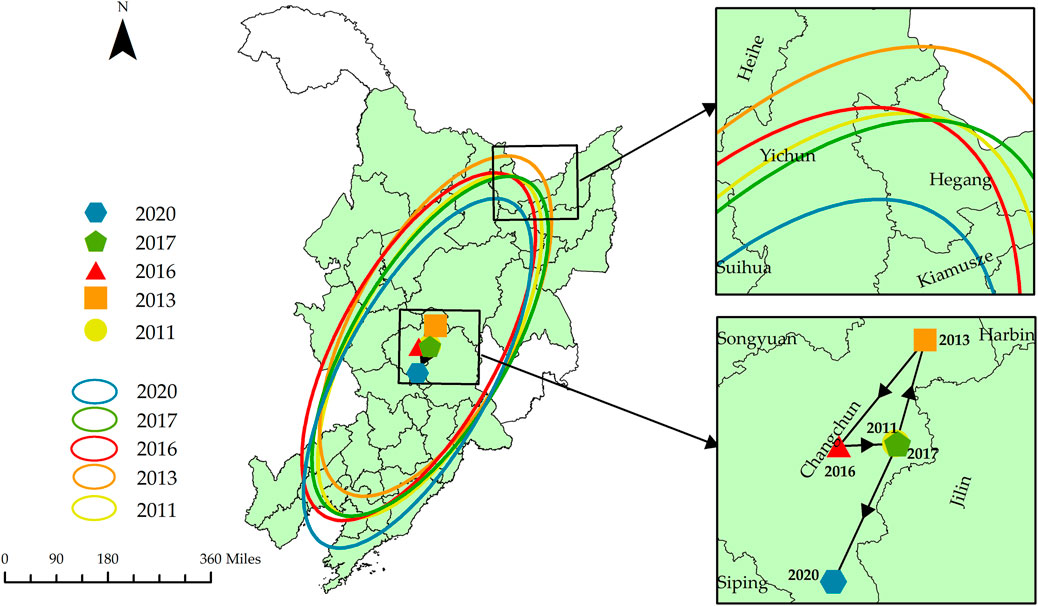
FIGURE 6. The standard deviation ellipse and centre of gravity shift trajectory of urban green innovation efficiency in Northeast China from 2011 to 2020.
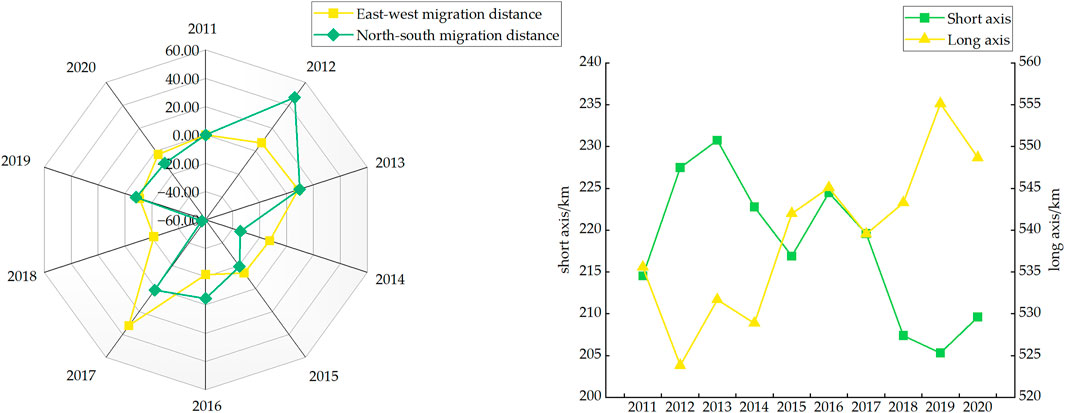
FIGURE 7. The moving distance of the standard deviation ellipse centre of gravity and the changes of long and short axes of urban green innovation efficiency in Northeast China from 2011 to 2020:
In terms of provinces (Figure 8), the cities spatially distributed inside the standard deviation ellipse were the three major provincial capitals and their surrounding cities, namely Harbin, Changchun and Shenyang, which dominated the green innovation efficiency of cities in the northeast region. Specifically, the standard deviation ellipse of green innovation efficiency of cities in Heilongjiang Province was close to positive distribution. The centre of gravity of the standard deviation ellipse was mainly distributed within Yichun City, which generally moved to the Northeast. The standard deviation of both long and short axes showed an increasing trend, indicating that the agglomeration of urban green innovation efficiency in Heilongjiang Province was reduced. The green innovation efficiency between cities was gradually developing in a balanced way. Heilongjiang Province has recently attached importance to green development and actively carried out green innovation activities. The green innovation efficiency values of cities in the province are generally high, so its standard deviation ellipse covers nearly all cities in Heilongjiang Province. The standard deviation ellipse of green innovation efficiency of Jilin cities was distributed in the direction of “southeast-northwest.” The centre of gravity of the standard deviation ellipse was mainly distributed within Changchun and Siping, which generally moved to the southeast. The standard deviation of both long and short axes showed a slight increase. During the study period, the overall green innovation efficiency of cities in Jilin province was low, and there was no significant change in its spatial distribution pattern. The cities within the standard deviation ellipse were mainly Changchun City, which was relatively economically developed and spread to its surrounding cities. The standard deviation ellipse of urban green innovation efficiency in Liaoning Province was distributed in the “ northeast-southwest ” direction. The centre of gravity was mainly distributed in two cities, Liaoyang and Anshan, and generally shifted in the northwest direction, with the standard deviation of the long axis waved down. The standard deviation of the short axis waved up, indicating that the spatial clustering of urban green innovation efficiency in Liaoning Province in the northeast-southwest direction has weakened, and the intra-regional differences have narrowed. At the early stage of the study, as the Liaoning coastal economic zone represented by Dalian and Panjin became an essential national development strategy, the green innovation efficiency of the region was significantly improved. Thus, the centre of gravity of the standard deviation ellipse shifted to the southwest (Liaoning coastal economy). In the middle and late stages of the study, the Shenyang Economic Zone, represented by Shenyang and Anshan, began to focus on green transformation development and increased the investment of green innovation resources, which led to a significant improvement in the green innovation efficiency of the region. The centre of gravity of the standard deviation ellipse shifted from the southwest to the northeast direction.
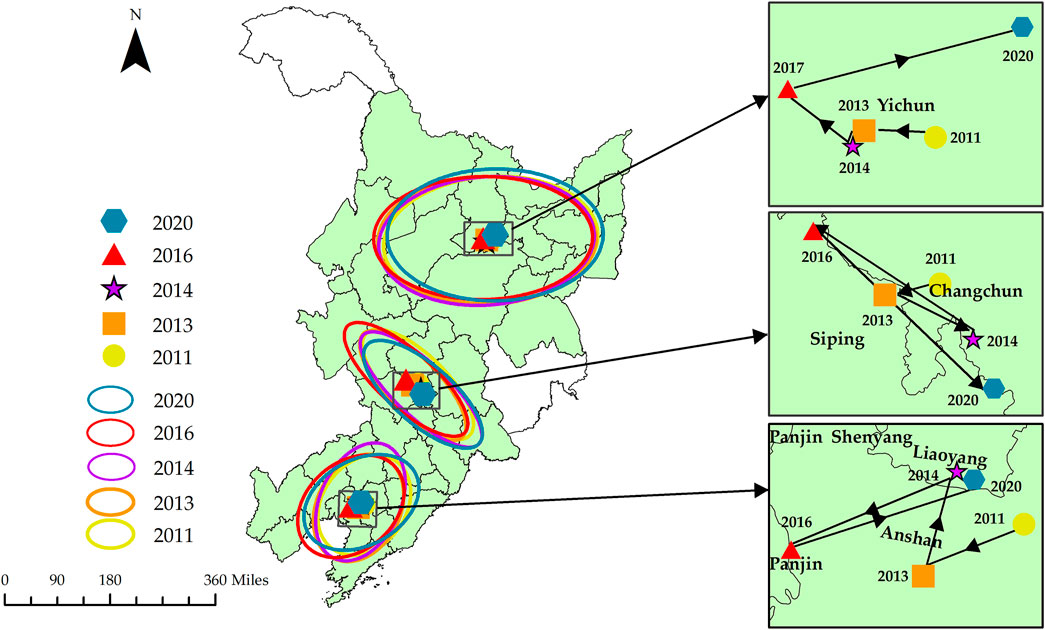
FIGURE 8. The standard deviation ellipse and centre of gravity trajectory of urban green innovation efficiency in the three provinces of Northeast China from 2011 to 2020.
In order to gain a deeper understanding of the regional differences and sources of green innovation efficiency in Northeast China, this paper uses the Dagum Gini coefficient decomposition method to decompose the green innovation efficiency of 34 cities in Northeast China from 2011 to 2020 and the results are shown in Table 3.

TABLE 3. Gini coefficient and decomposition results of green Innovation efficiency in Northeast cities.
During the study period, the overall Gini coefficient of green innovation efficiency of cities in Northeast China showed an “M”-shaped fluctuation, decreasing from 0.278 in 2011 to 0.168 in 2020, indicating the differences in green innovation efficiency among cities in Northeast China were gradually decreasing. The trend of intra-provincial variation
In order to further reveal the regional differences in the development path of urban green innovation in Northeast China, based on the comprehensive evaluation of urban green innovation efficiency (GIE) and green innovation total factor productivity (GML), according to the mean of GIE and GML, this paper further classifies cities into four types, including high efficiency-high growth rate (H-H), high efficiency-low growth rate (H-L), low efficiency-high growth rate (L-H) and low efficiency-low growth rate (L-L).
As shown in Figure 9, there are 11 cities in the “H-H” type, such as Panjin, Songyuan, Liaoyuan, Qitaihe, Suihua, Jixi, Mudanjiang, Heihe, Yichun, Kiamuze and Daqing. Except for Suihua and Kiamuze, the rest are resource-based cities, and most of them are declining or mature resource-based cities. The five cities in the “L-H” category are Benxi, Fuxin, Jilin, Tonghua and Baicheng. The above cities are all old industrial cities and are still in the primary stage of green transformation. Due to the long-term extensive development, their green innovation efficiency is relatively low. Therefore, when more green innovation resources are gradually invested, the improvement of their green innovation efficiency is more pronounced. The 11 cities in the “L-L” category are Tieling, Chaoyang, Jinzhou, Liaoyang, Fushun, Anshan, Yingkou, Dandong, Huludao, Siping and Tsitsihar, all of which are old industrial cities except Dandong. The seven cities in the “H-L” category are Shenyang, Dalian, Changchun, Harbin, Hegang, Shuangyashan and Baishan. Among them, Shenyang, Changchun and Harbin are provincial capitals, and Dalian is a sub-provincial city. These four cities have a solid economic foundation and obvious location advantages. They are the “leaders” in urban green innovation. Hegang, Shuangyashan and Baishan all belong to declining resource cities.
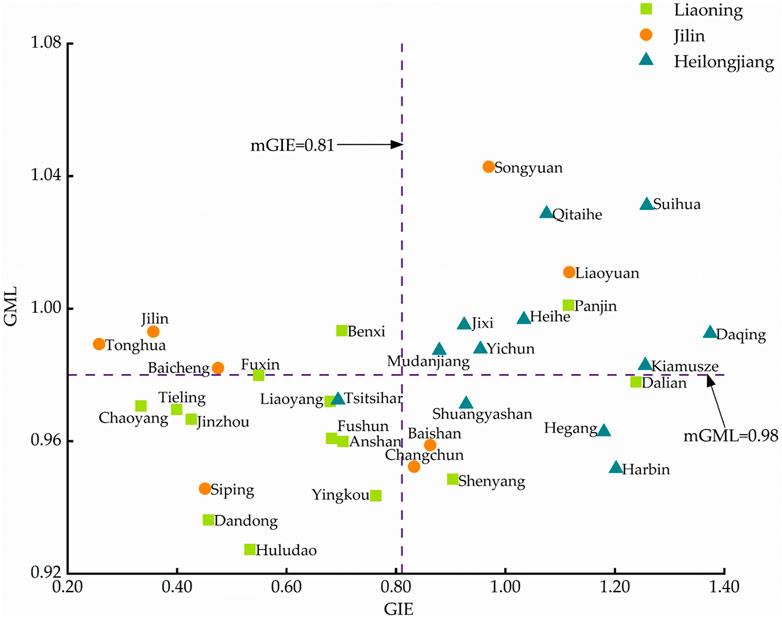
FIGURE 9. Classification of urban green innovation efficiency in Northeast China.
Improving green innovation efficiency is essential to promote the transformation of China’s economic development to a high-quality green model. Several scholars have explored the spatial and temporal evolution of green innovation efficiency and its influencing factors at the industry, provincial and city levels (Wang et al., 2017; Zhu et al., 2021; Wang and Ren, 2022; Zhou and Du, 2021). On this basis, this paper uses the Super-SBM and GML index models to evaluate the efficiency of urban green innovation in Northeast China from the perspective of static efficiency and dynamic productivity, enriching and expanding the relevant research content.
First, at the regional level, the research results showed that the static efficiency of green innovation in Northeast China exhibited a good upward trend from 2011 to 2020, while the total factor productivity of green innovation showed a fluctuating downward trend, similar to the results of Long et al. (2019). Since China proposed the five major development concepts of “innovation, coordination, green, openness, and sharing,” the northeast region has gradually attached importance to green development, stimulating the city’s green innovation and development momentum. Cities in Northeast China are promoting the economy to green and high-quality development.
Secondly, at the provincial level, the study found that the green innovation development of cities in Northeast China showed significant spatial heterogeneity. Inter-provincial differences are the main reason for the overall spatial differences. In recent years, Heilongjiang Province has actively carried out green innovation activities. They put forward a series of sustainable development strategies, such as promoting “eight economic zones” and “10 major projects,” so its green innovation efficiency is obviously in a leading position. The green innovation efficiency of Liaoning Province had the most significant change range. The overall green innovation investment in Liaoning Province was in an “inverted U-shape” from 2011 to 2017. Since 2014, the scientific and technological personnel and expenditure of science and technology in Liaoning Province have shown a decreasing trend year by year. In addition, the average urban energy consumption and industrial waste emissions were significantly higher than those of the other two provinces, resulting in the urban green innovation efficiency of Liaoning Province being lower than the overall average of Northeast China. By 2018, Liaoning Province increased investment in green innovation and controlled environmental pollution to a certain extent, so its green innovation efficiency had achieved rapid improvement. The green innovation efficiency in Jilin province was always lower than the overall average, and the green innovation dynamics were still insufficient compared to the other two provinces. The results differ from those of (Yang and Zhu, 2022; Zhao et al., 2023), which the differences in research methods, research areas and evaluation indicators may cause.
At the city level, the results of the city efficiency classification in Section 4.2.4. showed that most of the cities belonging to the “H-H” type are declining or mature resource cities. Suihua and Kiamuze attach importance to ecological development and have better environmental protection and fewer pollutant emissions, so their green innovation level is high. Mudanjiang, Heihe, Daqing and Jixi are recessionary resource cities. These cities tend to deplete their resources and are accelerating the transformation of their economic development and taking the path of green development under the constraint of environmental resources, which has achieved initial results. Liaoyuan, Hegang and Yichun are mature resource cities. These cities have more stable resource development and are committed to developing a green economy, so their green innovation efficiency and growth rates have always remained high. Panjin, as a regenerative resource city, has given full play to the role of the environmental protection push-back mechanism and actively promoted industrial transformation. It still has tremendous development potential in the future. Most of the “L-H” and “L-L” were old industrial cities. Since implementing the policy to revitalize the old industrial bases in Northeast China, although these cities have actively adjusted and optimized their industrial structures, the results have not been satisfactory. For example, Fushun is actively building a new materials industry base and vigorously developing advanced equipment manufacturing to mitigate the impact of heavy industries such as petrochemicals and metallurgy on the overall economy, but petrochemicals and metallurgy still accounted for 76.1% of the industry in 2019. In addition, low resource allocation capacity and environmental governance deficiencies further inhibit green innovation efficiency. The four cities in the “H-L” category, Shenyang, Dalian, Changchun and Harbin, have a solid economic foundation and obvious location advantages. They are the “leaders” in urban green innovation, and their resource allocation and technological innovation levels have reached a reasonably high level. It is more difficult to improve further. There may even be a slight decline and more of a technological spillover effect to promote the technical development of the surrounding backward areas. Hegang, Shuangyashan and Baishan all belong to declining resource cities. Under the constraints of resources and environment, their industrial structure is increasingly diversified, their ability to use resources is gradually improved, and the development momentum of green innovation is good. However, the lack of environmental governance and high-quality green development still restricts the further improvement of their green innovation level.
This paper constructs an evaluation system of urban green innovation efficiency from system input and output perspectives. The Super-SBM model with undesired output and the Global Malmquist-Luenberger model is used to measure the green innovation efficiency and green innovation total factor productivity of 34 prefecture-level cities in Northeast China from 2011 to 2020. The temporal development characteristics of urban green innovation efficiency in Northeast China are analyzed based on the measurement results. The natural breaking point classification method, standard deviation ellipse model and Dagum Gini coefficient are used to explore the spatial evolution characteristics of urban green innovation efficiency in Northeast China. Then, the development level of urban green innovation is classified. The conclusions are as follows:
(1) From the perspective of the overall regional level, the static efficiency of urban green innovation (GIE) in Northeast China from 2011 to 2020 showed a promising upward trend. However, there was still much room for improvement. Green innovation total factor productivity (GML) showed a significant downward trend during the research period. Technological efficiency and technological progress jointly hindered the improvement of green innovation efficiency, and technological progress was the main reason. Regarding spatial characteristics, the green innovation efficiency of cities in Northeast China showed a distribution pattern of “strong in the north and weak in the south.” The efficiency centre of gravity generally moved to the southwest, and the green innovation efficiency among cities gradually tended to be balanced.
(2) From the provincial level, in terms of time series characteristics, the efficiency of green innovation in Heilongjiang Province fluctuated, but the overall level of green innovation was the highest. Liaoning Province had the most significant increase in green innovation efficiency and rapid green development momentum. The efficiency of green innovation in Jilin Province also showed an upward trend, but it was always lower than the average level in Northeast China. Regarding spatial characteristics, the difference in green innovation efficiency between cities in Jilin Province was the largest, with the centre of gravity of efficiency mainly within Changchun and Siping, generally moving in a southeastern direction. In Liaoning province, the differences between cities were the second highest, with the centre of gravity of efficiency mainly located in Liaoyang and Anshan. The standard deviation ellipse was distributed in a “northeast-southwest” direction. Heilongjiang has less intra-city variation and generally higher levels of green innovation, so it had a greater inter-regional variation than Liaoning and Jilin provinces. Inter-provincial differences are the main reason for the overall spatial differences.
(3) From the perspective of the city level, in terms of time series characteristics, there were 17 cities with an upward trend in the static efficiency of green innovation, two cities with no significant change and 15 with a downward trend during the study period. In terms of spatial characteristics, there were 11 cities belonging to the “H-H″ type of green innovation efficiency, mainly clustered in Heilongjiang province. The “H-L″ type included five old industrial cities: Benxi, Fuxin, Jilin, Tonghua and Baicheng. There were 11 cities of the “L-L″ type, mainly in Liaoning province. The “H-L” cities included the four core cities of Shenyang, Dalian, Changchun and Harbin, as well as three declining resource cities
(1) Improving the ability to allocate green innovation resources and accelerating the green transformation and upgrading of industrial structures. Although the efficiency of urban green innovation in Northeast China is on the rise, the long-term extensive economic development model has caused the efficiency of green innovation in most cities to remain ineffective. Therefore, relevant departments should fully play the traditional advantages of the old industrial bases in Northeast China and accelerate the optimization and upgrading of the industrial structure. On the one hand, they should promote the green transformation and upgrading of traditional heavy industries such as iron and steel, petroleum and chemical industries in Northeast China. On the other hand, they should lay out green new industries such as fine chemicals, high-end equipment manufacturing and biomedicine according to local conditions and actively promote industrial clusters. In addition, they should vigorously develop the tertiary industry, optimize the energy structure, improve the utilization rate of clean energy, advocate the application of green recycling industrial technology, and improve the competitiveness of green innovation in Northeast cities.
(2) Clarify the main body of green innovation and optimize the green innovation environment. As the central unit of green innovation, enterprises should pay attention to the construction and cultivation of talent teams, accurately introduce the scarce talents, and continuously improve innovative talents’ management and cultivation system. Meanwhile, they should conduct research and development activities for new products and technologies while also paying attention to the full use of existing technologies. Technological progress plays a more significant role in improving the efficiency of urban green innovation in Northeast China. On the one hand, the government should fully implement the concept of green development, formulate relevant regulations and policies and correctly play the guiding and leading role of environmental regulations for enterprises to carry out green innovation activities. On the other hand, they should adopt more effective management tools to fully mobilize the enthusiasm of enterprises for green innovation, encourage enterprises to innovate independently, and give corresponding policy support and tax relief to enterprises developing new green products, so as to provide a more favorable environment for enterprises to carry out green innovation activities.
(3) Formulating differentiated green development strategies and striving to promote the synergistic development of green innovation among cities. The empirical results show that the level of green innovation development in cities in the Northeast has apparent spatial heterogeneity. So, cities should strive to break down regional barriers and gradually narrow the differences in green innovation efficiency between cities by formulating differentiated green development strategies. It is mainly developed from two aspects.
The first is to clarify the directional issues of urban development from the relationship between green innovation efficiency and green innovation total factor productivity. Panjin, Songyuan and Qitaihe are high green innovation efficiency and green innovation total factor productivity cities. They should continue optimizing their industrial structure and strive to build a diversified green industrial system while maintaining green development advantages. Cities with low efficiency and high factor productivity, such as Fuxin and Jilin, should continue to improve their resource allocation capabilities, gradually abandon traditional industrial industries with high pollution and high inputs, and transform their resource advantages into a powerhouse of green economic growth. Cities with high efficiency and low factor productivity, such as Shenyang, Changchun and Dalian, should continuously enrich their green innovation management concepts and focus on conquering key green innovation technologies. Besides, they should strengthen the flow of green innovation resources between cities to improve the level of green innovation diffusion continuously. Cities with low efficiency and low factor productivity, such as Tieling and Siping, should strengthen green innovation technology cooperation with neighbouring cities and strive to achieve synergistic development of green innovation. At the same time, they should increase the investment in green innovation resources and improve the efficiency of resource allocation.
The second is to solve the contradiction between traditional industries and urban economic development from different resource-based cities. For example, petroleum-based resource cities like Panjin and Daqing should clarify their urban development positioning as soon as possible, optimize the structure of the petrochemical and fine chemical industries, and continuously promote the green and coordinated development of the whole petrochemical industry chain. For coal resource-based cities such as Jixi and Hegang, they should increase technology research and development, promote waste recycling, and build a diversified and sustainable industrial system with the coal and chemical industry as the pillar. For iron and steel resource-based cities such as Anshan, they should vigorously promote green manufacturing, achieve comprehensive coverage of environmental protection and energy-saving technologies, give full play to the green and low-carbon advantages of the short process, and strive to build a national first-class level of green iron and steel enterprises.
Theoretical implications: based on the theoretical basis of the connotation of green innovation, we choose scientific and reasonable input-output evaluation indicators, take the northeast region as the research subject, and study the spatial and temporal evolution differences of green innovation efficiency from the urban level. This paper further enriches and expands the research perspective of green innovation and realizes the effective combination of spatial geography and regional economics.
Practical implications: green innovation is essential for high-quality economic development. Measuring the green innovation efficiency of cities in Northeast China and exploring its spatial and temporal evolution characteristics can clarify the current status of green innovation development in each city and the competition degree of green innovation resources among cities. This study can provide scientific reference for enterprises, government and relevant departments to reasonably formulate green innovation development policies and promote the coordinated development of urban green innovation in Northeast China.
The evaluation indexes of green innovation efficiency are not yet unified in academia. Although this paper has fully considered green innovation’s economic, social and environmental benefits, the selected input-output indicators may still have certain limitations. Therefore, in future research, we will continue exploring a more comprehensive and scientific evaluation system to measure green innovation efficiency more accurately. In addition, we will deeply analyze the factors affecting the changes in green innovation efficiency in cities in Northeast China and further explore its spatial-temporal evolutionary dynamics mechanism, which is also a key element of future research.
Publicly available datasets were analyzed in this study. These data can be found here: http://www.stats.gov.cn., https://www.cnrds.com, https://data.cnki.net/.
Conceptualization, DF; methodology, XW; software, XW; validation, DF and XW; writing-original draft, XW; writing–review and editing supervision, DF; formal analysis, DF and XW. All authors contributed to the article and approved the submitted version.
This research was funded by the Key Project of National Social Science Foundation of China (grant; 19AGL007) and the Research Planning Project of Philosophy and Social Science of Heilongjiang Province (grant; 18GLD291).
The authors declare that the research was conducted in the absence of any commercial or financial relationships that could be construed as a potential conflict of interest.
All claims expressed in this article are solely those of the authors and do not necessarily represent those of their affiliated organizations, or those of the publisher, the editors and the reviewers. Any product that may be evaluated in this article, or claim that may be made by its manufacturer, is not guaranteed or endorsed by the publisher.
Aigner, D. J., Lovell, C. A. K., and Schmidt, P. (1977). Formulation and estimation of stochastic frontier production function models. J. Econ. 6 (1), 21–37. doi:10.1016/0304-4076(77)90052-5
Beise, M., and Rennings, K. (2005). Lead markets and regulation: A framework for analyzing the international diffusion of environmental innovations. Ecol. Econ. 52 (1), 5–17. doi:10.1016/j.ecolecon.2004.06.007
Charnes, A., Cooper, W. W., and Rhodes, E. (1978). Measuring the efficiency of decision making units. Eur. J. Oper. Res. 2 (6), 429–444. doi:10.1016/0377-2217(78)90138-8
Chen, W. (2020). 2019 China green city index top 50 released: Has your city gone green? Environ. Econ. 1, 68–71. CNKI:SUN:HJJI.0.2020-Z1-018.
Chung, Y. H., Fa¨re, R., and Grosskopf, S. (1997). Productivity and undesirable outputs: A directional distance function approach. J. Environ. Manage. 51 (3), 229–240. doi:10.1006/jema.1997.0146
CISTDS (2022). 2021 China urban science and technology innovation development report. Available at: http://www.cistds.org/content/details36_1442.html.
Cuerva, M. C., Triguero-Cano, Á., and Córcoles, D. (2014). Drivers of green and non-green innovation: Empirical evidence in low-tech SMEs. J. Clean. Prod. 68, 104–113. doi:10.1016/j.jclepro.2013.10.049
Deng, Q. Z., Zhou, S. Z., and Peng, F. (2020). Measuring green innovation efficiency for China’s high-tech manufacturing industry: A network DEA approach. Math. Probl. Eng. 2020, 1–13. doi:10.1155/2020/8902416
Du, J. L., Liu, Y., and Diao, W. X. (2019). Assessing regional differences in green innovation efficiency of industrial enterprises in China. Int. J. Environ. Res. Public Health 16 (6), 940. doi:10.3390/ijerph16060940
Fankhauser, S., Bowen, A., Calel, R., Dechezleprêtre, A., Grover, D., Rydge, J., et al. (2013). Who will win the green race? In search of environmental competitiveness and innovation. Glob. Environ. Change 23 (5), 902–913. doi:10.1016/j.gloenvcha.2013.05.007
Fei, F., Huan, L., Liu, X. Y., and Wang, X. L. (2021). Can environmental regulation promote urban green innovation efficiency? An empirical study based on Chinese cities. J. Clean. Prod. 287, 125060. doi:10.1016/j.jclepro.2020.125060
Foxon, T., and Pearson, P. (2008). Overcoming barriers to innovation and diffusion of cleaner technologies: Some features of a sustainable innovation policy regime. J. Clean. Prod. 16 (1), S148–S161. doi:10.1016/j.jclepro.2007.10.011
Gao, K., Wang, L., Liu, T. T., and Zhao, H. Q. (2022). Management executive power and corporate green innovation—empirical evidence from China's state-owned manufacturing sector. Technol. Soc. 70, 102043. doi:10.1016/j.techsoc.2022.102043
Guo, H., Xie, Z., and Wu, R. (2021). Evaluating green innovation efficiency and its socioeconomic factors using a slack-based measure with environmental undesirable outputs. Int. J. Environ. Res. Public Health 18 (24), 12880. doi:10.3390/ijerph182412880
Hashimoto, A., and Haneda, S. (2008). Measuring the change in R&D efficiency of the Japanese pharmaceutical industry. Res. Pol. 37 (10), 1829–1836. doi:10.1016/j.respol.2008.08.004
Henriques, I., and Sharma, S. (2005). Pathways of stakeholder influence in the Canadian forestry industry. Bus. Strategy. Environ. 14 (6), 384–398. doi:10.1002/bse.456
Hu, B., Yuan, K., Niu, T. Y., Zhang, L., and Guan, Y. Q. (2022). Study on the spatial and temporal evolution patterns of green innovation efficiency and driving factors in three major urban agglomerations in China—based on the perspective of economic geography. Sustainability 14 (15). doi:10.3390/su14159239
Jiao, S., Wu, S. S., Han, Z. W., and Peng, K. (2022). Spatial-temporal evolution and correlation mechanism of industry agglomeration and water pollution degree in“One lake and four rivers”basins of hunan. Econ. Geogr. 42 (04), 132–140. doi:10.15957/j.cnki.jjdl.2022.04.015
Li, D., and Zeng, T. (2020). Are China’s intensive pollution industries greening? An analysis based on green innovation efficiency. J. Clean. Prod. 259, 120901. doi:10.1016/j.jclepro.2020.120901
Li, T. C., Liang, L., and Han, D. R. (2018). Research on the efficiency of green technology innovation in China’s provincial high-end manufacturing industry based on the Raga-PP-SFA model. Math. Probl. Eng. 2018, 1–13. doi:10.1155/2018/9463707
Lin, C. P., and Tseng, J. M. (2012). Green technology for improving process manufacturing design and storage management of organic peroxide. Chem. Eng. J. 180, 284–292. doi:10.1016/j.cej.2011.11.059
Lin, S. F., Xiao, L., and Wang, X. J. (2021). Does air pollution hinder technological innovation in China? A perspective of innovation value chain. J. Clean. Prod. 278, 123326. doi:10.1016/j.jclepro.2020.123326
Liu, C. Y., Gao, X. Y., Ma, W. L., and Chen, X. Y. (2020). Research on regional differences and influencing factors of green technology innovation efficiency of China’s high-tech industry. J. Comput. Appl. Math. 369, 112597. doi:10.1016/j.cam.2019.112597
Liu, K., Xue, Y. T., Chen, Z. F., and Miao, Y. (2023). The spatiotemporal evolution and influencing factors of urban green innovation in China. Sci. Total Environ. 857, 159426. doi:10.1016/j.scitotenv.2022.159426
Long, R. Y., Guo, H. Y., Zheng, D. T., Chang, R. H., Na, S., and Lv, Z. H. (2020). Research on the measurement, evolution, and driving factors of green innovation efficiency in Yangtze River Economic belt: A super-SBM and spatial durbin model. Complexity 2020, 1–14. doi:10.1155/2020/8094247
Long, X. L., Sun, C. W., Wu, C., Chen, B., and Boateng, K. A. (2019). Green innovation efficiency across China’s 30 provinces: Estimate, comparison, and convergence. Mitig. Adapt. Strategies Glob. Change 25 (7), 1243–1260. doi:10.1007/s11027-019-09903-3
Luo, Q. L., Miao, C. L., Sun, L. Y., Meng, X. N., and Duan, M. M. (2019). Efficiency evaluation of green technology innovation of China's strategic emerging industries: An empirical analysis based on Malmquist-data envelopment analysis index. J. Clean. Prod. 238, 117782. doi:10.1016/j.jclepro.2019.117782
Miao, C. L., Fang, D. B., Sun, L. Y., and Luo, Q. L. (2017). Natural resources utilization efficiency under the influence of green technological innovation. Resour. Conserv. Recycl 126, 153–161. doi:10.1016/j.resconrec.2017.07.019
Oh, D. (2010). A global Malmquist-Luenberger productivity index. J. Prod. Anal. 34 (3), 183–197. doi:10.2307/41770926
Sáez, L., Heras-Saizarbitoria, I., and Rodríguez-Núñez, E. (2020). Sustainable city rankings, benchmarking and indexes: Looking into the black box. Sustain. Cities. Soc. 53, 101938. doi:10.1016/j.scs.2019.101938
Shan, F., Kong, Y. W., Liu, S. G., and Zhou, H. W. (2022). Study on the spatio-temporal evolution and influential factors of green innovation efficiency in urban agglomerations of China. Sustainability 15 (1). doi:10.3390/su15010676
Shao, S., Luan, R. R., Yang, Z. B., and Li, C. Y. (2016). Does directed technological change get greener: Empirical evidence from Shanghai's industrial green development transformation. Ecol. Indic. 69, 758–770. doi:10.1016/j.ecolind.2016.04.050
Song, W. F., and Han, X. F. (2022). The bilateral effects of foreign direct investment on green innovation efficiency: Evidence from 30 Chinese provinces. Energy 261, 125332. doi:10.1016/j.energy.2022.125332
Tao, X. P., Wang, P., and Zhu, B. Z. (2016). Provincial green economic efficiency of China: A non-separable input–output SBM approach. Appl. Energy 171, 58–66. doi:10.1016/j.apenergy.2016.02.133
Tone, K. (2001). A slacks-based measure of super-efficiency in dataenvelopment analysis. Eur. J. Oper. Res. 130 (3), 498–509. doi:10.1016/S0377-2217(01)00324-1
Wang, K. L., Zhang, F. Q., Xu, R. Y., Miao, Z., Cheng, Y. H., and Sun, H. P. (2023). Spatiotemporal pattern evolution and influencing factors of green innovation efficiency: A China’s city level analysis. Ecol. Indic. 146, 109901. doi:10.1016/j.ecolind.2023.109901
Wang, Q., and Ren, S. M. (2022). Evaluation of green technology innovation efficiency in a regional context: A dynamic network slacks-based measuring approach. Technol. Forecast. Soc. Change 182, 121836. doi:10.1016/j.techfore.2022.121836
Wang, W. X., Yu, B., Yan, X., Yao, X. L., and Liu, Y. (2017). Estimation of innovation’s green performance: A range-adjusted measure approach to assess the unified efficiency of China’s manufacturing industry. J. Clean. Prod. 149, 919–924. doi:10.1016/j.jclepro.2017.02.174
Wang, X., Su, Z., and Zhao, W. N. (2022). Regional difference, dynamic evolution and convergence analysis of green innovation efficiency in the Yellow River Basin. Urban Probl. 329 (12), 30–41. doi:10.13239/j.bjsshkxy.cswt.221205
Xu, S. J., Wang, F. Y., and Wang, K. Y. (2021). Evaluation and optimization analysis of high-speed rail network structure in Northeast China under the background of northeast revitalization. Reg. Sustain. 2 (4), 349–362. doi:10.1016/j.regsus.2022.01.006
Xu, S. R., Wu, T., and Zhang, Y. (2020). The spatial-temporal variation and convergence of green innovation efficiency in the Yangtze River Economic Belt in China. Environ. Sci. Pollut. Res. Int. 27 (21), 26868–26881. doi:10.1007/s11356-020-08865-3
Yang, H. C., and Zhu, X. (2022). Research on green innovation performance of manufacturing industry and its improvement path in China. Sustainability 14 (13), 8000. doi:10.3390/su14138000
Yang, T., Zhou, K. L., and Zhang, C. (2022). Spatiotemporal patterns and influencing factors of green development efficiency in China's urban agglomerations. Sustain. Cities. Soc. 85, 104069. doi:10.1016/j.scs.2022.104069
Yao, M. C., Duan, J. J., and Wang, Q. S. (2022). Spatial and temporal evolution analysis of industrial green technology innovation efficiency in the Yangtze River economic belt. Int. J. Environ. Res. Public Health 19 (11), 6361. doi:10.3390/ijerph19116361
Zeng, J. Y., Škare, M., and Lafont, J. (2021). The co-integration identification of green innovation efficiency in Yangtze River Delta region. J. Bus. Res. 134, 252–262. doi:10.1016/j.jbusres.2021.04.023
Zhang, R. J., Tai, H. W., Cheng, K. T., Cao, Z. X., Dong, H. Z., and Hou, J. J. (2021). Analysis on evolution characteristics and dynamic mechanism of urban green innovation network: A case study of Yangtze River Economic belt. Sustainability 14 (1). doi:10.3390/su14010297
Zhao, P. Y., Lu, Z. G., Kou, J. L., and Du, J. (2023). Regional differences and convergence of green innovation efficiency in China. J. Environ. Manage. 325, 116618. doi:10.1016/j.jenvman.2022.116618
Zhou, X. X., and Du, J. T. (2021). Does environmental regulation induce improved financial development for green technological innovation in China? J. Environ. Manage. 300, 113685. doi:10.1016/j.jenvman.2021.113685
Zhu, L., Luo, J., Dong, Q. L., Zhao, Y., Wang, Y. Y., and Wang, Y. (2021). Green technology innovation efficiency of energy-intensive industries in China from the perspective of shared resources: Dynamic change and improvement path. Technol. Forecast. Soc. Change 170, 120890. doi:10.1016/j.techfore.2021.120890
Keywords: Northeast China, green innovation efficiency, spatial and temporal evolution, Super-SBM model, global Malmquist-Luenberger index model, standard deviation ellipse
Citation: Wu X and Fan D (2023) Spatial and temporal evolution characteristics of urban green innovation efficiency in Northeast China. Front. Energy Res. 11:1167330. doi: 10.3389/fenrg.2023.1167330
Received: 16 February 2023; Accepted: 18 May 2023;
Published: 30 May 2023.
Edited by:
Jing Shi, University of Cincinnati, United StatesReviewed by:
Baogui Xin, Shandong University of Science and Technology, ChinaCopyright © 2023 Wu and Fan. This is an open-access article distributed under the terms of the Creative Commons Attribution License (CC BY). The use, distribution or reproduction in other forums is permitted, provided the original author(s) and the copyright owner(s) are credited and that the original publication in this journal is cited, in accordance with accepted academic practice. No use, distribution or reproduction is permitted which does not comply with these terms.
*Correspondence: Xiaolin Wu, d3hsNjgwMzIyQGhyYmV1LmVkdS5jbg==
Disclaimer: All claims expressed in this article are solely those of the authors and do not necessarily represent those of their affiliated organizations, or those of the publisher, the editors and the reviewers. Any product that may be evaluated in this article or claim that may be made by its manufacturer is not guaranteed or endorsed by the publisher.
Research integrity at Frontiers
Learn more about the work of our research integrity team to safeguard the quality of each article we publish.