 Peng Xu
 Beibei Wang
- College of Electrical Engineering, Southeast University, Nanjing, China
In 2022, China faced unusually high temperatures, leading to a lack of hydropower in the southwest and increased power demand in the east. This incongruity exerted substantial strain on the power system. To tackle this, a structured method called orderly power utilization (OPU) is suggested as an effective approach to manage short-term power shortages and prevent recurring blackouts. However, typical OPU strategies tend to overlook the principles of fairness, openness, and justice (OEJ), potentially causing problems for various users, especially major industries. Herein, we introduce a comprehensive OPU framework. According to the demand difference in OPU plans in different periods, the optimization cycle is divided into several intervals to achieve computational enhancement. Furthermore, in the interest of judiciously managing the manifold OPU resources characterized by heterogeneous parameters, we introduce an aggregated operational model underpinned by the formalism of zonotopic sets. Numerical simulation results indicate the great potential of the proposed method to solve power shortage problems while upholding the imperatives of OEJ.
1 Introduction
The swift progression of the Chinese economic landscape has yielded a substantial disjunction between power supply and demand, notably pronounced during the acme of power utilization (Gu and Tian, 2023). This incongruity has consequently fostered an enduring trajectory of escalating power shortages. In a formal commitment to the global community, China, in the year 2020, avowed its intent to curtail carbon dioxide emissions, aiming for their zenith by 2030, and concurrently embarked upon an aspirational trajectory toward achieving carbon neutrality by the year 2060 (Zhou and Hu, 2021). In March 2021, future development directions in building a new power system to realize much more renewable energy accommodation were further proposed (Ma, 2021).
In China, the load center and resource center are geographically mismatched. Therefore, the west-to-east power transmission project in China aims to transmit renewable energy (wind, solar, or hydro power) from the west to the east over a long distance to relieve the load in the east, as illustrated in Figure 1. However, intermittency and uncertainty strongly affect the stable operation of the power grid. Long-term regional, seasonal, periodic, and structural power shortages will occur in some regions of China (Chi et al., 2021). In 2022, droughts caused by extremely hot weather have led to hydropower shortages, and consequently insufficient power transmitted to the east. In addition, the east region has faced an increase in total load due to a surge in air conditioning loads. This collective confluence of factors has culminated in a pronounced shortage within the power system, underscoring the ramifications of supply–demand disequilibrium under the prevailing hot climatic conditions.
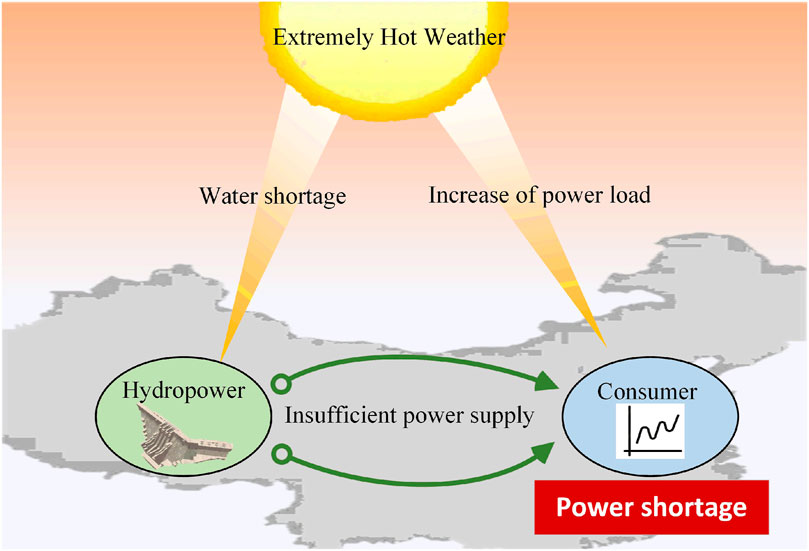
FIGURE 1. Power shortage under the extremely hot weather.
Orderly power utilization (OPU), similar to “firm load shedding” in ERCOT (Chen, 2018), is an important means for power sectors to address severe short-term power shortages so as to avoid cycled blackout events. To ensure electricity availability to residents and important organizations in emergencies, OPU scheduling for a large range of factories and corporations is used to decrease their load. Nonetheless, the conventional regimen governing OPU scheduling is fraught with economic inefficiencies stemming from its inability to discern between distinct factories and corporations based on the unique attributes of their production lines (Fan et al., 2015). Consequently, in instances marked by inadequate power provisioning, an imperative necessitation arises for the expedient formulation of an equitable OPU optimization strategy. Such a strategy assumes heightened significance in its role of preserving the steadfastness of the societal power supply apparatus while simultaneously mitigating the repercussions of power deficits on both the social–economic fabric and the livelihoods of the residents.
OPU has historically functioned as a prescriptive administrative measure, and a scientific and reasonable OPU implementation mechanism has not been formed yet. Scholarly discourse has hitherto delved into the operational mechanics governing OPU implementation within the Chinese context. The regulation value of industry users under OPU has been evaluated by establishing an index system of OPU load in a prior study (Zhang et al., 2019), but the details of user flexibility were not considered. An orderly power consumption regulation strategy has been proposed that determines user priority according to an entropy weight method (Liu et al., 2021); another proposal involves a smart task scheduling strategy of OPU according to priority (Tao et al., 2015).
However, these prior studies have not considered OEJ principles to users in determining the OPU strategies, a practice not in line with China’s current national conditions. OEJ indicates that in a relatively long period of time, indicators such as the number of OPU calls and the amount of power loss of OPU calls made by a certain user group are relatively consistent. Therefore, for the entire contract period, the user’s reduction should be evenly distributed, rather than a sudden and dramatic reduction in a short period of time.
Throughout the entire cycle of the OPU contract, the daily OPU plan is determined day ahead. In order to obtain the OPU plan for the next day, the decision maker needs to forecast the load/generation information for an entire contract period (for example, 1 month or half a year) and finish OPU optimization. Take 1 month as an example, only the OPU plan of the second day will be adopted and other plans that are further away will be only used as a reference and will not be implemented, which is similar to the idea of the model predictive control method (Huang et al., 2023; Yin et al., 2023). Taking the entire contract cycle into account indicates dealing with the complexity of optimization and an increase in variables and the calculation cost, which also presents a challenge in OPU optimization.
In addition to the computational complexity brought about by the optimizing cycle, scheduling large-scale distributed resources also remains a challenge. In OPU optimization, the users also need to upload the flexibility information of their resources, as shown in Figure 2. In addition to traditional interruptible load, the OPU users are equipped with new adjustable devices such as roof photovoltaic panels and energy storage that can provide flexibility to the power grid (Ouyang et al., 2022); Fu et al., 2022). However, the aggregation of large-scale OPU resources is quite difficult because of resource complexity. Existing methods in the recent literature have attempted to compute approximate aggregation models with low mathematical complexity, most of which can be divided into two categories: outer-approximation methods (Xu et al., 2018; Yi et al., 2020) and inner-approximation methods. In inner-approximation methods, three main strategies are used to evaluate flexibility: regulation range assessment (Šikšnys et al., 2015; Ayon et al., 2017), power nodes (Ulbig and Andersson, 2012; Koch and Andersson, 2012), and polytope approximation methods, such as the inner-box approximation (Chen et al., 2020), symmetrical zonotope approximation (Müller et al., 2019, 2015), and polytope-based virtual battery approximation (Wang et al., 2020). In addition, by scaling and translating a basic homothetic polytope, a maximum inner aggregation approach has been formulated (Yi et al., 2021). However, it may work only for resources with similar parameters. Therefore, this study focused on developing a general method to enlarge the aggregate feasible region for resources with various parameters.
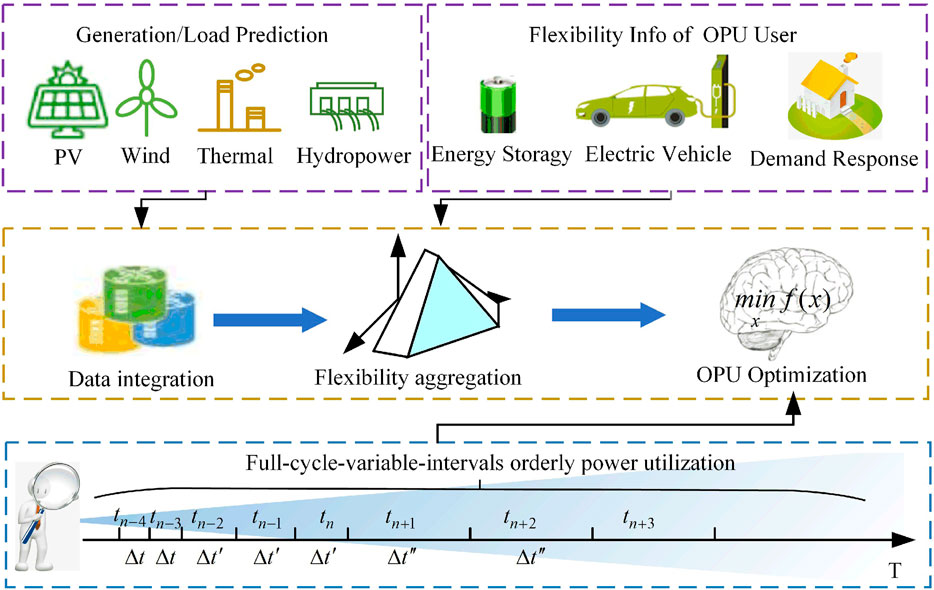
FIGURE 2. Framework schematic for OPU based on the aggregation of flexibility.
Motivated by the previously described challenges, we propose a generalized OPU approach for power and regulation services offered by numerous small-capacity OPU resources. Compared with the existing literature, this study is novel in the following aspects:
1) We propose an optimization model that considers the entire contract period to ensure fairness to OPU users participating in OPU projects. In this model, each OPU user signs a monthly contract with the power company and can accept the power company’s day-ahead load shedding order within the scope of the contract.
2) To improve the efficiency of daily day-ahead OPU decision-making, a full-cycle-variable-interval OPU (FC-VI-OPU) optimization strategy is proposed. By decreasing the accuracy requirements of the model for the future optimization scheme, the solution speed can be improved.
3) A unified OPU resource flexibility aggregation method is proposed. Deriving the general representation form of the zonotope dramatically improves the flexibility loss after large-scale decentralized resource aggregation, and the adjustment potential of the OPU resources is maximized.
The remainder of this article is organized as follows: Section 2 formulates the main OPU problem, in which the objectives and constraints are provided. Section 3 introduces the aggregation method and derives the general form of the zonotope generator. Section 4 presents case studies demonstrating the effectiveness of the proposed algorithm. Section 5 summarizes the conclusions.
2 Problem formulation
In this section, we propose our zonotope-based model for OPU optimization. Different parts of the model, including the objectives and constraints, are described in the following subsections. Figure 2 shows the framework schematic for OPU based on the aggregation of OPU resources. The utility controller first collects information, including the predicted generation, load, and flexibility information uploaded by the user, and then determines whether load shedding is required. If the load exceeds the maximum power generation in certain periods, the user is informed of the OPU order.
2.1 Optimization objectives
When the temporal horizon of planning transitions from days to months, the overarching objective encompassing OEJ undergoes a transformation. This shift entails a departure from the initial aim of harmonizing the day-to-day contractual advancement across individual power plants. Instead, the recalibrated focus converges upon facilitating a scenario wherein each participant within the OPU framework attains a relatively flexible capacity to fulfill the stipulated monthly contractual obligations. When the monthly load shedding forecast deviates from the contract electricity, each user should be able to share the deviated electricity equally. Therefore, from the monthly time range perspective, the goal of OEJ is to minimize the deviation between the monthly planned load shedding and the monthly contract of load shedding.
Herein, the scheduled time is expanded from the next day to the last day of the month.
The difference between scheduled load shedding of user i and contract i will be
The maximum deviation of load shedding is introduced to be
According to OEJ principles, the contract completion of different users should be as close as possible at the end of the month. Therefore, the optimization objective function of a full cycle load shedding plan can be expressed as
2.2 Constraints
In this section, different constraints will be illustrated including the system balance constraint and node voltage constraint.
2.2.1 System balance constraint
The total electricity generation should be equal to the load, expressed as
where pt denotes the power of the user, Pt denotes the generation of the generators, and N1 and N2 are the numbers of the user and generator, respectively.
2.2.2 Node voltage constraint
When the load shedding plan is specified, the node voltage cannot exceed the limit, expressed as
where
2.2.3 Power flow constraint
The power flow constraint describes the balance of the active and reactive power flow in each branch, expressed as
where Z denotes the node set. Pi,t and Qi,t are the net loads of node i, and Pij,t, Qij,t, and Sij,t are the active, reactive, and apparent power of line i − j, respectively. gij and bij are the conductance and susceptance of line i − j, respectively. θij,t denotes the voltage phase difference between nodes i and j.
The quadratic and trigonometric functions included in the power flow equation are non-convex functions. Solving the optimization problems with power flow equations is difficult. Herein, through the second-order cone relaxation method, the power flow constraint is transformed into a linear constraint plus a second-order cone constraint. The nonlinear variable
2.2.4 Maximum load constraint
On the basis of future power generation, the overall load of the distribution network must meet an upper limit constraint. When the predicted load exceeds the upper limit of power generation, OPU and load reduction are required, which is expressed as
2.2.5 OPU model with variable intervals
Using the full-cycle OPU optimization model can meet the OEJ requirements for the scheduling mode, but substantial calculation is required. Take the orderly power consumption plan at the beginning of the month as an example. If there is a period of 1 h, the total number of orderly power consumption plan periods in the entire monthly cycle is 720. The calculation time is too long to meet the calculation requirements for orderly power consumption the day ahead, thus precluding power grid production applications. If the calculation time interval is increased, the calculation time requirements can be met, but the needs for short-term scheduling operation are not met. In the day-ahead OPU optimization calculation under an OEJ scheduling mode, the planning requirements vary among periods. The power consumption plan of users in each period of the next day requires high calculation accuracy, whereas the calculation accuracy of the plan after 1 week and 1 month is low.
Therefore, we propose a variable interval OPU optimization model. The principle of time period selection is as follows: every 1 h of the next day is a time period, every 2 h is taken as a time period from day 2 to day 3, every 4 h is taken as a time period from day 4 to day 8, and every 8 h is taken as a time period for the remaining days of the month. All loads and power generation take the forecast average value in each interval.
3 Description of OPU resources
In this section, the modeling of the consumer and the aggregation method based on the zonotopic set are illustrated.
3.1 Polytopic feasible sets
Various types of OPU resources, such as transferable load and reducible load, exist in power systems, which have great potential flexibility to provide power balance and regulation services to power system operators. These devices have low capacity and large numbers. Most of the OPU resources can be formulated as energy storage (ES) devices according to Yi et al. (2021). We consider a single ES resource over a finite discrete time horizon comprising N time steps, each of duration ts. By definition, the feasible set
1) Power constraints: In general, the constant power pt the system draws from (pt > 0) or feeds into (pt < 0) the power grid during time step t is bounded as
2) Ramp-rate constraints: The ramping limitation is modeled as
3) Energy constraint: The current energy of ES needs to meet the upper and lower limit constraints, i.e.,
4) Energy conversion constraints: This constraint represents the relationship between the residual energy state and active power input/output, which can be written as
where α denotes the energy dissipation rate and η denotes the charging/discharging rate. Δt is the length of the time interval.
The set of all power trajectories
The description of flexibility by polytopes poses substantial computational challenges in making decisions for an entire group of systems. Therefore, the polytopes of each OPU user must be aggregated. The aggregate feasible set P(agg) is given by the Minkowski sum (M-sum) of all individual feasible sets p(j):
However, the aforementioned method is not feasible in practical solutions. With the increase in the dimensions of a convex polyhedron, the numbers of vertices and permutations increase exponentially, thus leading to a dimension explosion problem and greatly increasing the M-sum computational complexity. To address this difficulty, zonotopes have been proposed to inner-approximate individual polytopic feasible sets and have been found to have efficient polymerization characteristics.
3.2 Zonotopic feasible sets
Zonotope, also known as fully symmetric polyhedron, has the characteristics of less storage space and less computation when used in aggregation tasks. A zonotope Z can be expressed in terms of its center
where the generators are summarized in the generator matrix
3.2.1 General form of a generator
Generator design is a key part of the zonotope, which must be designed according to the specific constraint form. A prior study (Müller et al., 2019) has proposed a generator set for the power and energy constraints as
However, the generator form for more general constraints is not given. In other words, the generator in Müller et al. (2019) is not effective when a more detailed OPU resource model is considered. Therefore, we derive the general generator form in this section.
Consider a single OPU resource over a finite discrete time horizon comprising N time steps. Under a series of constraints, the feasible region can be expressed as
Remark 1: For polytope P and its maximum inscribed zonotope Zmax, every hyperplane of Zmax can find a hyperplane parallel to it in P.
To prove remark 1, we take the two-dimensional diagram in Figure 3A as an example, where hP and hZ denote the hyperplanes of P and Zmax. Suppose that there is a pair of edges hZ1and hZ2 in Zmax, and no corresponding parallel edge exists in hP. The peripheral edges of hZ1and hZ2 of P are marked as hP1, hP2, hP3, and hP4. On the basis of the original Zmax, we can construct new edges
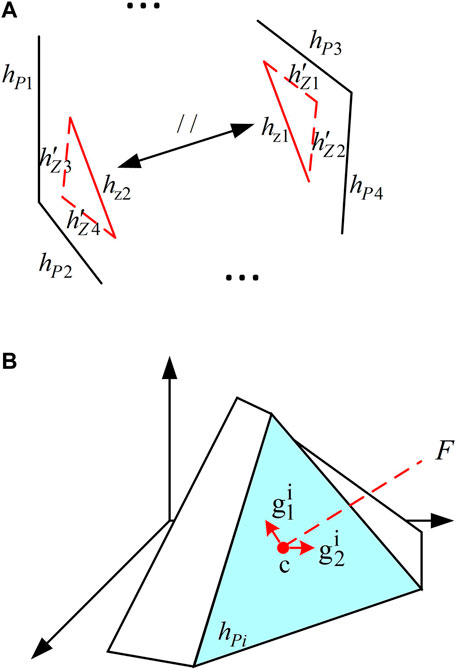
FIGURE 3. Illustration of the zonotope. (A) Two-dimensional diagram of a polytope and zonotope, where hz1//hz2,
On the basis of remark 1, we can easily deduce that a sufficient condition for finding Zmax of P is that the generator of Zmax can generate a hyperplane corresponding to each hyperplane of P. The hyperplanes are associated with the operational constraints of OPU resources.
Whether a zonotope can generate a hyperplane corresponding to each constraint depends on the extension direction of its generator. Therefore, we derive the general form of the generator to ensure every possible constraint is considered.
Remark 2: For each constraint
To prove remark 2, we take the three-dimensional diagram in Figure 3B as an example. As shown, the hyperplane hPi is formed by the constraint a1x1 + a2x2 + a3x3 ≤ b. On the basis of remark 2, we have two generators associated with the constraint, which can be expressed as
As shown in Figure 3B, the unit normal vector of hPi can be formed as
For
Because β is bounded, the first part in Eq. 26 is also bounded. According to Eqs 24 and 25, the second part is equal to 0.
For
According to remark 2, for a polytope with M constraint, we have an (N-1)M generator. The number of generators increases rapidly with the increase in constraints, thus posing a large computational burden in finding the maximum zonotope. Because many repetitions exist in these generators, duplicate generators must be filtered according to the following principles:
Remark 3: For generators giand gj in generator set G, if gi = gj or gi = −gj, then gi and gj are duplicate generators, and one of them should be removed from G.
3.2.2 Computing the optimal zonotope
This section demonstrates how to compute a zonotope that inner-approximates a given polytope based on the given generator G. The approximation problem of the zonotope can be solved with an optimization problem. The optimization goal is to achieve the highest similarity between the zonotope and the polytope.
Intuitively, on the premise of ensuring Z ⊆ P, the larger the volume of the zonotope, the higher the degree of approximation. However, to calculate the volume of the convex polyhedron, its vertex expression must be calculated. Converting the feasible region from half-space expression to vertex expression in the high-dimensional space poses a large computational burden, so we can arbitrarily construct s normal vectors
where
Given αs, the linear programming problem of finding the tangent point of a convex polyhedron and calculating the diameter can be written as follows:
where ɛ is a constant large enough. The relationship between the tangent point and diameter of the zonotope and αs can be written as
After solving 2S linear programming problems, we obtain
where Ac + |AG|βmax ≤ b is equivalent to Z ⊆ P, as proved in Müller et al. (2015).
3.3 Aggregation of zonotopic flexibility
The M-sum of zonotopes can be computed efficiently. For the OPU user set J, the aggregate zonotope ZJ of the individual sets
The structure of 32 is particularly convenient for aggregators. First, Z(J) is a zonotope because zonotopes are closed under Minkowski addition. Second, if systems are added to or removed from the population, or if individual feasible sets change, the aggregate feasible set can be adjusted efficiently by updating the arithmetic sums c(J) and
3.4 OPU with the aggregation of resources
In this section, we illustrate how to integrate zonotope feasible regions into the optimization problem described in Section 2.1. In the zonotope described in Section 3.3, the variables are the scaling factor β, in contrast to those in the OPU model pi,t. Therefore, variable transformation is necessary.
Each dimension of the zonotope is defined to correspond to each interval in OPU. Therefore, each point q in zonotope Z corresponds to a power plan in OPU, which is expressed as:
where h denotes the total number of generators.
Therefore, the FC-VI-OPU model can be expressed as
4 Results and discussion
In this section, we present the results of case studies based on the IEEE 14 node networks. Section 4.1 explains the details of the experimental setup. Section 4.2 illustrates the effectiveness of the zonotope, and comparative cases of the FC-VI-OPU model are designed and discussed in Section 4.3.
4.1 Experimental setup
We tested the performance of our proposed approach on simulated versions of the IEEE 14-bus. The topology of the system is shown in Supplementary Figure S1 where detailed information can be found. The simulation model was established with MATLAB r2018 software, by using CPLEX for optimization, on a computer containing an Intel i5-7500 processor, with a main frequency of 3.40 GHz and memory of 8 GB.
The three OPU users sign a contract with a DSO for orderly power consumption every month. The DSO performs load and power generation forecasting several days in advance, and the OPU users upload the feasible area. The DSO optimizes the OPU plan for the next day according to the aforementioned information and sends the instructions to the three OPU users for execution. Supplementary Table S1 provides detailed information regarding the three OPU users.
In this case, there are 14 days left in this month, and Supplementary Figure S2 provides the forecast information of power generation Pmax and load in the remaining 14 days of the month. A short-term power supply shortage exists during the daily load peak. The simulation dataset includes the load and wind power data taken from the Pecan Street data port (Street, 2015). The dataset contains smart meter kWh measurements taken each hour from approximately 100 residential customers and 20 wind farms throughout the course of 1 year. For each node of the test network, we aggregated the power consumption from 10 randomly selected customers as the nodal real power injections. All nodal power injections were adjusted on the basis of the standard load data of the network to create a realistic network loading level.
4.2 Superiority of the FC-VI-OPU algorithm
In this section, we analyze the effectiveness of the FC-VT-OPU model in three comparative cases. In each case, OPU resources are aggregated according to the zonotope.
Case 1: OPU model: Case 1 focuses only on short-term scheduling day ahead, and the optimized time scale includes only the next 24 h (Yi et al., 2021). According to the predicted load/power generation and the current contract completion, the DSO optimizes the OPU plan of the three load aggregators in the next day. At the end of the next day, the DSO updates the contract completion information of each OPU user and repeats optimization until the end of the month. The results of case 1 are shown in Figure 4. All electricity shortage problems are solved in the next 14 days. In addition, user 3 has large reduction in the first day because its current contract completion is the lowest. The load is reduced for user 3 together with users 1 and 2 in the next few days.
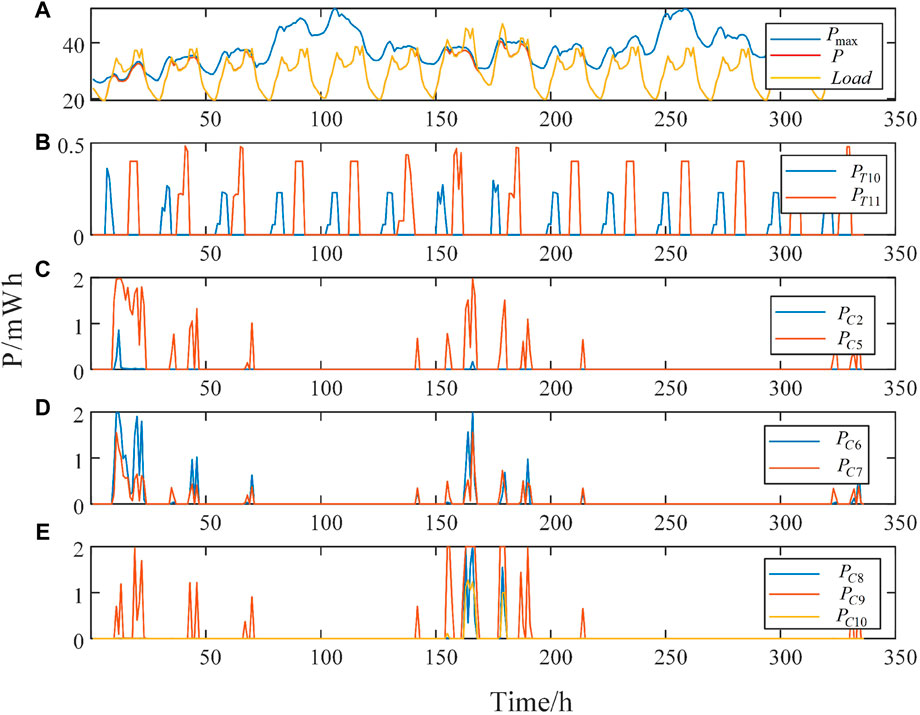
FIGURE 4. Optimization result of case 1.
Figure 5A shows the contract uncompleted rate of the three OPU users. It shows that the three rates always remain the same since the OPU model focuses only on the next day and will obtain a local optimal solution in each optimization.
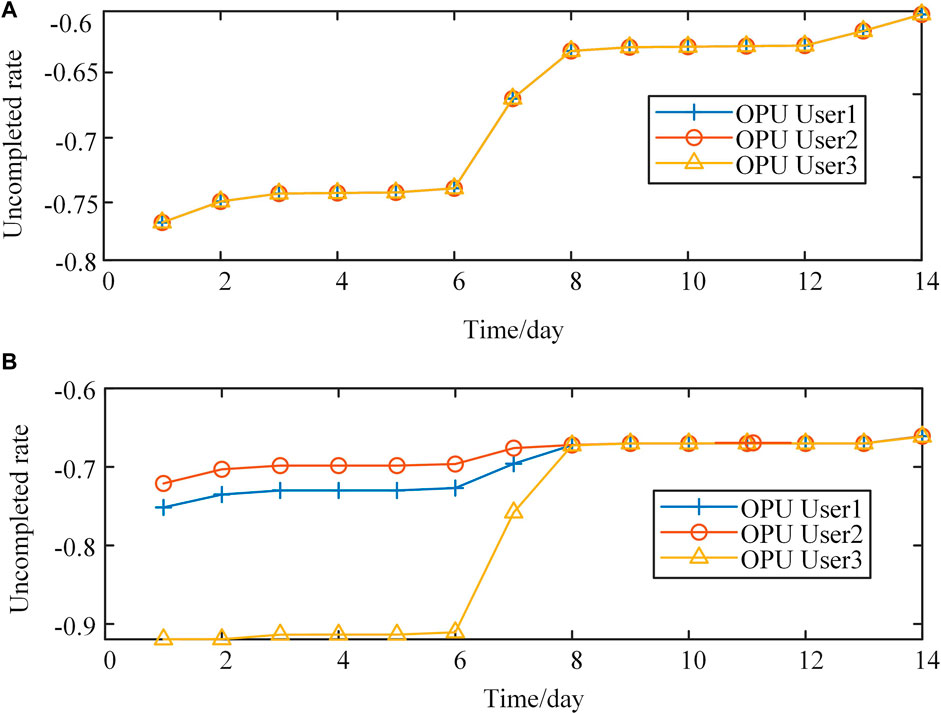
FIGURE 5. (A) Uncompleted rate of different OPU users in case 1. (B) Uncompleted rate of different OPU users in case 3.
Case 2: FC-OPU model: Case 2 focuses on long-term resource allocation, and the optimized time scale includes the full month (Wang et al., 2021). According to the predicted load/power generation and the current contract completion, the DSO optimizes the OPU plan for the three OPU users during the next 14 days. Figure 6 shows the result of case 2. Because the contract completion volume of user 3 is low, the load of user 3 is theoretically decreased to the greatest extent possible. However, when d = 7–8, the load of nodes 8, 9, and 10, where user 3 is located, increases because of the extremely hot weather, thus resulting in low-voltage problems.
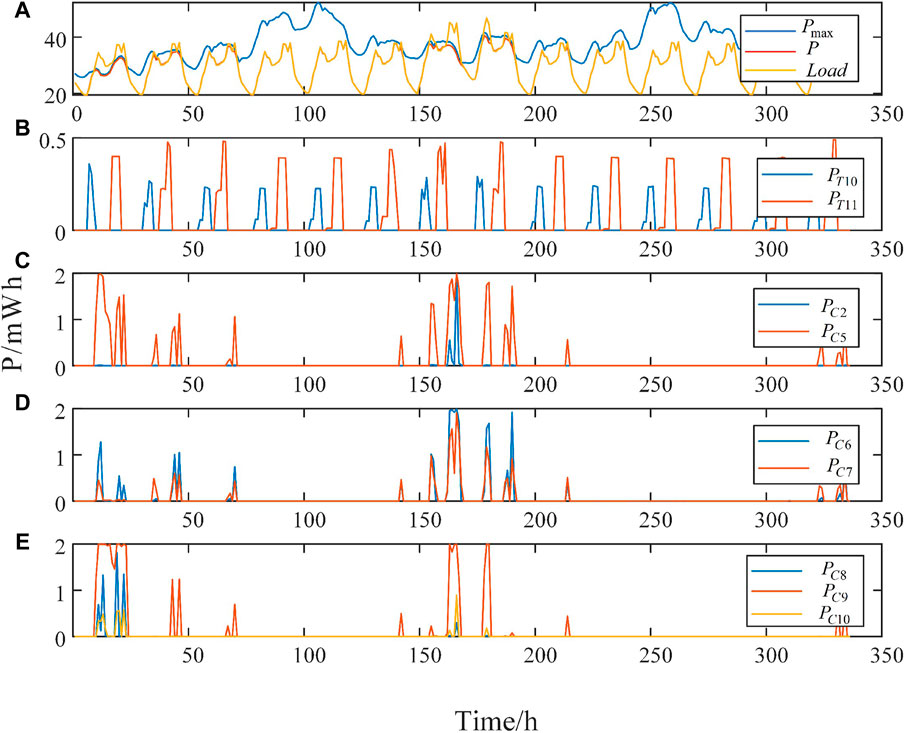
FIGURE 6. Optimization result of case 2.
The load of user 3 is cut first since it will cause smaller network loss than other OPU users. Therefore, the load reduction of user 3 is large at d = 7–8. Therefore, the load reduction of D = 1 is dominated by users 1 and 2. Table 1 shows the contract completion of case 1 and case 2 for day 1.
A comparison of case 1 and case 2 indicates that the entire cycle optimization can help the DSO determine the future power balance pressure and consider this information to determine the OPU plan for the next day. On the basis of the final optimization, the FC-OPU optimization model yields fairer results.
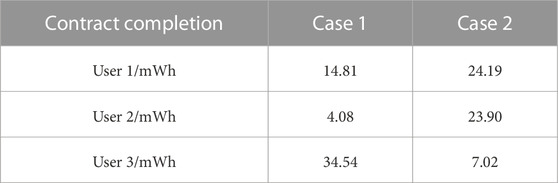
TABLE 1. Contract completion of case 1 and case 2 for day 1.
Case 3: FC-VI-OPU model: In this section, the optimization period is the entire month. The entire cycle is divided into several cycles according to the principles in Section 2.2.5. The DSO optimizes the OPU plan in the whole month, and only the plan in day 1 is adopted. At the end of the next day, DSO updates the contract completion information of each OPU user and repeats optimization until the end of the month. Figure 7 shows the results of case 3, which is similar to the result of case 2. In addition, Figure 5B shows the uncompleted rate of different OPU users in case 3 during the 14 days. We can see that the resource of user 3 is mainly dispatched in days 7 and 8, which is different from that in case 1.
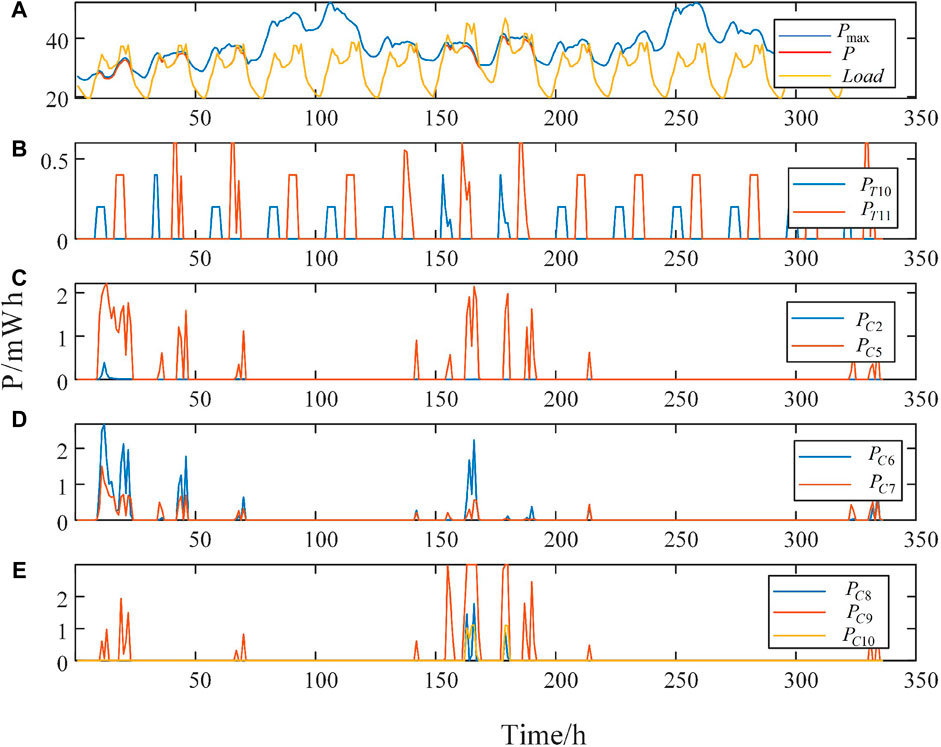
FIGURE 7. Optimization result of case 3.
Table 2 shows the optimization results and solution times for the three cases. From the perspective of optimization quality, the result of case 2 is the best, while that of case 1 is the worst. In addition, a suboptimal solution is obtained in case 3. From the perspective of solution time, case 1 needs the shortest solution time (20.3 s) because it only optimizes the plan of the next day. Case 2 is a full cycle optimization, so the solution time is greatly increased. However, the solution time of case 3 is greatly reduced due to the variable intervals processing while obtaining a satisfactory result.
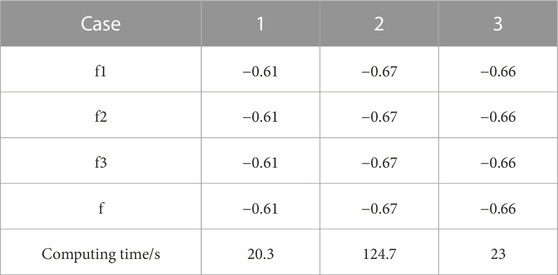
TABLE 2. Performance of the three cases.
4.3 Sensitivity analysis of the prediction error
In the previous analysis, we did not consider the prediction error of wind power/load. In this section, we analyze the effectiveness of this model under different prediction errors. The farther the load/generation is predicted, the greater the prediction error.
As illustrated in Section 2.2.5, the next 14 days are divided into four parts. Thus, we propose four scenarios, each with a different prediction error. Table 3 provides the detailed information about the setting of the predicted error.
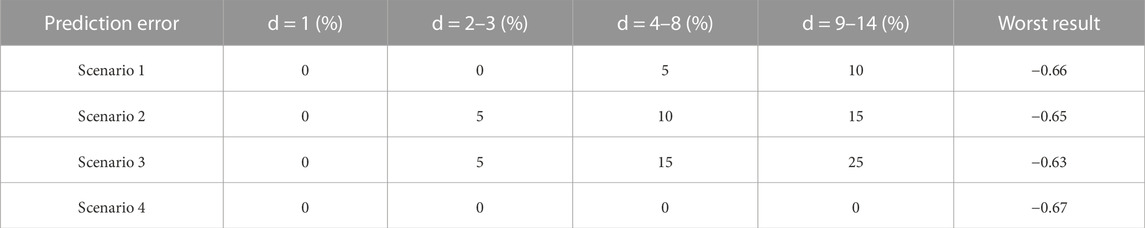
TABLE 3. Setting of the prediction error.
As shown in Table 3, the values indicate the maximum prediction error. For example, in scenario 1, when d = 4–8, the prediction value can be in the range of [0.95p, 1.05p]. To test the performance of the proposed model, 100 sets of load and power generation curves are generated in each scenario. We optimize the load shedding plan through the proposed FC-VT-OPU algorithm for each set of the curve, and the poorest result is shown in Table 3. The result in Table 3 shows that with increased prediction accuracy, the optimization result is closer to the optimal value −0.67 in scenario 4. In addition, when a large prediction error exists, the performance of the proposed FC-VI-OPU algorithm remains better than that of the OPU model (−0.63
4.4 Aggregation of OPU resources
4.4.1 Feasible region for single equipment
To help readers understand the proposed approximation method for the feasible regions of OPU resources in Section 3, a simple example is presented for the single equipment case. The equipment can be modeled by the formulation in Section 3.1. The time horizon T is set to 2. Thus, the feasible region of the OPU resource is a two-dimensional polygon, and the decision variable includes the active power in two time intervals. The parameters are given by R1 in Supplementary Table S2.
The feasible region of the basic polytope (R1) is shown in Figure 8A, in which the operation constraints in (16)–(18) are also presented. For the polytope marked in gray, three methods are used for the inner approximation: the box approximation (Chen et al., 2020), the zonotope using the generator in a prior study (Müller et al., 2019), and the zonotope using the generator proposed herein.
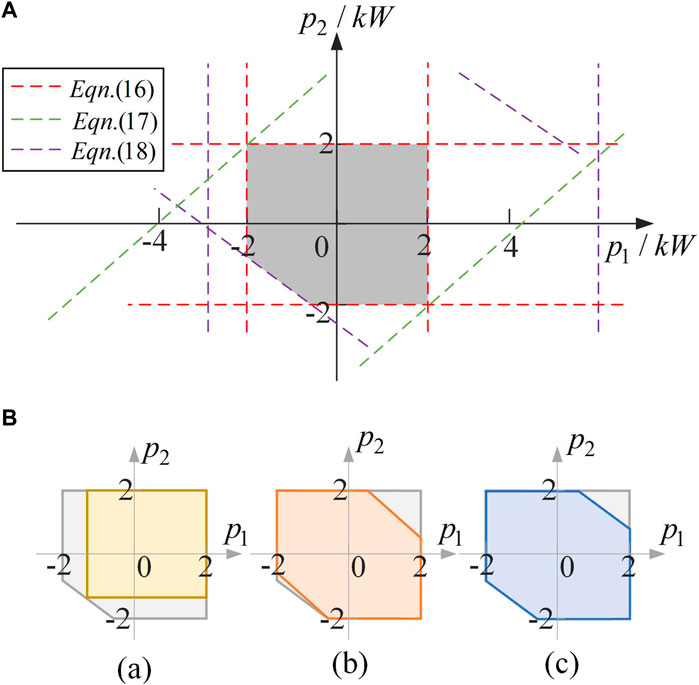
FIGURE 8. (A) Feasible region of R1. (B) Inner approximation of the feasible region based on three methods: (a) box approximation; (b) TRAD zonotope (Müller et al., 2019); (c) zonotope proposed.
Figure 8B shows the results of the three approximation methods. In Figures 8A a), because box approximation can extend only along the horizontal and vertical axes, the maximum inscribed rectangle is shown by the yellow region. In Figures 8B b), limited by the previously described generator (Müller et al., 2019), the zonotope can extend in the direction of 135°, as indicated by the orange region. In contrast, for the blue region in Figures 8B c), because our generator was obtained on the basis of the real constraint, the zonotope can extend in the direction of the constraint and cover a larger region. In addition, the three methods cover 78.6 %, 91.4.2%, and 96.8% of the polytope, respectively, thus indicating the effectiveness of the proposed method.
4.4.2 Multiple OPU resources with different time horizons
To further illustrate the scalability of the proposed aggregation approach, the aggregation results of four OPU resources (R1–R4 in Supplementary Table S2) with different time horizons are shown in Figure 9. Because the high-dimensional feasible region is not visible, the volume is used to reflect the aggregation performance.

FIGURE 9. Aggregation result of four OPU resources with different time horizons.
As shown in Figure 9, with a longer time horizon, the performance of all methods decreases and eventually reaches a limit value. In addition, the proposed zonotope aggregation method can always obtain the largest volume percentage with different time horizons over 90 %. The zonotope method in Müller et al. (2019) has poorer performance on the basis of the limited generator, and the curve of the box method drops sharply with increasing time horizon. Therefore, the proposed method enables convenient aggregation with a minimal loss of flexibility of OPU resources.
We further optimize the OPU problem in Section 4.2 based on the different aggregation methods, as shown in Table 4. It can be seen that the method proposed in this paper has the best performance regardless of the case. In addition, the method in Müller et al. (2019) exhibits a slightly worse performance. However, it is worth noting that in FC-OPU and FC-VI-OPU models, the box method results in a great loss of flexibility, which makes it unable to realize effective load reduction in some periods of time when power shortage happens.
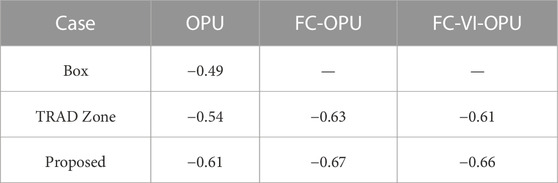
TABLE 4. Performance of the three aggregation methods for three cases.
4.5 Comparison of algorithm efficiency in a 421-bus system
The 421 system is also used to further validate the effectiveness of the proposed FC-VI-OPU algorithm, which is composed of three IEEE 141-bus systems (Capitanescu et al., 2014). Similar to the 14-bus system, there are 20 OPU users at different buses, and each user represents a flexible load cluster. The adjustable time of the OPU resources is set according to the actual data of an OPU project in a province of China this year. Moreover, this system also includes 10 WTs with the total capacity of 2.0 MW, and the peak load is 10 MW. The contract period is 3 months. To investigate the computational efficiency improvement by using the proposed method, the scheduling time is set at different points in the contract period. With an increasing number of time intervals in optimization, the complexity of the model is increasing.
Three cases are set to compare the performance of the three models in Section 4.2 under different calculation scales. In case 4.1, 10 users are considered in OPU optimization and the contract has 20 days left. Three aggregation methods are adopted based on the FC-VI-OPU optimization model. In case 4.2, three optimization models are adopted based on the proposed aggregation method. In addition, in case 4.3, more users are considered than case 4.2, as shown in Table 5. The values of the objective functions in three cases are also listed in Table 5. Figure 10 shows the computation time.
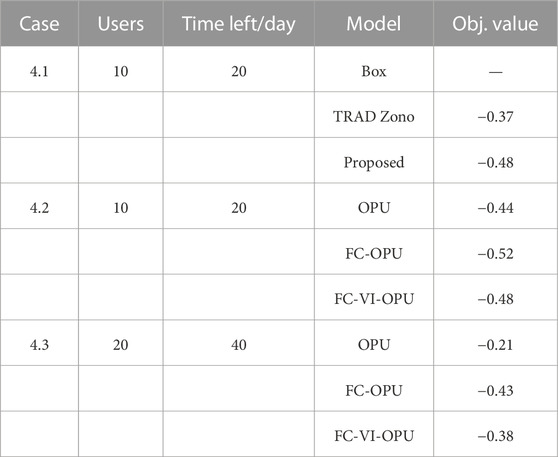
TABLE 5. Performance of the three models for three cases.
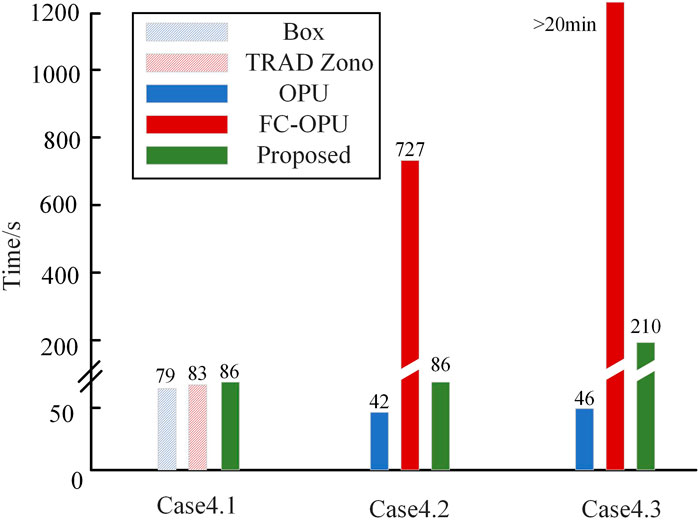
FIGURE 10. Calculation time for different models in three cases.
Table 5 and Figure 10 show that in case 4.1, the proposed aggregation method obtains the best objective value with slightly increased calculation time. In case 4.2, the FC-VI-OPU method reports the similar objective functions to the FC-OPU method, while in case 4.3, the performance of the OPU method is unsatisfactory and gets worse as the OPU users and contract time increase. The reason is that the OPU method cannot consider the prediction information and, finally, obtains an unfair OPU solution in large-scale systems. Meanwhile, even though the FC-OPU method can always obtain the best objective value in cases 4.2 and 4.3, it has shown terrible performances in terms of calculation time, as shown in Figure 10. In case 4.3, the calculation time of the FC-OPU method gets even more than 20 min. This is because more contract time introduces more time intervals into the problem and increases the complexity of optimization. In general, the proposed FC-VI-OPU method can achieve a good performance whether from the perspective of ensuring OEJ principles or calculation time.
5 Conclusion
This study has undertaken the formulation of the OPU conundrum, accompanied by the establishment of an optimization framework aimed at fostering equitability among OPU participants. The optimization schema operates on a day-ahead basis, encompassing the entirety of the contractual timeline, and incorporates adaptive intervals. To facilitate the amalgamation of OPU resources within this framework, we introduce a zonotope-based algorithm, wherein the foundational construct of the generator is presented in its general formulation. Three approximation methods were used to implement distribution-level power aggregation. Several illustrative instances were delineated for comparative analysis, illuminating the facets of the FC-VI-OPU framework. The empirical efficacy of the proposed approach finds corroboration through numerical assessments conducted across two distinct systems.
However, the proposed framework still has limitations that it does not consider the cost of the flexible resources, which is a huge challenge yet. Future work aims to consider the scheduling cost while aggregating the feasible regions of large-scale distributed resources and set the cost as a part of the objective function. In addition, another future work aims to consider the regional electricity trading under the weather impact and will focus on the uncertainty of renewable energy generation.
Data availability statement
The raw data supporting the conclusion of this article will be made available by the authors, without undue reservation.
Author contributions
All authors listed have made a substantial, direct, and intellectual contribution to the work and approved it for publication.
Funding
This work was supported by “Humanities and Social Sciences Youth Foundation, Ministry of Education of the People’s Republic of China” (No. 21YJAZH083). The funder was not involved in the study design, collection, analysis, interpretation of data, the writing of this article, or the decision to submit it for publication.
Conflict of interest
The authors declare that the research was conducted in the absence of any commercial or financial relationships that could be construed as a potential conflict of interest.
Publisher’s note
All claims expressed in this article are solely those of the authors and do not necessarily represent those of their affiliated organizations, or those of the publisher, the editors, and the reviewers. Any product that may be evaluated in this article, or claim that may be made by its manufacturer, is not guaranteed or endorsed by the publisher.
Supplementary material
The Supplementary Material for this article can be found online at: https://www.frontiersin.org/articles/10.3389/fenrg.2023.1166724/full#supplementary-material
References
Ayon, X., Gruber, J. K., Hayes, B. P., Usaola, J., and Prodanovic, M. (2017). An optimal day-ahead load scheduling approach based on the flexibility of aggregate demands. Appl. Energy 198, 1–11. doi:10.1016/j.apenergy.2017.04.038
Capitanescu, F., Bilibin, I., and Romero Ramos, E. (2014). A comprehensive centralized approach for voltage constraints management in active distribution grid. IEEE Trans. Power Syst. 29, 933–942. doi:10.1109/TPWRS.2013.2287897
Chen, C. (2018). 4–demand response: an enabling technology to achieve energy efficiency in a smart grid. Appl. Smart Grid Technol. 2018, 143–171. doi:10.1016/B978-0-12-803128-5.00004-0
Chen, X., Dall’Anese, E., Zhao, C., and Li, N. (2020). Aggregate power flexibility in unbalanced distribution systems. IEEE Trans. Smart Grid 11, 258–269. doi:10.1109/TSG.2019.2920991
Chi, J., Wang, B., Zhang, H., Kang, J., Lu, T., Huang, Y., et al. (2021). Regional coal power overcapacity assessment in China from 2020 to 2025. J. Clean. Prod. 303, 127020. doi:10.1016/j.jclepro.2021.127020
Fan, J., Tong, X., Yi, Y., and Chen, X. (2015). “Optimal scheduling of the orderly power utilization in China,” in International Conference on Renewable Power Generation (RPG 2015), Beijing, China, 17-18 Oct. 2015, 1. doi:10.1049/cp.2015.0349
Fu, X., Wu, X., Zhang, C., Fan, S., and Liu, N. (2022). Planning of distributed renewable energy systems under uncertainty based on statistical machine learning. Prot. Control Mod. Power Syst. 7, 41. doi:10.1186/s41601-022-00262-x
Gu, X., and Tian, Z. (2023). Does the green credit policy promote the technological innovation of clean energy enterprises? empirical evidence from China. Front. Energy Res. 11. doi:10.3389/fenrg.2023.1112635
Huang, J., Sun, P., and Pu, S. (2023). Model predictive power control of a heat pipe cooled reactor. Front. Energy Res. 10. doi:10.3389/fenrg.2022.984007
Koch, S., and Andersson, G. (2012). “Assessment of revenue potentials of ancillary service provision by flexible unit portfolios,” in 2012 IEEE Power and Energy Society General Meeting, San Diego, California, USA, 22-26 July 2012, 1. doi:10.1109/PESGM.2012.6345332
Liu, H., Chen, Z., Zhang, Y., Wu, Y., Chen, R., and Yang, L. (2021). “Strategy of orderly power utilization based on heavy haul lines in a province,” in 2021 Power System and Green Energy Conference (PSGEC), Shanghai, China, Aug. 20-22, 2021, 30. doi:10.1109/PSGEC51302.2021.9541857
Ma, T., Liu, D., Dou, X., Lv, S., and Jiang, Y. (2021). Key issues and technical applications in the study of power markets as the system adapts to the new power system in China. Sustainability 13, 13409. doi:10.3390/su132313409
Müller, F. L., Sundström, O., Szabó, J., and Lygeros, J. (2015). “Aggregation of energetic flexibility using zonotopes,” in 2015 54th IEEE Conference on Decision and Control (CDC), Osaka, Japan, 15-18 December 2015, 6564–6569. doi:10.1109/CDC.2015.7403253
Müller, F. L., Szabó, J., Sundström, O., and Lygeros, J. (2019). Aggregation and disaggregation of energetic flexibility from distributed energy resources. IEEE Trans. Smart Grid 10, 1205–1214. doi:10.1109/TSG.2017.2761439
Ouyang, T., Qin, P., Tan, X., Wang, J., and Fan, J. (2022). A novel peak shaving framework for coal-fired power plant in isolated microgrids: combined flexible energy storage and waste heat recovery. J. Clean. Prod. 374, 133936. doi:10.1016/j.jclepro.2022.133936
Šikšnys, L., Valsomatzis, E., Hose, K., and Pedersen, T. B. (2015). Aggregating and disaggregating flexibility objects. IEEE Trans. Knowl. Data Eng. 27, 2893–2906. doi:10.1109/TKDE.2015.2445755
Street, P. (2015). Dataport: the world’s largest energy data resource. United States: Pecan Street Inc.
Tao, J., Li, Z., Gang, W., and Yuan-Gang, T. (2015). “A smart task scheduling strategy of orderly power utilization based on priority,” in 2015 12th Web Information System and Application Conference (WISA), Jinan, China, September 11-13, 2015, 184–187. doi:10.1109/WISA.2015.64
Ulbig, A., and Andersson, G. (2012). “On operational flexibility in power systems,” in Power and Energy Society General Meeting, 21-24 November 2023.
Wang, F., Ge, X., Yang, P., Li, K., Mi, Z., Siano, P., et al. (2020). Day-ahead optimal bidding and scheduling strategies for der aggregator considering responsive uncertainty under real-time pricing. Energy 213, 118765. doi:10.1016/j.energy.2020.118765
Wang, S., Jia, R., Shi, X., An, Y., Huang, Q., Guo, P., et al. (2021). Hybrid time-scale optimal scheduling considering multi-energy complementary characteristic. IEEE Access 9, 94087–94098. doi:10.1109/ACCESS.2021.3093906
Xu, Z., Deng, T., Hu, Z., Song, Y., and Wang, J. (2018). Data-driven pricing strategy for demand-side resource aggregators. IEEE Trans. Smart Grid 9, 57–66. doi:10.1109/TSG.2016.2544939
Yi, Z., Xu, Y., Gu, W., and Wu, W. (2020). A multi-time-scale economic scheduling strategy for virtual power plant based on deferrable loads aggregation and disaggregation. IEEE Trans. Sustain. Energy 11, 1332–1346. doi:10.1109/TSTE.2019.2924936
Yi, Z., Xu, Y., Gu, W., Yang, L., and Sun, H. (2021). Aggregate operation model for numerous small-capacity distributed energy resources considering uncertainty. IEEE Trans. Smart Grid 12, 4208–4224. doi:10.1109/TSG.2021.3085885
Yin, Y., Yuan, Z., Pang, B., Xiao, Y., and Deng, Y. (2023). Design and assessment of a core-power controller for lithium-cooled space nuclear reactor based on the concept of fuzzy model predictive control. Front. Energy Res. 10. doi:10.3389/fenrg.2022.1067892
Zhang, Y., Xiao, Z., Li, D., Liu, H., Deng, K., Chen, Z., et al. (2019). “Evaluation model of load regulation value for consumers in the orderly power utilization,” in 2019 IEEE 3rd Conference on Energy Internet and Energy System Integration (EI2), Taiyuan, China, 22-24 October 2021 594. doi:10.1109/EI247390.2019.9062193
Zhou, M., and Hu, T. (2021). Analysis of carbon emission status under the carbon neutral target in China for earth’s atmospheric balance. IOP Conf. Ser. Earth Environ. Sci. 804 (10), 042082. doi:10.1088/1755-1315/804/4/042082
Nomenclature
Keywords: power shortage, orderly power utilization, aggregation of resources, zonotopic sets, computational enhancement
Citation: Xu P and Wang B (2023) A decision framework for orderly power utilization based on a computationally enhanced algorithm. Front. Energy Res. 11:1166724. doi: 10.3389/fenrg.2023.1166724
Received: 15 February 2023; Accepted: 31 October 2023;
Published: 29 November 2023.
Edited by:
Pallavi Choudekar, Amity University, IndiaCopyright © 2023 Xu and Wang. This is an open-access article distributed under the terms of the Creative Commons Attribution License (CC BY). The use, distribution or reproduction in other forums is permitted, provided the original author(s) and the copyright owner(s) are credited and that the original publication in this journal is cited, in accordance with accepted academic practice. No use, distribution or reproduction is permitted which does not comply with these terms.
*Correspondence: Beibei Wang, d2FuZ2JlaWJlaUBzZXUuZWR1LmNu