 Jiandong Duan
 Lupeng Chen
 Wenchao Lu
 Darui Zhu1
- 1School of Electrical Engineering, Xi’an University of Technology, Xi’an, Shaanxi, China
- 2Xi’an Xianyang International Airport, Xi’an, Shaanxi, China
As a significant approach to local utilization of clean renewable energy, the dispersed wind power (DWP) is becoming more and more widespread in engineering applications. With the fluctuating wind power widely and dispersedly integrated into distribution networks, it is urgent and pressing to effectively enhance the penetration rate of wind power based on the safe operation of distribution networks. This paper takes full advantage of the power regulation ability of wind turbines to actively participate in the operation of distribution networks, and then an optimal operation model of distribution networks is established with the optimization objectives of high penetration of DWP and maximum correntropy of node voltage. Aiming at the characteristics of the proposed model, the multi-objective brain storm optimization algorithm is adopted to solve the model to achieve the Pareto solution set, and the fuzzy membership function is used to determine the optimal operation scheme from the solution set. The simulation results on the expanded IEEE 33 bus system indicate the rationality of the proposed optimal operation strategy for distribution networks with high penetration of DWP. Meanwhile, the feasibility of the optimal operation scheme is verified through the case of a practical demonstration project.
1 Introduction
The aggravated environmental pollution and global fossil energy shortage have been driving the rapid development of technologies in clean renewable energy based power generation. As one of the focal points in energy research, the wind power is prominent. China is committed to the development of dispersed wind power technology, especially in April 2018, the National Energy Administration of China promulgated the specific management rules for the projects of dispersed wind power (National Energy Administration, 2018), which intended to vigorously promote the nearby utilization capability of wind power. Due to the randomness and fluctuation of wind power output, however, the large-scale integration of DWP into distribution network will bring adverse effects on the safe and economic operation of the system (Ma et al., 2016). Therefore, the safe and efficient utilization of DWP has become a vital problem to be solved at present.
Many researches have been carried out on the optimal operation, energy management and active control of distribution network with diverse distributed generations in recent years. Two voltage control strategies for distribution power system were introduced in Reference (Joseph et al., 2020) which utilize distributed energy resources to contribute reactive power to support the grid voltage. Reference (Tang et al., 2017) presented an optimal economic dispatch model for active distribution network and developed a new optimization method to solve the model to manage multiple controllable resources, such as distributed generations, battery storage, and demand response and so on. In order to take advantage of technological superiority of distributed generations in the economic, environmental and energy aspects, Reference (Zhao et al., 2016) highlighted an optimal dispatch model for active distribution network aiming to protect environment and save energy, then a two-stage algorithm was presented to solve the model. In Reference (Li and Zheng, 2019), the consumption rate of renewable energy and the operation cost of hybrid AC/DC microgrid was regarded as the optimization objectives, the source-network-load coordination strategies were proposed to realize the efficient utilization of renewable energy and the optimal operation of microgrids. The optimization objectives were proposed in Reference (Tuladhar et al., 2016) which contains minimization of system power loss, voltage deviation and energy wastage from wind power and photovoltaic power. Based on that, an optimal dispatch method for network reconfiguration as well as reactive power optimization of distributed generations was presented to improve the network performances.
With the rapid development of wind turbines and their control technology, flexible regulation of dispersed wind power output has become a feasible technological means to achieve the optimal operation of distribution network (Zhang et al., 2017). Therefore, the researchers have paid great attention to the reactive power optimization, active-reactive power coordination optimization, and voltage control strategy for distribution network with dispersed wind power. In Reference (Zhang et al., 2017), the control model of maximum active power for wind power integration was established by making full use of the reactive power capability in doubly fed induction generator (DFIG). Furthermore, a control strategy and optimization process for the maximum active power of wind power integration was designed in the paper. The reactive power capability of wind turbines based on permanent magnet synchronous generators was considered in Reference (Li et al., 2020), a reactive power control strategy adopted by optimizing the reactive power of wind turbines was proposed to minimize the power loss and maximize the service life of wind turbines. Reference (Xiang et al., 2021), established an optimal operation model of reactive power for distributed wind generations integrated into distribution network, with the purpose of making the most of distributed wind generations and economic operation of the distribution network. Reference (Guo et al., 2019) presented a distributed coordinated active and reactive power control method to optimize the output of active power and reactive power of wind farms, and the effect of active power on voltages was considered to improve the voltage control. Reference (Londero et al., 2017) provided the influence mechanism of DFIG operational limits on long-term voltage stability of power system and the circumstances of different wind speed was taken into account to explore possible simplified model. In Reference (Anilkumar et al., 2018), an intelligent method of optimal coordinated voltage control was proposed for distribution networks in the presence of distribution generations, which aimed to seek the optimal solution of different control variables.
Although most current researches on distributed renewable energy power focused on the optimal operation and energy management of distribution systems with a variety of controllable resources, it is not applicable to the engineering applications which only DWP is integrated into distribution networks. These researches took into account the coordination and collaboration of various controllable resources based on their respective characteristics. However, according to the application situation of practical projects, it is an important optimization goal to improve the penetration rate of wind power resources on the premise of ensuring the safe operation of power system. Besides, the power regulation capability of the wind turbines is not fully explored, and the regulation capability also needs to be verified by practical engineering. Therefore, it is necessary to conduct the research of the optimal operation strategy for DWP integrated into distribution networks.
Based on the analysis of power regulation capability of DFIG, this paper takes the high penetration of DWP and maximum correntropy of node voltage as optimization objectives to establish an optimal operation model for distribution networks, and then the multi-objective brain storm optimization algorithm is selected to solve the model. The expanded IEEE 33 bus system is adopted to test the validity of the proposed model and solution algorithm, moreover, the practical application effect of optimal operation strategy is also verified by a demonstration project of DWP integrated into the distribution network.
The rest of this paper is organized as follows: Section 2 analyzes the power regulation capability for wind turbine, which lays a theoretical foundation for the optimal operation strategy in this paper. In Section 3, the optimal operation model of distribution network with DWP is presented, and the solution method for the model is described in Section 4. Simulation results on the expanded IEEE 33 bus system are presented and discussed in Section 5, and the test on a demonstration project in China is shown in Section 6. Section 7 concludes the paper.
2 Analysis of power regulation capability for wind turbines
In general, all of the three main types of wind turbines, i.e., cage asynchronous generator, direct drive permanent magnet synchronous generator and doubly fed induction generator, have certain capability of power regulation. However, DFIG is the most popular type applied in dispersed wind farms in China. The power regulation capability of DFIG is the major foundation for the realization of DWP’s active participation in the optimal operation of distribution network.
Taking the DFIG as an example, the analysis of power characteristics shows that the stator side and the grid-side converter are the main source of reactive power (Zhang et al., 2017; Xiang et al., 2021). Current research indicates that the reactive power regulation capability of DFIG is greatly affected by the rotor current. The rotor current is restricted by the thermal current limit of the rotor winding and the maximum current of the converter, so it is considered that the maximum rotor current is a key factor affecting the reactive power of DFIG. Taking into account the current constraints of rotor side, the reactive power capability from the stator side can be expressed as follows:
where
In addition, the grid-side converter can also provide reactive power regulation capability for the wind turbines, which is restricted by the maximum capacity of grid-side converter. The reactive power capability can be expressed as:
where
Therefore, the reactive power capability of a single DFIG unit, i.e., the adjustable range of reactive power, can be expressed as Eq. 3:
where Qmax and Qmin denote the maximum reactive power which issued and absorbed by DFIG unit respectively.
The power capacity curve of DFIG is shown in Figure 1, each curve in the figure is corresponding to the regulation range of reactive power in different slip ratio. It can be seen that the reactive power of wind turbines can be adjusted in a wide range and gradually decreases with the increase of active power. Therefore, the reactive power capability of wind turbine makes it have sufficient conditions to actively participate in the voltage regulation of distribution networks.
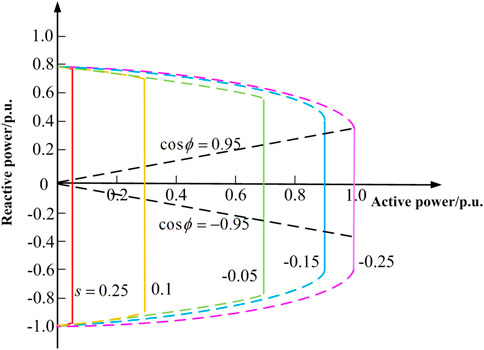
FIGURE 1. The capacity curve of DFIG.
3 Optimal operation model of distribution network with dispersed wind power
The power regulation capability of wind turbines makes it possible for dispersed wind power to participate in the operation and regulation of distribution network. In order to give full play to the advantages of dispersed wind power in the economic development and environmental protection, this paper presents an optimal operation model of distribution network with DWP, which focuses on the high penetration of DWP and maximum correntropy of node voltage. The purpose of optimal operation model is not only the full utilization of clean renewable energy, but also the improvement of voltage quality in distribution networks.
3.1 Objective function
3.1.1 High penetration of dispersed wind power integration
Making full use of clean renewable energy based power generation is one of the effective ways to solve the environmental pollution and energy shortage crisis. Moreover, the operation cost of wind power generation does not need fuel expenses. On the premise of satisfying the demand of power load, the higher wind power consumption, the lesser the electricity purchased from the bulk power system which is dominated by thermal power, and the better the economical operation of the system. Therefore, in the perspective of environmental and economic factors, realizing the high penetration of wind power integration is the primary objective to achieve the optimal operation of distribution network with DWP.
The concept of energy penetration ratio has been recognized by many researchers in judging the utilization level of clean and renewable energy generation in distribution network. It mainly refers to the percentage of electricity supplied by distributed generations to load consumption of distribution network (Karimi et al., 2016; Yarahmadi and Shakarami, 2018). Therefore, based on the energy penetration ratio of DWP in an operation cycle, the objective function for pursuing high penetration of dispersed wind power integration is established as Eq. 4:
where Ep denotes the energy penetration ratio of DWP; K is the number of stages in a operation cycle; W denotes the number of dispersed wind farms which integrated into distribution network; Pw(t) denotes the active power output of wth dispersed wind farm at time t; Pload(t) denotes the load power in distribution area at time t; Δt denotes the length of each unit operation stage.
Eq. 4 refers to the percentage of the wind power consumption to the load of distribution network. It is intended to ensure that the active power generated by dispersed wind farms can be consumed to the greatest extent on the premise of safe operation of the system, so as to achieve the objective of high penetration and full utilization of DWP by taking full advantages of the power regulation capability of wind turbines.
3.1.2 Maximum correntropy of node voltage
Node voltage can reflect both the operation status and the power quality of distribution network. The improvement of voltage quality for distribution network by DWP integration has been verified in theoretical research and practical engineering application (Londero et al., 2017). The node voltage is usually regarded as the constraint condition in most of optimal operation models, but it will make the optimized node voltage very close to its boundary value. So the node voltage is extremely liable to exceed the specified limit, resulting in the large-scale disconnection of dispersed wind farms from the distribution network, which will cause the loss of consumers. Therefore, in order to avoid the dispersed wind farms quitting operation under voltage fluctuation as far as possible and maintain a certain voltage margin, it is necessary to consider the optimization objective of node voltage quality improvement.
Because the node voltage in the distribution network actually presents the characteristics of non-Gaussian and nonlinear, the maximum correntropy criterion (MCC) (Liu et al., 2007) is applied as a cost function to establish the objective function of voltage quality improvement in distribution networks, and its general expression can be defined as Eq. 5:
where N denotes the number of sample points; Gσ(•) denotes the kernel function of MCC; σ denotes the kernel width of the kernel function, which is usually taken as constant 1; ei denotes the difference between the output and expectation of the ith vector to be solved.
The MCC maximizes the similarity between the expected value and predicted output value in the sense of “entropy”. The criterion focuses on the high-order statistics of the data, it is robust when dealing with the non-Gaussian and nonlinear data (Bessa et al., 2009). As a result, the MCC is suitable for processing of the data with nonstationary and time-varying characteristics, such as node voltage of distribution networks. According to Eq. 5, the objective function of voltage quality improvement in distribution networks based on the MCC can be expressed as Eq. 6:
where ΔUMCC denotes the voltage quality index based on MCC; Nd is the number of nodes in the distribution network; ΔUi(t) denotes the voltage deviation of the ith node at time t, and it is a state variable in the optimization process, which satisfies the power flow function corresponding to the control variable of the active power and reactive power output, i.e., ΔU = f (Pw、Qw); δU denotes the maximum allowable deviation of node voltage; function ϕ can be calculated according to Eq. 7:
Eq. 6 is the objective function of node voltage, which is constructed based on MCC shown in Eq. 5. The deviation of node voltage is the optimization objective which refers to the difference between the output and expectation in Eq. 5. This objective function means that the voltage of all nodes in the distribution network should be controlled within a safe and high-quality range to the fullest extent under the circumstances of load or DWP output fluctuation, so as to solve the disconnection problem of dispersed wind farms due to overvoltage. This problem has arisen many times in the trial operation stage of the first demonstration project of DWP integrated into 10 kV distribution network in China (Zhang et al., 2017).
3.2 Constrains
3.2.1 Power flow constraints
The power flow constraints of the distribution network mainly include equality constraints of power balance and inequality constraints of node voltage and branch current, which can be expressed as Eqs. 8, 9.
where Pi and Qi denote the active power and reactive power which feed into ith node respectively; Ui and Uj denote the voltage amplitude of node i and j respectively; Gij and Bij denote the real and imaginary part of bus admittance matrix respectively; θij denotes the phase angle difference between node i and j.
where Ui denotes the voltage amplitude of node i;
3.2.2 The power output constraints
The power capacity of DFIGs in dispersed wind farms is finite. Moreover, its reactive power is subject to the value of active power and power factor, which is shown in Figure 1. The active power and reactive power output of dispersed wind farms can be expressed as inequality constraints, which are shown in Eq. 10.
where Pw(t) and Qw(t) denote the active power and reactive power output of wth dispersed wind farm at time t respectively;
4 Solution method for the optimal operation model
The above Eqs. 4–10 constitute the optimal operation model of the distribution network with DWP. With high dimensional control variables, multiple optimization objectives, multiple optimization periods and nonlinear constraints, the optimal operation model is essentially a complex nonlinear programming problem. Traditional optimization algorithms, such as interior point method and nonlinear programming method, have shown some difficulties in solving the power optimization problems of the distribution network with DWP. Therefore, more and more researchers are focusing on artificial intelligence algorithms which have more powerful global searching ability. Aiming at the characteristics of the proposed optimal operation model, it is necessary to choose an intelligent algorithm with simple principle and wider adaptability to solve the model. Brain storm optimization (BSO) algorithm is a novel swarm intelligence search algorithm, which has the advantages of clear concept, excellent global optimization, wide adaptability and so on (Shi et al., 2013; Xiong and Shi, 2018). It has been applied to various optimization problems such as economic dispatch of power system. Considering the characteristics of the model and the advantages of BSO algorithm, the multi-objective brain storm optimization (MBSO) algorithm is introduced to solve the optimal operation model to obtain optimal operation scheme in this paper.
4.1 Description of BSO algorithm
BSO algorithm was derived from the process of brainstorming meeting when people take the approach of group decision making to deal with the problems. It is a mathematical solution algorithm abstracted from this process. In the discussion process, participants can be divided into three categories, i.e., a moderator, discussants and a few of problem originators. The mission of the moderator is to coordinate discussion process and promote participants to generate more good “ideas”. To avoid prejudice, the moderator should have no relevant professional background for unresolved problems. The discussants are the main force in the discussion process, they discuss the problems and provide a variety of “ideas”. They should have different academic knowledge and open mind as much as possible, which will help them to put forward much more different “ideas” where the best one is generated. After each round of brainstorming, the problem originators should make a choice from the “ideas” proposed by the discussants. They all have their own expertise and experience for the problems, so they will choose good idea according to different standards.
The iterative process of BSO algorithm corresponds to the discussion process of brainstorming meeting. Solutions in the algorithm can be regarded as “ideas” generated during brainstorming discussions. In addition, the fitness functions of the algorithm play the same role as problem originators in evaluation and selection. Similar to other swarm intelligence search algorithms, BSO algorithm also contains three core parts: generation of initial solutions, iterative update of solutions, and evaluation and selection of solutions. In each iteration process, the algorithm mainly includes two modules: clustering and updating. The clustering module divides all the solutions into k clusters based on K-means clustering method. The cluster center reflects the characteristics of these solutions and improves the efficiency of subsequent iteration. The updating module promotes local search through parallel optimization of all kinds of solutions, it also promotes global search by means of inter-cluster collaboration and Gauss mutation, which can ensure the convergence performance of the algorithm and the diversity of solutions in the process of optimization.
4.2 Solution method using MBSO algorithm
Because the presented optimal operation model has two objective functions, the multi-objective brain storm optimization algorithm is used to solve the model to obtain the Pareto solution set and select the optimal operation scheme. The algorithm flow is shown below.
(1) The parameters of the distribution network and DWP are initialized firstly, and the initial parameters of the MBSO algorithm should be set reasonably, which include the amount of solutions Ns, maximum iterations KImax, four probability parameters P1, P2, P3, P4, the amount of solutions M in the archive set (AS), and the amount of clusters k;
(2) Ns solution vectors are generated randomly and evaluated by the objective functions, on the basis of analysis of these solution vectors, the non-dominated solutions can be singled out and be put into the AS;
(3) K-means clustering method is used to divide Ns vectors into k clusters in the two-dimensional target space composed of two objective functions. For the k clusters, the clusters containing non-dominated solutions can be regarded as elite clusters and the others are ordinary clusters;
(4) The process of selecting solution vectors is shown in Figure 2 to generate new solutions. In order to generate new solution vectors, the solution vectors that need to be mutated are selected according to the selection flow in Figure 2. Then, the Gauss mutation method shown in Eq. 11 can be used to update the elements in the selected solution vectors.
where
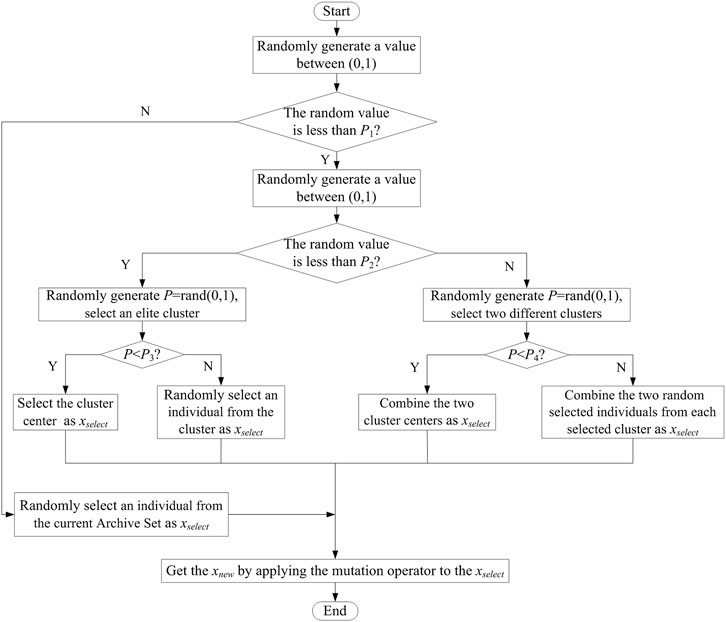
FIGURE 2. Update operation flow of BSO algorithm.
The old and new solution vectors can be evaluated according to the two objective functions and the non-dominated vector should be kept for the next iterations (If they do not dominate each other, either of them could be kept randomly).
(5) A new non-dominated solution is selected and compared with all the solutions in the AS. If it dominates a number of solutions in the AS, these solutions will be eliminated and this new solution will be stored into the AS. However, if the new non-dominated solution is dominated by a solution in the AS, this new solution will be eliminated and the next new non-dominated solution is checked. When all the non-dominated solutions are compared, the number of solutions in the AS is counted clearly. If the number of solutions exceeds the prescribed capacity of the AS, the crowding-distance of each solution in the AS should be calculated and the redundant solutions should be eliminated. The method of calculating crowding-distance is shown in Eq. 13.
where Nobj denotes the number of objective functions and
(6) The optimal solutions could be searched according to the above steps. When the preset convergence accuracy or maximum iteration number are reached, i.e., the termination condition is satisfied, the search stops and the current AS should be output, which is the Pareto optimal solution set.
In actual operation of the distribution network, the operator must choose one of them from Pareto set, i.e., an optimal operation scheme that can balance the voltage quality and the penetration of wind power. In this paper, the fuzzy membership function shown in Eq. 14 is used to evaluate the satisfactory degree of each objective function corresponding to each solution in Pareto set. According to Eq. 15, the overall satisfactory degree of each solution can be calculated. The operator can choose the solution with the largest overall satisfactory degree as the optimal operation scheme.
where μi is the satisfactory degree of the ith objective function; fi is the value of the ith objective function;
To sum up, the solution method for optimal operation model is shown in Figure 3. The method can be used to obtain the Pareto solution set, from which the optimal operation scheme is selected.
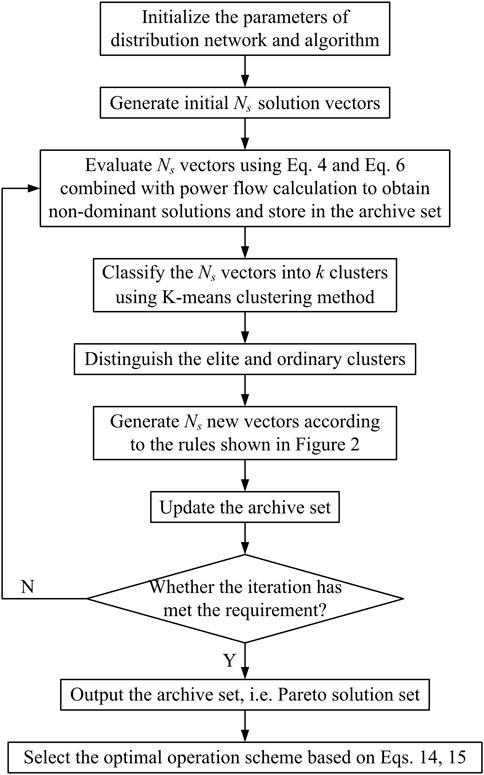
FIGURE 3. Flowchart of solution method for optimal operation model.
5 Case study
5.1 Case system and parameters
In order to test the effectiveness of the proposed optimal operation model and the solution method, an extended IEEE 33 bus distribution system is used as an example for simulation analysis. The topology structure of the case system is presented in Figure 4, and the details of each dispersed wind farm are shown in Table 1.
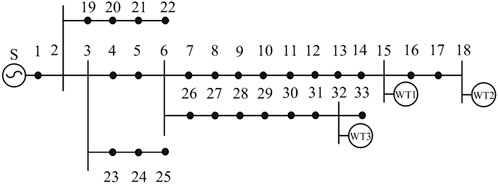
FIGURE 4. Diagram of dispersed wind farms integrated into IEEE33 bus distribution system.
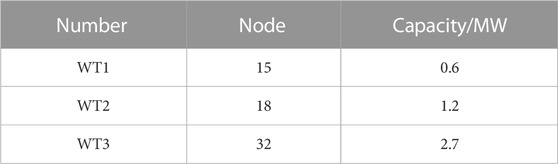
TABLE 1. Parameters of dispersed wind farms.
The regulation range of reactive power is confined to the actual situation of active power output for each dispersed wind farm, which is shown in Figure 1. According to Chinese national standard, the allowable deviation of voltage for 10 kV distribution systems is limited to ±7% of nominal voltage. In order to prevent voltage disqualification caused by the fluctuation of wind power and load, the maximum allowable deviation of node voltage (δU in Eq. 6) is set as 0.05 p.u.
As shown in Figure 5, the load curve and forecasting active power output curves of dispersed wind farms in a typical day are used to simulate the proposed method. This typical day contains various operating conditions, which can be simulated and tested in different scenarios. The operating cycle is 24 h and the time interval is 15 min.
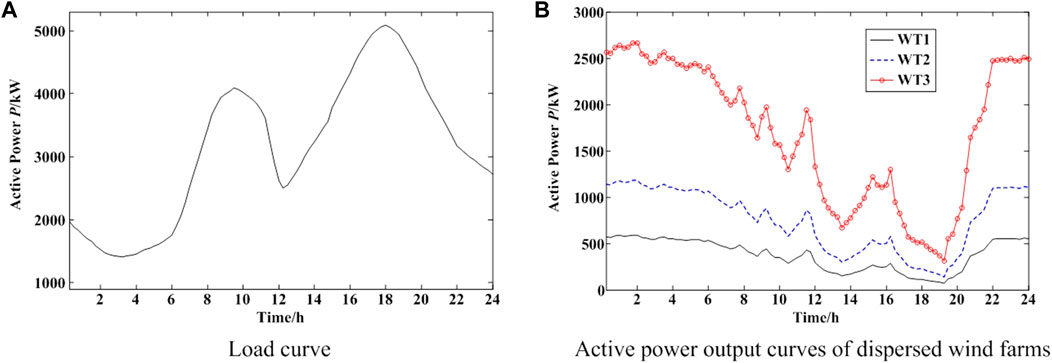
FIGURE 5. Diagram of case data in a typical day.
5.2 Simulation results and analysis
The MBSO algorithm is utilized to solve the optimal operation model to obtain the operation scheme. The proper configuration of algorithm parameters should be set up firstly, i.e., the initial number of individuals Ns = 50, while the capacity of archive set M = 20, the maximum number of iterations KImax = 500, the number of clusters k = 4, and the four probability parameters are P1 = 0.9, P2 = 0.3, P3 = P4 = 0.5.
The simulation results are shown in Figures 6, 7, i.e., the optimal operation scheme obtained by the proposed method of high penetration of DWP integration. Figure 6 shows the reactive power output of each dispersed wind farm after optimization. Figures 7A–C show the active power output of each dispersed wind farm after optimization during a typical time period. According to the simulation results, we can conclude that the wind turbines can make full use of its own capability of power regulation to satisfy the integration conditions of DWP and maintain the safe operation of the system.
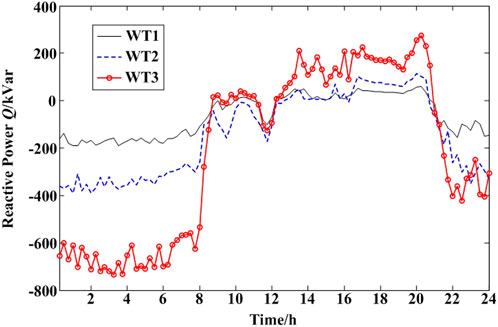
FIGURE 6. Reactive power output curves of dispersed wind farms.
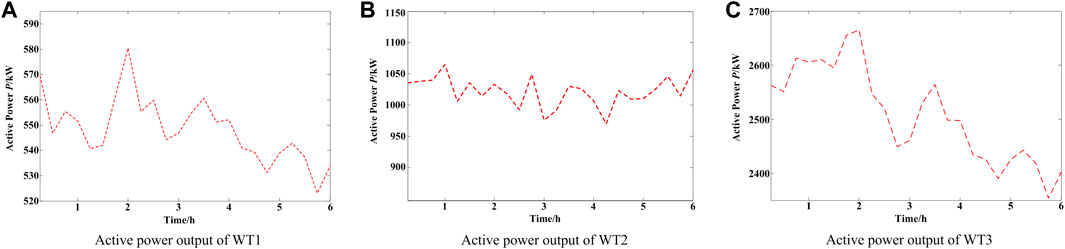
FIGURE 7. Active power output curves of dispersed wind farms.
5.2.1 Comparison and analysis of wind power utilization
The utilization indices of wind power about the constant power factor operation mode (cosφ = 1) and the optimal high penetration operation scheme are calculated respectively as shown in Table 2. The indices are the utilization ratio of wind power (i.e., the percentage of actual active power output to the forecasting maximum active power of dispersed wind farms) and the energy penetration ratio of DWP (i.e., Eq. 4). The constant power factor operation mode represents a kind of operation method of distribution network with distributed generations. It did not explore the power regulation capability of the wind turbines, and the active power output of DWP was adjusted passively according to the load demand of distribution network. In order to ensure the normal operation of the system, in cases when the node voltage of the distribution network exceeds the specified limits in the constant power factor operation mode, the measures of wind power curtailment and electricity restriction are adopted to reduce the active power output to maintain the node voltage to be qualified.

TABLE 2. Comparison on two operation modes of wind power.
As shown in Table 2, the utilization ratio and the penetration ratio of wind power are increased by 20.59% and 18.56% respectively based on the high penetration operation scheme. Taking the dispersed wind farm (WT2) which integrated into Node 18 as an example, Figure 8 shows the comparison on the active power output of wind power in different operation modes. During 0 a.m.–8 a.m. and 10 p.m. to 0 a.m. on the next day, the active power output of wind power based on the high penetration operation scheme is increased significantly compared with the constant power factor operation mode. It indicates that the proposed optimal operation strategy achieves high penetration and efficient utilization of wind power resources.

FIGURE 8. Comparison on active power of WT2 between two operation modes.
5.2.2 Comparison and analysis of voltage quality
The voltage curves of typical nodes about the constant power factor operation mode and the optimal high penetration operation scheme are shown in Figure 9 (Wind turbines only output active power in the constant power factor operation mode). In order to avoid redundancy in image display, three typical nodes are selected in Figure 9 to demonstrate the effect of the optimal operation strategy. Node 18 and Node 32 are both the points of common coupling (PCC) of DWP in different feeder sections of the distribution network, the voltage of these two nodes is most affected by the wind power output. Moreover, according to the results of simulation calculation, the value of node voltage at Node 18 is the upper voltage limit in the test system. Therefore, these two nodes are typical examples of their respective feeder sections to show the optimization effect of node voltage. The location of Node 10 is between the 10 kV bus and the PCC of wind power, it can reflect the voltage of some nodes which are far away from the PCC of DWP to a certain extent. The comparison between the Figures 9A,B shows that the node voltage will exceed the specified limits during part of time period in constant power factor operation mode, while the optimized node voltage can meet the requirements for safe operation of the distribution network.
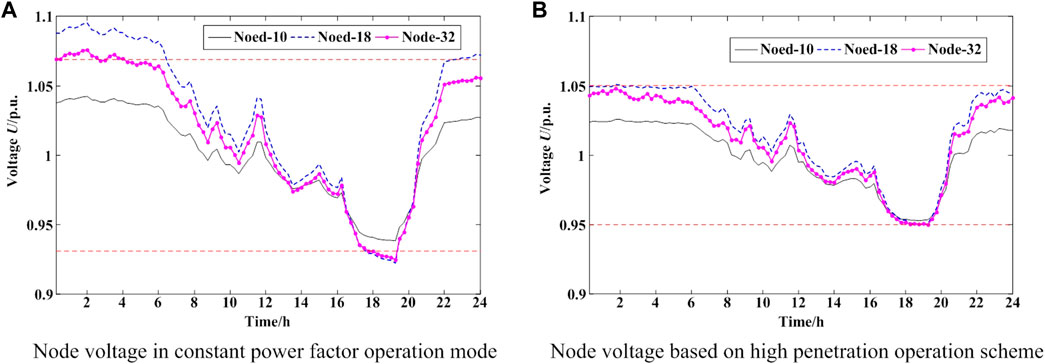
FIGURE 9. Voltage curves of typical nodes.
Combined with the Figures 5–7, we can clearly see that: 1) During 0 a.m.–6 a.m., in cases when the distribution network is weakly loaded while the output of wind power is close to full capacity, the dispersed wind farms will be separated from the distribution network because of overvoltage in the event of untimely adjustment, which is shown in Figure 9A. But when the high penetration operation scheme of wind power is adopted, the reactive power capability of the wind turbines is made full use to regulate the node voltage of the distribution network. As shown in Figure 9B, the capacity of reactive power is limited, so the active power output of each wind farm should be reduced appropriately to adjust the voltage to the defined scope. 2) During 5 p.m.–8 p.m., in cases when the distribution network is heavily loaded while the output of wind power is at a low level, the active power output of the dispersed wind farms cannot meet the load requirement of the system, as shown in Figure 9A, the voltage of some nodes will be less than the lower boundary in the constant power factor operation mode. At this time, the quality of the node voltage is failed to reach the required standard of safe operation. If it continues to operate like that, there may even appear quite serious consequences such as voltage instability. During this period, as shown in Figure 9B, the high penetration operation scheme can adjust the reactive power output of wind turbines to regulate the node voltage actively and keep them above 0.95 p. u. Generally speaking, the optimal high penetration operation scheme can keep the voltage of each node within the safe and high-quality range of 0.95–1.05p.u., the voltage quality is obviously improved.
In summary, the simulation test on the IEEE 33 bus system demonstrates that the proposed optimal operation method can realize the high penetration and efficient utilization of wind power on the premise of ensuring high quality of voltage. When the problem of overvoltage cannot be solved only by the reactive power capacity of dispersed wind farms, the active power output of wind farms should be reduced to adjust the node voltage to a qualified range.
6 Case analysis of demonstration project
The optimal operation model and solution method proposed in this paper have been applied to a demonstration project in Northern Shaanxi province of China. It is one of the first demonstration engineering applications for dispersed wind farms integrated into the 10 kV distribution networks in China. The local distribution network structure of the demonstration project is presented in Figure 10, and the details of the dispersed wind farm are shown in Table 3.
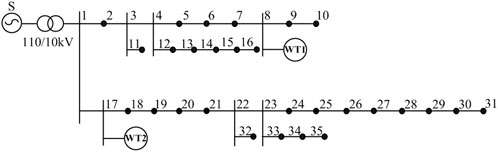
FIGURE 10. Diagram of dispersed wind farm integrated into the local distribution network.

TABLE 3. The parameters of the dispersed wind farm.
As shown in Figure 11, the load curve and active power output curves of dispersed wind farms in a typical day are used to simulation. The operating cycle is 24 h and the time interval is 15 min. The algorithm parameters are set up as: the initial number of individuals Ns = 50, while the capacity of archive set M = 20, the maximum number of iterations KImax = 500, the number of clusters k = 4, and the four probability parameters are P1 = 0.9, P2 = 0.3, P3 = P4 = 0.5.

FIGURE 11. Diagram of engineering case data.
The MBSO algorithm is used to solve the Pareto solution set and select the optimal operation scheme. The simulation results are shown as follows. Figure 12A shows the reactive power output of dispersed wind farms after optimization. The voltage curves of typical nodes about the constant power factor operation mode and the optimal high penetration operation scheme are shown in Figures 12B,C.

FIGURE 12. Diagram of optimization results.
Combined with Figures 11, 12, the optimized results illustrate that:1) During 0 a.m.–8 a.m., that is the time of valley load of the distribution network and almost full active power output of wind power, the voltage of the point of common coupling exceeds the upper boundary (1.07p.u.) in the constant power factor operation mode, as shown in Figure 12B. While the optimal operation scheme of wind power can adjust the node voltage to the scope of safe operation shown in Figure 12C, which indicates that the reactive power regulation capability of wind turbines is sufficient to meet the voltage requirements and realize the efficient utilization of wind power. 2) During 6 p.m.–10 p.m., that is the time of peak load of the distribution network and low active power output of wind power, the voltage is slightly low at the terminal node of feeder lines in the constant power factor operation mode, which is shown in Figure 12B. When the load or wind power output fluctuates, there is a high probability that the node voltage will exceed the lower boundary. The reactive power output of wind turbines can improve the quality of node voltage based on the optimal operation scheme, as shown in Figure 12C, which indicates that the reactive power of dispersed wind farms can participate in the voltage regulation of distribution network effectively.
In this practical case, the high penetration operation scheme has no restriction on active power output, it means that the active power output of wind farms has been fully utilized, i.e., the penetration ratio of wind power reaches the maximum. The above simulation results are basically consistent with the actual operation of the dispersed wind farm. According to statistics, the annual operation time of the demonstration project is more than 3,000 h. The utilization ratio of active power of DWP maintains at a relatively high level, which is the genuine implementation of the efficient utilization of wind power.
7 Conclusion
This paper proposes an optimal operation strategy of distribution network with high penetration of dispersed wind power, in which the power regulation capability of wind turbines is utilized sufficiently. A novel optimal operation model of distribution network is established, which pursues high penetration integration of DWP and maximum correntropy of node voltage. Considering the characteristics of the model, the MBSO algorithm is adopted to obtain the optimal operation scheme for the distribution network. The simulation results on expanded IEEE 33 bus system verify that the proposed optimal operation strategy can effectively ensure the high quality of node voltage and realize the high penetration integration of wind power. Moreover, a case of engineering application for dispersed wind farms also indicates the feasibility of the optimal operation strategy, which shows great application prospect and popularization value.
Data availability statement
The raw data supporting the conclusion of this article will be made available by the authors, without undue reservation.
Author contributions
Conceptualization, JD and LC; methodology, LC; software, WL; validation, DZ and QS.
Funding
This research was supported by the National Natural Science Foundation of China (51877174 and U2106218), Natural Science Basic Research Plan in Shaanxi Province of China (2023-JC-YB-359), China Postdoctoral Science Foundation (2020M683685XB).
Acknowledgments
The data of the simulation and test in this paper was provided by the Huaneng Dingbian New Energy Power Generating Co. Ltd. in China. Thanks a lot for their works.
Conflict of interest
The authors declare that the research was conducted in the absence of any commercial or financial relationships that could be construed as a potential conflict of interest.
Publisher’s note
All claims expressed in this article are solely those of the authors and do not necessarily represent those of their affiliated organizations, or those of the publisher, the editors and the reviewers. Any product that may be evaluated in this article, or claim that may be made by its manufacturer, is not guaranteed or endorsed by the publisher.
References
Anilkumar, R., Devriese, G., and Srivastava, A. K. (2018). Voltage and reactive power control to maximize the energy savings in power distribution system with wind energy. IEEE Trans. Industry Appl. 54 (1), 656–664. doi:10.1109/TIA.2017.2740850
Bessa, R. J., Miranda, V., and Gama, J. (2009). Entropy and correntropy against minimum square error in offline and online three-day ahead wind power forecasting. IEEE Trans. Power Syst. 24 (4), 1657–1666. doi:10.1109/tpwrs.2009.2030291
Guo, Y., Gao, H., Wu, Q., Østergaard, J., Yu, D., and Shahidehpour, M. (2019). Distributed coordinated active and reactive power control of wind farms based on model predictive control. Int. J. Electr. Power and Energy Syst. 104, 78–88. doi:10.1016/j.ijepes.2018.06.043
Joseph, A., Smedley, K., and Mehraeen, S. (2020). Secure high DER penetration power distribution via autonomously coordinated Volt/VAR control. IEEE Trans. Power Deliv. 35 (5), 2272–2284. doi:10.1109/tpwrd.2020.2965107
Karimi, M., Mokhlis, H., Naidu, K., Uddin, S., and Bakar, A. H. A. (2016). Photovoltaic penetration issues and impacts in distribution network–A review. Renew. Sustain. Energy Rev. 53, 594–605. doi:10.1016/j.rser.2015.08.042
Li, J., Wang, N., Zhou, D., Hu, W., Huang, Q., Chen, Z., et al. (2020). Optimal reactive power dispatch of permanent magnet synchronous generator-based wind farm considering levelised production cost minimisation. Renew. Energy 145, 1–12. doi:10.1016/j.renene.2019.06.014
Li, P., and Zheng, M. (2019). Multi-objective optimal operation of hybrid AC/DC microgrid considering source-network-load coordination. J. Mod. Power Syst. Clean Energy 7 (5), 1229–1240. doi:10.1007/s40565-019-0536-3
Liu, W., Pokharel, P. P., and Principe, J. C. (2007). Correntropy: Properties and applications in non-Gaussian signal processing. IEEE Trans. Signal Process. 55 (11), 5286–5298. doi:10.1109/tsp.2007.896065
Londero, R. R., Affonso, C. D. M., and Vieira, J. P. A. (2017). Effects of operational limits of DFIG wind turbines on long-term voltage stability studies. Electr. Power Syst. Res. 142, 134–140. doi:10.1016/j.epsr.2016.09.007
Ma, Z., An, T., and Shang, Y. (2016). State of the art and development trends of power distribution technologies. Proc. CSEE 36 (6), 1552–1567. (in Chinese). doi:10.13334/j.0258-8013.pcsee.2016.06.011
National Energy Administration (2018). Interim management measures for development and construction of dispersed wind power projects. http://zfxxgk.nea.gov.cn/auto87/201804/t20180416_3150.htm [Accessed April 3, 2018]. (in Chinese).
Shi, Y., Xue, J., and Wu, Y. (2013). Multi-objective optimization based on brain storm optimization algorithm. Int. J. Swarm Intell. Res. 4 (3), 1–21. doi:10.4018/ijsir.2013070101
Tang, J., Wang, D., Wang, X., Jia, H., Wang, C., Huang, R., et al. (2017). Study on day-ahead optimal economic operation of active distribution networks based on Kriging model assisted particle swarm optimization with constraint handling techniques. Appl. Energy 204, 143–162. doi:10.1016/j.apenergy.2017.06.053
Tuladhar, S. R., Singh, J. G., and Ongsakul, W. (2016). Multi-objective approach for distribution network reconfiguration with optimal DG power factor using NSPSO. IET Generation Transm. Distribution 10 (12), 2842–2851. doi:10.1049/iet-gtd.2015.0587
Xiang, Y., Zhou, L., Huang, Y., Zhang, X., Liu, Y., and Liu, J. (2021). Reactive coordinated optimal operation of distributed wind generation. Energy 218, 119417. doi:10.1016/j.energy.2020.119417
Xiong, G., and Shi, D. (2018). Hybrid biogeography-based optimization with brain storm optimization for non-convex dynamic economic dispatch with valve-point effects. Energy 157, 424–435. doi:10.1016/j.energy.2018.05.180
Yarahmadi, M., and Shakarami, M. R. (2018). An analytical and probabilistic method to determine wind distributed generators penetration for distribution networks based on time-dependent loads. Int. J. Electr. Power and Energy Syst. 103, 404–413. doi:10.1016/j.ijepes.2018.06.025
Zhang, X., Duan, J., Shi, X., Wang, K., Dong, Y., Mu, T., et al. (2017). Research of maximum control strategy with dispersed wind power considering reactive capability of DFIG. Proc. CSEE 37 (7), 2001–2008. (in Chinese). doi:10.13334/j.0258-8013.pcsee.152819
Keywords: dispersed wind power, distribution network, high penetration, regulation capability, maximum correntropy criterion, brain storm optimization algorithm
Citation: Duan J, Chen L, Lu W, Zhu D and Sun Q (2023) Optimal operation strategy for distribution network with high penetration of dispersed wind power. Front. Energy Res. 11:1166681. doi: 10.3389/fenrg.2023.1166681
Received: 15 February 2023; Accepted: 03 April 2023;
Published: 18 April 2023.
Edited by:
Mohamed Mohamed, Umm al-Qura University, Saudi ArabiaReviewed by:
Neeraj Gupta, National Institute of Technology, Srinagar, IndiaFei Mei, Hohai University, China
Copyright © 2023 Duan, Chen, Lu, Zhu and Sun. This is an open-access article distributed under the terms of the Creative Commons Attribution License (CC BY). The use, distribution or reproduction in other forums is permitted, provided the original author(s) and the copyright owner(s) are credited and that the original publication in this journal is cited, in accordance with accepted academic practice. No use, distribution or reproduction is permitted which does not comply with these terms.
*Correspondence: Lupeng Chen, Y2hlbmxwMDAyQDEyNi5jb20=