 Shunqi Wang1
 Yue Xiang1*
 Lin Chen1Zhou Sun2,3Shangjian Hu2Mingyang Guo3Haifeng Hu4Jun Tong4Yifan Huang4Liang Chen4Junyong Liu1
- 1College of Electrical Engineering, Sichuan University, Chengdu, China
- 2Sichuan Road & Bridge Group Co, Ltd., Chengdu, China
- 3Sichuan Shudao Clean Energy Group Co, Ltd., Chengdu, China
- 4Chengdu TELD New Energy Co, Ltd., Chengdu, China
Large-scale integration of electric vehicles (EVs) into the city system for charging will affect the operation of both traffic and distribution networks. An electric vehicle navigation and cluster dispatch model is proposed for improving the overall charging efficiency of EVs on the transportation network and increasing the voltage level of the distribution network. First, a simplified model of vehicles and traffic road network is established, and a cell transmission model (CTM) is used to simulate the real traffic network. The traffic system takes into account charging EVs, discharging EVs, and other vehicles, and traffic congestion is considered. Then, a coupled model of the traffic–power system is built for the orderly charging of electric vehicles upon arrival at a charging station. The model considers the coupling of the two systems on a time scale, and the charging/discharging power at each charging station node is controlled. The validity of the model is verified in a coupled system of 357 cell traffic network and modified IEEE33 nodes. The results show that the proposed model can ensure good guarantee of the distribution network voltage reliability and reveal the scheduling process of the traffic network. The proposed model also provides a reference for planning of charging stations in the distribution network.
1 Introduction
In recent years, air pollution, global warming, and other environmental issues have become prominent and urgently need to be addressed. By implementing low-carbon policies, electric vehicles (EVs) are widely used in transportation. Different from traditional fuel cars, electric vehicles have a large difference with them in terms of range capacity. At the same time, the high current involved in the charging process of electric vehicles has a significant impact on the reliability of the distribution network. Therefore, scholars have conducted a series of studies on the problem of electric vehicles (Xiang et al., 2021) (Li et al., 2020).
Large-scale access of electric vehicles to the network will have a greater impact on the way the distribution network operates. The online evolution mechanism of the EV–grid system was proposed in Dong et al. (2021) for penetration of intermittent renewable energy and the time variance problem of the system model. Li et al. (2023) proposed a two-stage EV management scheme to promote sustainable transportation. In the first stage, a toll scheduling model based on fuzzy multi-criteria decision-making was proposed, and in the second stage, a non-cooperative game model that incentivizes electric vehicles to participate in supplementary frequency regulation was proposed. Another two-stage scheme was proposed in Yan et al. (2023) to solve the problem of privacy of individual electric owners, the interest competition of different charging stations, and the restriction of coupled distribution networks. In the first stage, the total electric vehicle power flexibility region was derived by solving the optimization problem. In the second stage, a distributed coordination mechanism with a clear physical interpretation was established considering the network constraints based on AC power flow. To simulate a real customer EV distribution scenario, Shi et al. (2022) established a dynamic EV dispatching model considering the multi-source data association of customers, vehicles, charging stations, and service stations. Tao et al. (2022) proposed an improved generative adversarial network (GAN)-based coordinated scheduling strategy for electric vehicles with thermostatically controlled loads (TCLs). Machine learning was integrated into a two-layer optimization problem to determine the steady-state power dispatch and energy storage control of the energy storage systems. Feizi et al. (2022) presented a framework for determining feasible dispatch limits for solar photovoltaic (PV) generation in an unbalanced distribution network considering EV interconnection and associated uncertainties. To ensure frequency stability while reducing load shedding, an optimization strategy based on a two-layer confidence interval for EV participation in ultra-high-speed transmission systems was proposed in Liu et al. (2022a). Due to problems such as computational complexity, these studies focused on electric vehicles as grid participants but ignored the characteristics of transportation participants.
On the other hand, with the development of electric vehicles in power electronics and mechanics, related technologies such as vehicle-to-grid (V2G) (Yue et al., 2023) (Shang et al., 2022), vehicle-to-building (V2B) (Liu et al., 2022b), and battery swapping (Wu, 2022) (Jia et al., 2022) are also applied in network dispatching. Aiming at the randomness of current EV users’ participation in V2G, an EV cluster evaluation index model was established in Yue et al. (2023) by analyzing the impact of various pieces of information declared by EV users on the scheduling plan of aggregators and using the declared scheduling power, user credit, battery loss, and user participation as evaluation indexes. Due to the high computational complexity of large-scale EVs and impracticality of future power data collection, Shang et al. (2022) proposed a distributed edge computing framework to ensure the efficiency of scheduling and flexible availability of raw data sets. To minimize cost and maximize satisfaction, Liu et al. (2022b) combined the building energy demand and the safety/willingness of EVs to find and dispatch the optimal vehicle for auxiliary or support actions. Wu (2022) reviewed the state-of-the-art literature and business models for battery swapping stations (BSSs), which provide rechargeable batteries for upcoming electric vehicles in low-battery states. Yang et al. (2019) proposed a shared battery station (SBS) model, which is a multifunctional facility with charging, discharging, dormancy, and switching functions. Argiolas et al. (2022) evaluated the potential business case for battery storage systems for PV-assisted electric vehicle fast charging stations with integrated market applications and services. In Jia et al. (2022), a hybrid model of continuous time-domain battery exchange charging and logistics scheduling was proposed to optimize the joint operation of battery charging and exchange systems. In general, leveraging these new technologies can help solve the charging problem for EVs.
On the other hand, EVs, as transportation participants, are also subject to the rules of the transportation network. Diaz-Cachinero et al. (2020) proposed an enhanced operational planning model for EV routing and charging that considers technical and economic realistic constraints such as battery degradation, speed-dependent power consumption, and penalties for non-performance. Liu et al. (2019) formulated a traffic network charging navigation considering stochasticity based on dynamic programming. A simplified charging control algorithm was proposed to address the computational complexity of the navigation system. To investigate the vehicle–vehicle interaction of multiple vehicles in path planning and charging, an EV charging path optimization method based on an event-driven pricing strategy was proposed in Xiang et al. (2022). To address the charging time-consuming energy efficiency problem and the negative energy cost of regenerative braking in the road network, Wang et al. (2013) proposed an energy-driven and environment-aware EV route planning framework. A charging facility planning model coupled with the transportation and distribution system that considers traffic congestion was proposed in Zhang et al. (2019). Morlock et al. (2020) proposed a strategy for computing time-optimal routes for EVs. A simplified road network was first obtained from a leading routing service. Then, a detailed fuel consumption model was applied to solve the multi-objective shortest path problem using the improved Moore–Bellman–Ford algorithm. Zhang et al. (2020) used a two-loop structure to find the route that leads to the lowest energy consumption. In the outer loop, the path with the lowest energy consumption was obtained by minimizing the difference between the value function of the current round and the optimal values of the previous rounds. In the inner loop, the energy consumption metric of the plug-in hybrid vehicle power management under each feasible path was trained using reinforcement learning (RL). Most of the studies on EV distribution and path planning problems have focused on refined modeling in the direction of energy consumption and charging costs. However, path planning for large-scale vehicles is lacking due to the computational complexity requirements.
In summary, existing studies focus on scheduling or navigation unilaterally. Based on the computational complexity, traditional methods are not convenient for carrying out path planning for collaborative navigation of large-scale vehicles. A few studies have dealt with the coupling of transportation–energy systems, but they are also limited by the aforementioned scale problems and lack a realistic portrayal of the two networks.
This paper studies the navigation and dispatching problems for cluster EVs in order to create a highly reliable low-carbon traffic–power system. The main contributions of this paper are as follows:
• A charging and discharging co-navigation model is proposed. There are charging and discharging vehicles and other vehicles in the traffic network. A cell transmission model (CTM) is used to simulate the real road network. The navigation contains the path planning for charging vehicles and discharging vehicles. The charging vehicles reflect the power demand, and the discharging vehicles support the operation of the distribution network through V2G.
• A clustered electric vehicle dispatching model is proposed for a reliable low-carbon coupled traffic–power system. A cluster EV dispatching model is proposed for improving the overall charging efficiency of EVs on the transportation network and increasing the voltage level of the distribution network. After the electric vehicles arrive at the charging station, the distribution network acts as the control body for orderly charging of the EVs. The charging/discharging power is controlled by an optimization model.
The rest of the paper is organized as follows. The charging and discharging co-navigation model for improving the overall charging efficiency of EVs on the transportation network and increasing the voltage level of the distribution network is presented in Section 2. Section 3 presents the EV cluster dispatching model. The case study is demonstrated in Section 4. Finally, conclusions are drawn in Section 5.
2 Charging and discharging co-navigation models
2.1 Establishment of the traffic system
A low-carbon traffic system refers to the low energy consumption and low emission transportation mode with the goal of reducing greenhouse gas emissions from transportation behavior and is a way to realize low-carbon economy in the transportation field. Among them, the popularity of electric vehicles is the most crucial part.
In this section, there are three participating subjects in the transportation network: electric vehicles with charging demand, electric vehicles that can participate in V2G discharge, and other vehicles. To simplify the vehicle models of different types, we have
where
It is worth noting that
where
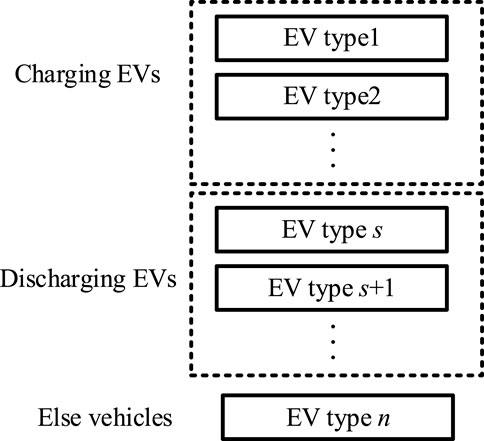
FIGURE 1. Classification of vehicles.
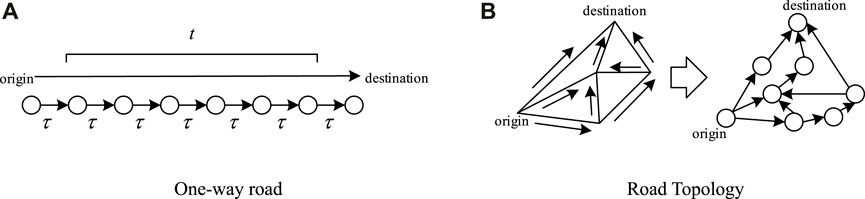
FIGURE 2. Conversion to cell structure.
Figure 2A shows the model transforming a section of a one-way road into cells. Assuming that the road section has a travel time of t without considering traffic congestion, it can be divided into multiple cell strings with each travel period τ, satisfying the sum of travel times equaling t.
Figure 2B shows the transformation of a simple road network structure into a cell model. In this case, there are crossed cells that accept path inputs from multiple cells, or outputs that point to multiple cells, which are called parent cells and child cells, respectively.
2.2 Navigation operating strategy
Based on the establishment of the traffic network, the navigation of the charging and discharging vehicles satisfies the CTM constraints described in Wang et al. (2020). We have
where
On the other hand, it is also necessary to consider the changes in the energy of the transportation network. We have
where
where
Finally, charging and discharging vehicles need to satisfy the following path planning constraints:
where
3 EV cluster dispatching model
3.1 Coupling for the traffic–grid system
When the electric vehicle arrives at the charging station node, the distribution network acts as the control master and unifies the charging power control. Figure 3 illustrates the coupling of the navigation process and the dispatching process on the time scale.
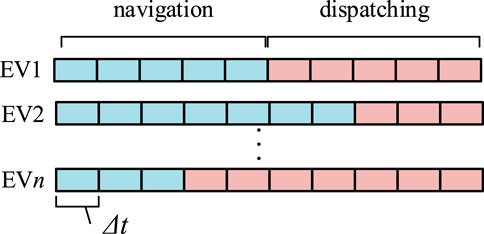
FIGURE 3. Coupling of navigation and dispatching on the time scale.
Sequential charging satisfies the following constraints:
where
In addition, the distribution network model constraints should be satisfied:
where
3.2 Optimization models
For the traffic system, the shortest navigation time of total charging EVs is guaranteed to reduce the impact of charging vehicles on the road conditions of the traffic network. That is, all charging electric vehicles are present at the charging station for the longest time in the whole time scale of dispatch. Thus, we have
For the power system, the guaranteed voltage level is more likely to be close to the rated value, which is used to measure the reliability of the power system. Thus, we have
where
In summary, the optimization model is established as follows:
The constraints include
Constraint (25) is a second-order cone-convex function, and all the remaining constraints are linear. Therefore, the optimization model can be solved by directly calling the common solvers.
4 Case study
4.1 Case description
The simulation is set up with a modified road network structure with 357 cells, coupled with modified IEEE33 nodes. The three charging stations in the traffic network are located in cells corresponding to nodes 7, 22, and 24 of the IEEE33 node power network. In this case, 70 EVs with charging demand and 10 discharged EVs with V2G willingness are set up in the traffic network. A certain number of other vehicles are generated by a random model in each cell. Set the time scale of the whole scheduling process to 40. Each time scale corresponds to a 3-min time interval. The maximum traffic flow
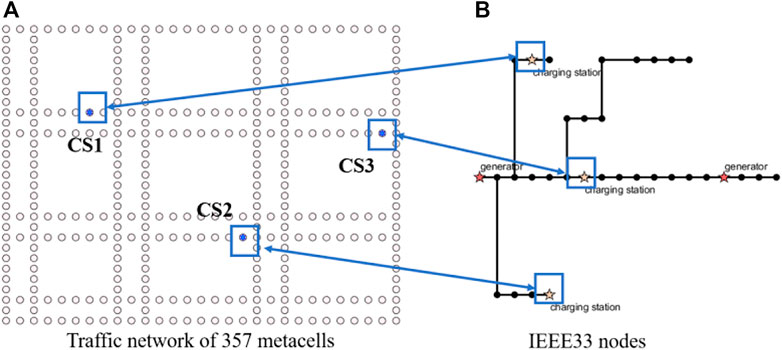
FIGURE 4. Coupling of the traffic–power system.
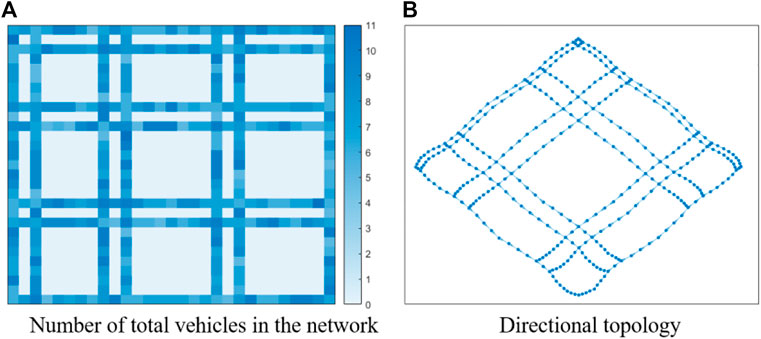
FIGURE 5. Specific parameters of the traffic network.
4.2 Navigation simulation results
Figure 6 shows the partial time-scale results for the charging co-navigation of 70 EVs. The red nodes represent electric vehicles, and the blue nodes represent charging stations. There is only one type of charging vehicle in this example, and it is stipulated that all charging vehicles can eventually reach any charging station node. For visual differentiation, the random generation method of vehicles specifies that each vehicle is at a different cell location. Moment 0 shows the locations of all vehicles with charging demand at the initial moment. As collaborative navigation proceeds, the number of vehicles traveling in the topology keeps decreasing. When 105 min is reached, all vehicles in this round arrive at the charging station. It can be seen that vehicles generally tend to lead to the charging station with the shortest single time. This is the result given by the objective function based on the shortest dispatch time at the traffic level.
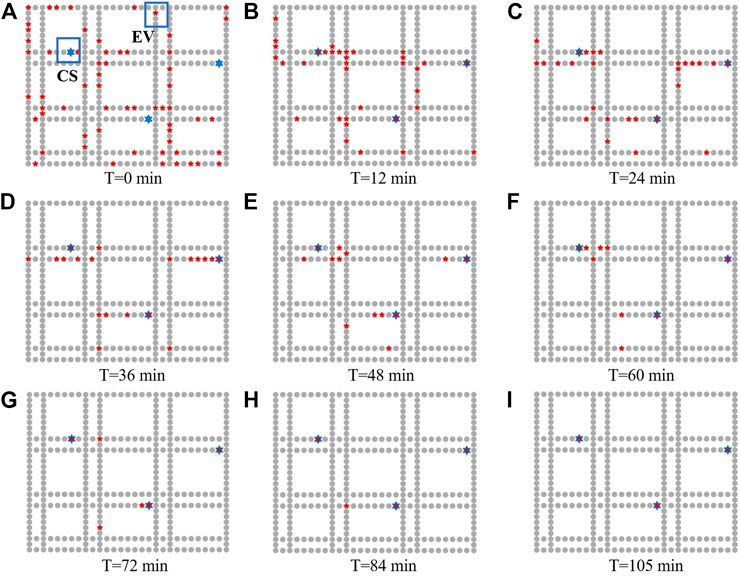
FIGURE 6. Co-navigation process for 70 charging electric vehicles.
Figure 7 shows the navigation results for all V2G vehicles. It can clearly be seen that nine EVs lead to charging Station 2, while only one vehicle leads to charging Station 1, and no vehicle leads to charging Station 3. In contrast to the path planning of charging EVs, there is no clear tendency for V2G vehicles to travel on the shortest path. Further analysis shows that it is the reliability of the distribution network that acts on the traffic dispatch and has an impact on path planning. Figure 8 shows the variation in the number of vehicles at the charging station nodes. It is worth noting that since the arithmetic example is a one-way topological road network structure, the number of vehicles at the charging station nodes can reflect the variation of the congestion level of the whole road where they are located. As the navigation process proceeds, it can be seen that the charging station nodes gradually become congested. Therefore, cluster scheduling will increase the traffic burden around the charging stations.
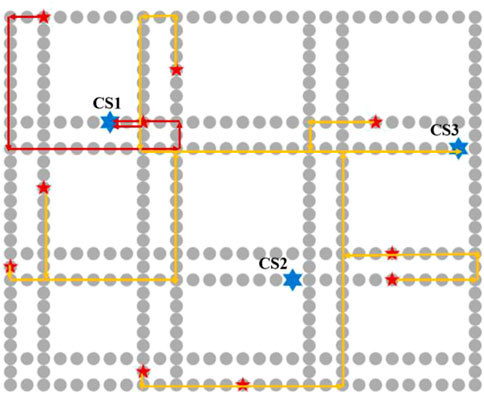
FIGURE 7. Co-navigation process for 10 discharging EVs.
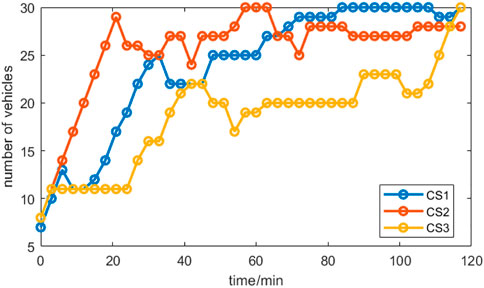
FIGURE 8. Changes in the number of vehicles at the nodes of charging stations.
In fact, by observing the distribution of vehicles at all time scales, all charging vehicles almost always pass at the optimal time, and at the intuitively optimal distance. Congestion hardly affects vehicle path planning, but can exacerbate traffic network congestion.
4.3 Cluster dispatching results
Figure 9 illustrates the power variation curve of charging stations. The maximum actual power of charging Station 1 reaches 1120 kW and that of charging Station 2 reaches 680 kW, while the maximum actual charging power of charging Station 3 is only 257 kW. Since this scheduling process incorporates an objective function indicating voltage reliability, it is obvious that the charging power of charging Station 3 is very flat. In contrast, charging Station 1 and Station 2 tend to proceed at maximum power for fast charging. Further analysis shows that the staggered charging moments of charging Station 1 and Station 2 with maximum power are carried out. Therefore, it can be concluded that the distribution network can accommodate more capacity at charging Station 1 and Station 2 nodes than at Station 3 nodes, when the main factor affecting the voltage level of the distribution network is the topology of the distribution network’s own power distribution rather than the charging power distribution, provided there is a capacity margin. Excessive power will aggravate the line voltage drop at charging Station 3, which is more likely to cause a lower voltage reliability level. As observed in Figures 9A, B, the reason for such a sharp increase in charging power is that the node power has not yet reached the maximum capacity of the distribution network. The theory of convex optimization suggests that if there is an optimal solution to a mathematical plan, it must be on the boundary conditions of the feasible domain.
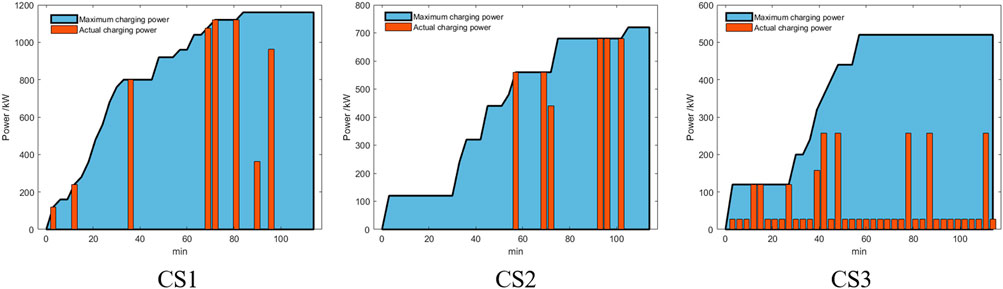
FIGURE 9. Charging power variation of charging stations.
Comparative experiments were carried out with or without considering voltage levels. The control experiments remove the objective function term characterizing the voltage level in Eq. 28. Figure 10 shows the comparison of the dispatch with/without considering voltage reliability. The voltage levels of all nodes are selected at 3 min, 57 min, and 114 min for the entire 2-h scheduling process. It is clear that in the case of scheduling without considering voltage reliability, the voltage easily reaches the upper bound of 1.1 and the lower bound of 0.9, while the latter voltage level is closer to the nominal value and never reaches the upper or lower bound. The highest voltage is only around 1.05, while only node 16 reaches a minimum voltage of 0.9. On the other hand, without considering voltage reliability, the voltage level varies significantly throughout the dispatch process, and we consider this to be a less reliable low-carbon traffic–power system. As shown in Figure 10A, the voltage level is relatively normal in the early stage at 3 min and 57 min, but deteriorates in the later stage, which is because the EVs are still in the navigation stage in the early stage and the charging station node load level is low. Also, when they arrive at the charging station, they are charged in a disorderly manner, which significantly increases the random load of the charging station.
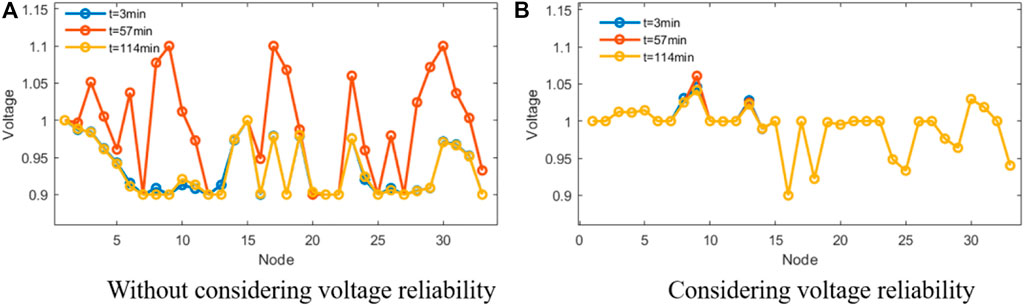
FIGURE 10. Comparison of voltage reliability.
Comparative experiments were carried out with and without V2G vehicles. The control experiment removes the dispatch of 10 V2G vehicles from the traffic network. Figure 11 shows the changes in power demand at the three charging station nodes throughout the dispatch process. The charging Station 2 node is generally a regular process where the power demand increases first and then decreases, which is because the charging demand increases as the EVs keep reaching this node; while on the other hand, the charging demand decreases at this point because of the unified charging and discharging scheduling management after reaching this node. It is worth noting that charging demand does not absolutely increase first and then decrease, which is because navigation and scheduling is a coupled process that takes place simultaneously. The power demand variation curve of charging Station 1 and Station 3 is more irregular, which is due to the addition of V2G vehicles, which also relieves the pressure of power demand.
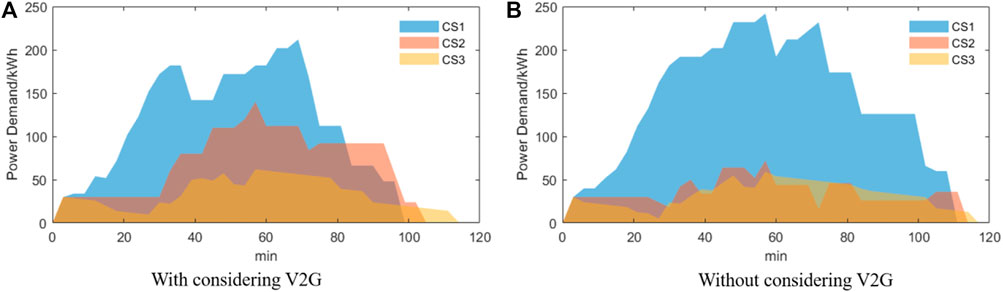
FIGURE 11. Changes in power demand during dispatching.
Comparing Figure 11A with Figure 11B, it is found that the most significant change without the addition of V2G vehicles is a significant increase in the load accommodated at charging Station 1, with the maximum demand increasing from 200 kWh to nearly 250 kWh. There is little change at charging Station 3 and a significant decrease in the charging load at charging Station 2, with the maximum demand decreasing from 150 kWh to nearly 60 kWh. Therefore, it can be concluded that charging Station 1 is more reliable than charging Station 2 at the power system level. Analyzing scheduling together with navigation, it can be found that V2G vehicles almost always flock to charging Station 3, and the charging power is flat at charging Station 3. Therefore, it can be considered that this is the vulnerability of the distribution network. In the subsequent distribution network planning, a new distributed power supply or increased line capacity near the charging station at this location can be considered to ensure the reliability of the large-scale access of EVs. Ultimately, a rough conclusion can be drawn that the reliability of charging Station 1 is greater than that of charging Station 2, and the reliability of charging Station 2 is greater than that of charging Station 3.
These analyses also provide a reference for charging station planning. The traffic system data can be obtained by extracting real-time traffic flow data and building a cell network. The charging stations at different locations are further simulated to get the optimized ordered charging and discharging power. Based on the reliability of the traffic network as part of the objective function, the ordered charging curve of the charging stations is obtained, and further analysis of the power demand and charging power can find a balance point of power and traffic, ensuring the charging power and charging navigation of the synergy are reasonable.
4.4 Computational time analysis
Furthermore, we choose four different cases under this model to analyze the computational complexity. Case A is the optimization model proposed in Section 3.2. Case B is the modified model without considering grid reliability in Eq. 28. Case C is the modified model without considering traffic efficiency in Eq. 27. Case D is the time required to find the first feasible solution for the optimization model as given in Section 3.2. The program is set up on a personal computer with a four-core i5-8265 CPU and an 8G RAM to further study the computational performance of the proposed model. The optimal gap is set as 0.01%.
Table 1 shows that not considering grid reliability speeds up the runtime, where most of the runtime is used to find the first feasible solution. This is due to the fact that the model is a macroscopic scale and the CTM is essentially concerned with whether and how many cars each cell has, while path planning is achieved through traffic flow only. Therefore, the search for the feasible domain of preliminary convex optimization is time-consuming. In contrast, when a feasible solution is found, collaborative path planning for large-scale vehicles is much faster according to the boundary conditions. Table 1 shows computational time analysis by different cases. It is worth noting that the operation time of Case C is longer than that of Case A, which is the result of the divergence of the boundary conditions due to the change of the objective function, which increases the difficulty of the boundary convergence.
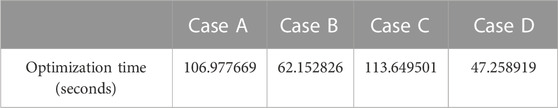
TABLE 1. Computational time analysis by different cases.
5 Conclusion
This paper presents an electric vehicle navigation and cluster dispatch model proposed for a reliable traffic–power system. A simplified model of the vehicle and traffic road network is established, and a cell transmission model (CTM) is used to simulate the real traffic network. A coupled model of the traffic–power system is built for the orderly charging of electric vehicles upon arrival at a charging station. The model considers the coupling of the two systems on the time scale, and the charging and discharging power at each charging station node is controlled. The validity of the model is verified in a coupled system of 357 cell traffic system and IEEE33 power system. The results show that it can ensure a good guarantee of distribution network voltage reliability and reveal the scheduling process of the traffic network. The model also provides a reference for the planning of charging stations in the distribution network. Through case study verification, the main conclusions are summarized as follows:
• Different from traditional path planning, path navigation based on the cell transmission model could plan a large number of traffic subjects simultaneously, and at the same time, the model can realistically simulate the traffic network and imitate traffic congestion, which has high applicability and practicality.
• The model performs unified charging scheduling for electric vehicles, while considering the scheduling of V2G. Through time-scale coupling, the transportation system is well-coupled with the electric power system, solving the problem that the existing research cannot take into account both systems at the same time.
• The model can also reveal the weaknesses of the distribution network. The comparison of the dispatch endpoints and charging and discharging power of V2G vehicles can reveal the vulnerable nodes corresponding to charging stations in the system. This provides a reference for the subsequent distribution network expansion planning including charging station planning, line capacity increase, and line new construction.
At the same time, there are shortcomings in this study. Considering the computational complexity, this study does not consider the fuel consumption of the traffic on the way, which cannot be ignored in a large-scale traffic network. The model does not consider the path planning constraints of other vehicles, which can have an impact on the congestion level of the traffic network. Further research will be conducted later to address these issues.
In the future, as electric vehicle penetration rate increases year-by-year, the integration of traffic–power networks will gradually deepen. Joint planning of the traffic–power system needs to be urgently carried out, which can also combine distributed data, such as distributed photovoltaics, to realize the integration of new energy and electrified transportation. It is also necessary to carry out joint planning to combine distributed generator data to realize integrated planning of new energy and electrified transportation to help realize the dual carbon strategy.
Data availability statement
The original contributions presented in the study are included in the article/Supplementary Material; further inquiries can be directed to the corresponding author.
Author contributions
SW and YX: conceptualization and methodology. SW: writing—original draft preparation. YX, LnC, ZS, SH, MG, HH, JT, YH, and LaC: writing—reviewing and editing. JL: supervision.
Conflict of interest
Authors ZS and SH were employed by Sichuan Road & Bridge Group Co., Ltd. Authors ZS and MG were employed by Sichuan Shudao Clean Energy Group Co., Ltd. Authors JT, YH, and LaC were employed by Chengdu TELD New Energy Co., Ltd.
The remaining authors declare that the research was conducted in the absence of any commercial or financial relationships that could be construed as a potential conflict of interest.
Publisher’s note
All claims expressed in this article are solely those of the authors and do not necessarily represent those of their affiliated organizations, or those of the publisher, the editors, and the reviewers. Any product that may be evaluated in this article, or claim that may be made by its manufacturer, is not guaranteed or endorsed by the publisher.
References
Argiolas, L., Stecca, M., Ramirez-Elizondo, L. M., Soeiro, T. B., and Bauer, P. (2022). Optimal battery energy storage dispatch in energy and frequency regulation markets while peak shaving an EV fast charging station. IEEE Open Access J. Power Energy 9, 374–385. doi:10.1109/oajpe.2022.3198553
Diaz-Cachinero, P., Muñoz-Hernandez, J. I., Contreras, J., and Muñoz-Delgado, G. (2020). An enhanced delivery route operational planning model for electric vehicles. IEEE Access 8, 141762–141776. doi:10.1109/access.2020.3013144
Dong, C., Chu, R., Morstyn, T., McCulloch, M. D., and Jia, H. (2021). Online rolling evolutionary decoder-dispatch framework for the secondary frequency regulation of time-varying electrical-grid-electric-vehicle system. IEEE Trans. Smart Grid 12 (1), 871–884. doi:10.1109/tsg.2020.3020983
Feizi, M. R., Khodayar, M. E., and Chen, B. (2022). Feasible dispatch limits of PV generation with uncertain interconnection of EVs in the unbalanced distribution network. IEEE Trans. Veh. Technol. 71 (3), 2267–2280. doi:10.1109/tvt.2021.3096459
Jia, W., Ding, T., Bai, J., Bai, L., Yang, Y., and Blaabjerg, F. (2022). Hybrid swapped battery charging and logistics dispatch model in continuous time domain. IEEE Trans. Veh. Technol. 71 (3), 2448–2458. doi:10.1109/tvt.2022.3143370
Li, X., Li, C., Luo, F., Chen, G., Dong, Z. Y., and Huang, T. (2023). Electric vehicles charging dispatch and optimal bidding for frequency regulation based on intuitionistic fuzzy decision making. IEEE Trans. Fuzzy Syst. 31 (2), 596–608. doi:10.1109/tfuzz.2022.3220964
Li, X., Xiang, Y., Lyu, L., Ji, C., Zhang, Q., Teng, F., et al. (2020). Price incentive-based charging navigation strategy for electric vehicles. IEEE Trans. Industry Appl. 56 (5), 5762–5774. doi:10.1109/tia.2020.2981275
Liu, C., Zhou, M., Wu, J., Long, C., and Wang, Y. (2019). Electric vehicles en-route charging navigation systems: Joint charging and routing optimization. IEEE Trans. Control Syst. Technol. 27 (2), 906–914. doi:10.1109/tcst.2017.2773520
Liu, H., Pan, H., Wang, N., Yousaf, M. Z., Goh, H. H., and Rahman, S. (2022). Robust under-frequency load shedding with electric vehicles under wind power and commute uncertainties. IEEE Trans. Smart Grid 13 (5), 3676–3687. doi:10.1109/tsg.2022.3172726
Liu, Y., Zhou, P., Yang, L., Wu, Y., Xu, Z., Liu, K., et al. (2022). Privacy-preserving context-based electric vehicle dispatching for energy scheduling in microgrids: An online learning approach. IEEE Trans. Emerg. Top. Comput. Intell. 6 (3), 462–478. doi:10.1109/tetci.2021.3085964
Morlock, F., Rolle, B., Bauer, M., and Sawodny, O. (2020). Time optimal routing of electric vehicles under consideration of available charging infrastructure and a detailed consumption model. IEEE Trans. Intelligent Transp. Syst. 21 (12), 5123–5135. doi:10.1109/tits.2019.2949053
Shang, Y., Shang, Y., Yu, H., Shao, Z., and Jian, L. (2022). Achieving efficient and adaptable dispatching for vehicle-to-grid using distributed edge computing and attention-based LSTM. IEEE Trans. Industrial Inf. 18 (10), 6915–6926. doi:10.1109/tii.2021.3139361
Shi, L., Zhan, Z. -H., Liang, D., and Zhang, J. (2022). Memory-based ant colony system approach for multi-source data associated dynamic electric vehicle dispatch optimization. IEEE Trans. Intelligent Transp. Syst. 23 (10), 17491–17505. doi:10.1109/tits.2022.3150471
Tao, Y., Qiu, J., and Lai, S. (2022). A data-driven management strategy of electric vehicles and thermostatically controlled loads based on modified generative adversarial network. IEEE Trans. Transp. Electrification 8 (1), 1430–1444. doi:10.1109/tte.2021.3109671
Wang, Y., Jiang, J., and Mu, T. (2013). Context-aware and energy-driven route optimization for fully electric vehicles via crowdsourcing. IEEE Trans. Intelligent Transp. Syst. 14 (3), 1331–1345. doi:10.1109/tits.2013.2261064
Wang, Y., Yu, X., Li, J., and He, J. (2020). Dynamic load restoration considering the interdependencies between power distribution systems and urban transportation systems. CSEE J. Power Energy Syst. 6 (4), 772–781. doi:10.17775/CSEEJPES.2020.02250
Wu, H. (2022). A survey of battery swapping stations for electric vehicles: Operation modes and decision scenarios. IEEE Trans. Intelligent Transp. Syst. 23 (8), 10163–10185. doi:10.1109/tits.2021.3125861
Xiang, Y., Wang, Y., Xia, S., and Teng, F. (2021). Charging load pattern extraction for residential electric vehicles: A training-free nonintrusive method. IEEE Trans. Industrial Inf. 17 (10), 7028–7039. doi:10.1109/tii.2021.3060450
Xiang, Y., Yang, J., Li, X., Gu, C., and Zhang, S. (2022). Routing optimization of electric vehicles for charging with event-driven pricing strategy. IEEE Trans. Automation Sci. Eng. 19 (1), 7–20. doi:10.1109/tase.2021.3102997
Yan, D., Ma, C., and Chen, Y. (2023). Distributed coordination of charging stations considering aggregate EV power flexibility. IEEE Trans. Sustain. Energy 14 (1), 356–370. doi:10.1109/tste.2022.3213173
Yang, J., Wang, W., Ma, K., and Yang, B. (2019). Optimal dispatching strategy for shared battery station of electric vehicle by divisional battery control. IEEE Access 7, 38224–38235. doi:10.1109/access.2019.2906488
Yue, H., Zhang, Q., Zeng, X., Huang, W., Zhang, L., and Wang, J. (2023). Optimal scheduling strategy of electric vehicle cluster based on index evaluation system. IEEE Trans. Industry Appl. 59 (1), 1212–1221. doi:10.1109/tia.2022.3213639
Zhang, Q., Wu, K., and Shi, Y. (2020). Route planning and power management for PHEVs with reinforcement learning. IEEE Trans. Veh. Technol. 69 (5), 4751–4762. doi:10.1109/tvt.2020.2979623
Zhang, X., Li, P., Hu, J., Liu, M., Wang, G., Qiu, J., et al. (2019). Yen’s algorithm-based charging facility planning considering congestion in coupled transportation and power systems. IEEE Trans. Transp. Electrification 5 (4), 1134–1144. doi:10.1109/tte.2019.2959716
Nomenclature
Index and sets
Constants
Variables
Keywords: electric vehicle, navigation, cluster dispatch, traffic–power system, cell transmission model
Citation: Wang S, Xiang Y, Chen L, Sun Z, Hu S, Guo M, Hu H, Tong J, Huang Y, Chen L and Liu J (2023) Electric vehicle navigation and cluster dispatch for reliable low-carbon traffic–Power systems. Front. Energy Res. 11:1164198. doi: 10.3389/fenrg.2023.1164198
Received: 12 February 2023; Accepted: 28 February 2023;
Published: 17 March 2023.
Edited by:
Tao Chen, Southeast University, ChinaCopyright © 2023 Wang, Xiang, Chen, Sun, Hu, Guo, Hu, Tong, Huang, Chen and Liu. This is an open-access article distributed under the terms of the Creative Commons Attribution License (CC BY). The use, distribution or reproduction in other forums is permitted, provided the original author(s) and the copyright owner(s) are credited and that the original publication in this journal is cited, in accordance with accepted academic practice. No use, distribution or reproduction is permitted which does not comply with these terms.
*Correspondence: Yue Xiang, eGlhbmdAc2N1LmVkdS5jbg==