 Shengchun Yang1
 Yifan Chang
 Jun Xie
- 1China Electric Power Research Institute, Nanjing, China
- 2College of Energy and Electrical Engineering, Hohai University, Nanjing, China
High wind power penetration and peak load pose significant challenges to the power system in maintaining the power supply–demand balance. Once the power supply–demand balance is disrupted, system load shedding and wind spillage become inevitable. In this study, the aforementioned problem is defined as the tight power balance (TPB) problem. The accuracy of wind power and load forecasting increases with a decrease in the forecasting timescale. Based on the aforementioned characteristics, a TPB multi-timescale disposal strategy for wind-integrated power systems considering electric vehicle (EV) charging stations is established to address the TPB problem at different timescales. First, the operation model of an electric vehicle charging station offering flexible ramping capacity is established. Second, a multi-timescale disposal strategy, which includes an intra-day 4-h plan, an intra-day 1-h plan, and a real-time 15-min plan, is presented by quantifying the flexible demand at different timescales. Finally, the proposed strategy is verified using a modified IEEE 118-bus system. The analysis results show that the proposed TPB multi-timescale disposal strategy effectively promotes the disposal level of the TPB problem.
1 Introduction
In response to the growing energy crisis and environmental pollution problems, increasing the share of renewable energy resources has become a roadmap for many nations (Ding et al., 2022; Han et al., 2022). However, with the large-scale integration of wind energy resources, the variability and uncertainty of the wind power output seriously affect the secure operation of the system (Khoshjahan et al., 2019; Park et al., 2022). The grid has to acquire adequate flexibility to satisfy the stochastic nature of the net load (the output of wind energy resources subtracted from the load) (Ghaljehei and Khorsand, 2022). Therefore, the exploration of system flexibility is of great significance for maintaining the secure operation of the power system.
Currently, many scholars have studied offering flexibility to power systems via flexible resources as a way of enhancing system flexibility. For example, electric vehicle (EV) charging stations (Zhang and Kezunovic, 2016), energy storage (Wang and Hodge, 2017; Khoshjahan et al., 2020), and flexible loads (Li et al., 2022) can offer flexibility to the power system, which reduces the regulation burden on thermal units. Heydarian-Forushani et al. (2018) devised an integrated stochastic day-ahead dispatching model, which included EV parking lots, bulk energy storage, and demand response, to participate in the flexible ramp market. EV charging stations aggregate EVs to provide flexibility, fast response characteristics, and high social and economic benefits (Neyestani et al., 2015). To explore the possibility of EVs providing flexible ramping products, a novel distribution system locational marginal pricing (LMP) model has been presented (Zhang et al., 2020). Wu et al. (2015) modeled the operational flexibility of the day-ahead market, which included flexible resources such as demand–response and energy storage, for managing the variability of renewable energy sources. Nikoobakht et al. (2019) proposed a methodology to estimate the flexibility of a given day-ahead scheduling model. Zhang et al. (2016) developed an integrated day-ahead stochastic scheduling model to dispatch resources and deploy flexible ramping, with demand–response providing the required flexibility. Chang et al. (2022) proposed a disposal strategy for TPB considering electric vehicle charging stations that provide flexible ramping capacity. To cover the uncertainty of wind power, an information-gap decision theory (IGDT)–based robust security-constrained unit commitment (SCUC) model with the integration of demand–response (DR) was constructed (Mirzaei et al., 2019). However, the abovementioned studies have focused on enhancing system flexibility on a single timescale. To improve the accuracy of the scheduling results, the study of system flexibility on a multi-timescale has to be undertaken.
Related methods have been proposed for the study of system flexibility on a multi-timescale. To increase the economic efficiency of power system operations, Cui et al. (2017) developed a multi-timescale unit commitment model that considers flexible ramping requirements. A hybrid stochastic/deterministic multi-timescale scheduling model has been proposed to enhance flexible ramping (Shaaban et al., 2018). Yamujala et al. (2022) studied a two-stage flexibility-constrained scheduling issue with a day-ahead security-constrained unit commitment (DA-SCUC) and real-time security-constrained economic re-dispatch (RT-SCED) models, which accurately estimated and economically scheduled flexible ramp products. Olsen et al. (2020) conducted a Fourier analysis to disentangle the energy storage and power flexibility requirements on hourly and minute timescales. Mueller et al. (2019) efficiently exploited the flexibility of energy resources by considering multiple resources with complementary physical characteristics at different timescales. Bagherinezhad et al. (2020) proposed a look-ahead optimization model simulating day-ahead and real-time operations of power systems with flexible ramp products. A multi-timescale unit commitment and economic dispatch model considering solar power ramping products was developed to accurately estimate ramping requirements on a multi-timescale (Cui and Zhang, 2018).
With the widespread integration of wind energy resources into the existing power system, the power system operation is likely to face the following scenario. When facing a short-term peak load (Baniasadi et al., 2019), the installed capacity of the system generation is insufficient to supply the load. When the wind power is generated at its maximum with a relatively low system load, the system regulation capability is insufficient to completely accommodate the wind power. In such cases, the power supply and demand are unbalanced, which is defined as the TPB problem. The abovementioned studies investigated system flexibility without considering the impact of the TPB state on system flexibility. The TPB state further reduces the capability of the system to offer flexibility, resulting in extra load shedding and wind spillage. Moreover, the accuracy of wind power and load forecasting tends to increase with a decrease in the forecasting timescale (Hu et al., 2022). Therefore, a TPB multi-timescale disposal strategy should be developed to mitigate the effects of wind power and load forecasting errors on the power system.
The main contributions of this article are summarized as follows:
1) To address the TPB problem at different timescales, a TPB multi-timescale disposal framework is presented, and a TPB multi-timescale disposal strategy considering an EV charging station that offers flexible ramping capacity is developed to promote the disposal level of the TPB problem.
2) Based on the fact that the accuracy of wind power and load forecasting increases with a decrease in the forecasting timescale, the demand for flexibility is quantified at different timescales. Consequently, the effects of wind power and load forecasting errors on TPB disposal are mitigated, thereby reducing system load shedding and wind spillage.
The remainder of this article is organized as follows. Section 2 introduces the TPB multi-timescale disposal framework. Section 3 establishes the EV charging station operation model. Section 4 proposes a TPB multi-timescale disposal strategy. Section 5 analyzes and discusses a numerical example. Section 6 presents the conclusions of this article.
2 Tight power balance multi-timescale disposal framework
2.1 Demand for flexibility
In the TPB state, the capacity and regulation capability of the power system generation are insufficient to completely supply the load and accommodate wind power. High wind power penetration and peak load result in a high demand for flexibility. The system demand for flexibility only offered by thermal units limits the output range of thermal units. As a result, the capability of the system to maintain the power supply–demand balance is weakened, resulting in load shedding and wind spillage.
As shown in Figure 1, in the TPB state, the capacity and regulation capability of the thermal units are both insufficient. When facing a peak load, load shedding is required, as illustrated in the dark red section of Figure 1. When facing high penetration of wind power, wind spillage is required, as illustrated in the dark blue section of Figure 1. The system flexibility offered by the thermal units limits their output range. The section between the dashed red and blue lines indicates the output range of the thermal units after they offer flexibility. During the peak load period, the requirement for thermal units to offer up-ramping lowers their maximum output, resulting in load shedding, as illustrated in the light red section of Figure 1. During the high wind power penetration period, the requirement for thermal units to offer down-ramping increases their minimum output, resulting in wind spillage, as illustrated in the light blue section of Figure 1. Additionally, wind power may have anti-peak load characteristics, which further cause load shedding and wind spillage.
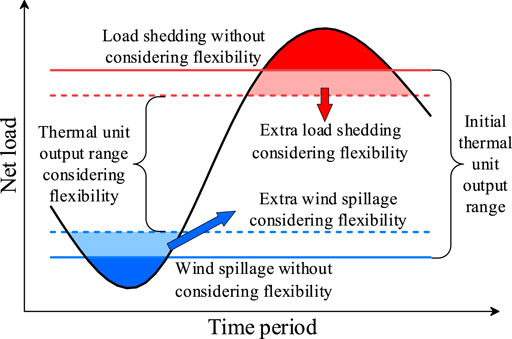
FIGURE 1. Schematic of the demand for flexibility limiting the thermal units’ output range.
2.2 Tight power balance multi-timescale disposal structure
Herein, the study of TPB multi-timescale disposal is divided into three timescales: an intra-day 4-h plan, an intra-day 1-h plan, and a real-time 15-min plan, with a time resolution of 15 min. Based on the fact that the accuracy of wind power and load forecasting increases with the decrease in forecasting timescale, a multi-timescale disposal strategy is developed to promote the disposal level of the TPB. The structure of TPB multi-timescale disposal is illustrated in Figure 2, and the detailed disposal structure is as follows:
1) Intra-day 4-h TPB disposal strategy. The TPB disposal strategy is formulated once every 4 h, with a time resolution of 15 min. Based on the intra-day 4-h wind power and load forecasting data, the thermal unit start-up and shutdown statuses and power output, charging and discharging statuses, and power of the EV charging station, system reserve, and flexible ramp are all updated over the next 4 h.
2) Intra-day 1-h TPB disposal strategy. The TPB disposal strategy is formulated once every 1 h, with a time resolution of 15 min. Based on the intra-day 4-h updated thermal unit start-up and shutdown statuses and the intra-day 1-h wind power and load forecasting data, the thermal unit power output, charging and discharging statuses, and power of the EV charging station, system reserve, and flexible ramp are all updated over the next 1 h.
3) Real-time 15-min TPB disposal strategy. The TPB disposal strategy is formulated once every 15 min, with a time resolution of 15 min. Based on the intra-day 4-h updated thermal unit start-up and shutdown statuses, the intra-day 1-h disposal results (thermal unit output, EV charging station discharging power, reserve, and flexible ramp offered by the thermal unit and EV charging station), and the real-time 15-min wind power and load forecasting data, the thermal unit output, charging and discharging statuses, and power of the EV charging station, system reserve, and flexible ramp are updated over the next 15 min.
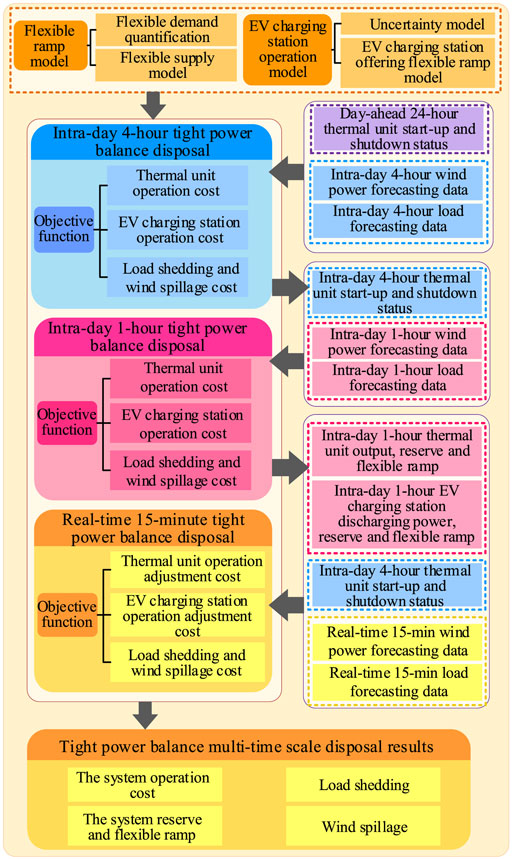
FIGURE 2. Flow chart of TPB multi-timescale disposal.
3 Electric vehicle charging station operation model
EV charging stations are aggregators representing EVs involved in power, reserve, and flexible ramp scheduling (Heydarian-Forushani et al., 2018). In this section, the EV charging station uncertainty is first modeled. Subsequently, an EV charging station offering flexible ramping capacity is developed.
3.1 Electric vehicle charging station uncertainty model
EV charging station uncertainty is derived from the uncertain behavior of EVs, which include the number of EV arrivals and departures, the initial state of energy (SOE) of EVs, and the capacity of EVs. Thus, to model EV charging station uncertainty, three groups of stochastic numbers based on the truncated normal distribution (Bessa, et al., 2012; Su and Chow, 2012) are employed, which are the arrival and departure times of EVs—
3.1.1 Number of EVs in EV charging stations
The number of EVs that arrived at the EV charging station, cs, at
where
3.1.2 Initial SOE of EV charging stations
The SOE is the remaining energy of the EV capacity. The initial SOE of EV charging stations is obtained by aggregating the initial SOE of EV arrivals and departures, which is shown in Eqs 5–7.
where
3.1.3 Total capacity of EV charging stations
The total capacity of EV charging stations is obtained by aggregating the capacity of EV arrivals and departures, which is shown in Eqs 8–10.
where
3.2 Model for electric vehicle charging station offering flexible ramping capacity
The EV charging stations can offer up-ramping in the vehicle-to-grid (V2G) mode and down-ramping in the grid-to-vehicle (G2V) mode. The EV charging stations that offer flexible ramping capacity are limited by the charging and discharging rate, capacity, and SOE of the EV charging stations.
3.2.1 Charging and discharging rate constraints of EV charging station
The power, reserve, and flexible ramp of EV charging stations are constrained by their charging and discharging rates, as shown in Eqs 11–13.
where
3.2.2 SOE coupling constraints of EV charging stations in adjacent periods
The SOE of EV charging stations in a period is affected by the SOE of EV charging stations in the previous period, EVs arrival and departure, charging and discharging power, offered reserve, and flexible ramp, as shown in Eq. 14
where
3.2.3 Power exchange limit with grid of EVs in V2G mode constraints
A contract is signed between EV charging stations and EVs to permit EV charging stations to utilize the V2G mode of EVs (Neyestani, et al., 2015; Shafie-Khah et al., 2016). EV charging stations aggregate the SOC demand allocated for each period to limit power exchange with the grid, as shown in Eq. 15
where
3.2.4 Upper and lower limits of SOC and SOE of EV charging station constraints
where
4 Tight power balance multi-timescale disposal strategy
4.1 System flexible demand
The demand for flexibility originates from the variability and uncertainty of the system net load. The value of the subtraction of the net load of the previous period from that of the next period is obtained. A positive value indicates the demand for up-flexibility, while a negative value indicates the demand for down-flexibility, as shown in Figure 3.
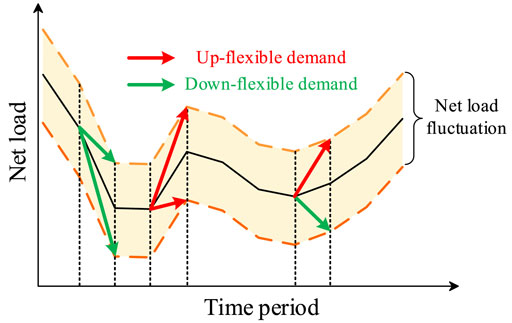
FIGURE 3. System demand for flexibility.
The range of net load fluctuation is calculated from the forecasting errors of wind power and load, and thus the system demand for flexibility is acquired, as shown in Eqs 19–21.
where
At different timescales, the system demand for flexibility varies with the forecasting accuracy of the wind and load. As the timescale continues to shorten, the forecasting accuracy of the wind power and load continues to improve, the forecasting error decreases, and the system demand for flexibility decreases.
4.2 Intra-day 4-h tight power balance disposal strategy
The intra-day 4-h TPB disposal strategy is formulated once every 4 h with a time resolution of 15 min. Based on the intra-day 4-h wind power and load forecasting data, the thermal unit start-up and shutdown statuses and power output, charging and discharging statuses, and power of the EV charging station, system reserve, and flexible ramp are all updated for the next 4 h.
4.2.1 Objective function
The objective function of the intra-day 4-h TPB disposal strategy is to minimize the total system operation cost, which includes the thermal unit operation cost, EV charging station operation cost, load shedding cost, and wind spillage cost, as shown in Eqs 22–27.
Eq. 22 is the total system operation cost; Eq. 23 is the thermal unit operation cost, which includes the thermal unit fuel cost, start-up cost, reserve, and flexible ramp cost; Eq. 24 is the thermal unit fuel cost; Eq. 25 is the EV charging station operation cost, which includes the EV charging station discharging cost, battery depreciation cost, reserve, and flexible ramp cost; Eq. 26 is the EV charging station battery depreciation cost, while Eq. 27 is the load shedding and wind spillage cost.
where, in Eq. 22,
4.2.2 Constraints
4.2.2.1 Thermal unit operational constraints
The thermal unit operation constraints include the thermal unit up-ramping and down-ramping capacity constraints, shown in Eqs 28, 29, and the thermal unit output maximum and minimum constraints, shown in Eqs 30, 31.
where
4.2.2.2 Operational constraints of EV charging stations
The electric vehicle charging station operation constraints have been listed in Eqs 1–18 and are, therefore, not presented here.
4.2.2.3 Wind power unit operational constraints
The wind power unit operation constraints include the wind power unit's maximum and minimum output and system wind spillage constraints, as shown in Eqs 32, 33, and the flexible ramping capacity offered by the wind power unit constraint is shown in Eq. 34:
where
4.2.2.4 System demand for up-flexible and down-flexible constraints
The demand of the system for flexibility can be supplied by thermal units, EV charging stations, and wind power units. In extreme scenarios, the system demand for flexibility can be offered by load shedding and wind spillage, which will cause a significant rise in the operation cost, as shown in Eqs 35–37.
where
4.2.2.5 System power supply–demand balance constraint
where
4.3 Intra-day 1-h tight power balance disposal strategy
The intra-day 1-h TPB disposal strategy is formulated once every 1 h with a time resolution of 15 min. Based on the start-up and shutdown statuses of the intra-day 4-h updated thermal unit and intra-day 1-h wind power and load forecasting data, the thermal unit's output, charging and discharging statuses, and power of the EV charging station, system reserve, and flexible ramp are updated for the next 1 h.
4.3.1 Objective function
The objective function of the intra-day 1-h TPB disposal strategy is basically the same as that of the intra-day 4-h TPB disposal strategy, but the start-up cost of the thermal units is not considered. The objective function minimizes the total system operation cost, which includes the thermal unit operation cost, EV charging station operation cost, load shedding cost, and wind spillage cost.
4.3.2 Constraints
The constraints of the intra-day 1-h TPB disposal strategy are basically the same as those of the intra-day 4-h TPB disposal strategy, which include the thermal unit operation constraints (Eqs 28–31), EV charging station operation constraints (Eqs 1–18), wind power, system flexibility, and load constraints (Eqs 19–21, 32–39), which are not presented here.
4.4 Real-time 15-min tight power balance disposal strategy
The real-time 15-min TPB disposal strategy is formulated once every 15 min with a time resolution of 15 min. Based on the start-up and shutdown statuses of the intra-day 4-h updated thermal unit and the real-time 15-min wind power and load forecasting data, the thermal unit output, charging and discharging statuses of the EV charging station, and power, system reserve, and flexible ramp are updated for the next 15 min.
4.4.1 Objective function
The objective function of the real-time 15-min TPB disposal strategy is to minimize the total operation adjustment cost between the real-time 15-min and intra-day 1-h TPB disposal, which include the thermal unit operation adjustment cost, EV charging station operation adjustment cost, load shedding cost, and wind spillage cost, as shown in Eqs 41–44.
Eq. 41 is the total operation adjustment cost of the system, and Eq. 42 is the thermal unit operation adjustment cost, which include the thermal unit output adjustment cost, reserve, and flexible ramp adjustment cost; Eq. 43 is the EV charging station operation adjustment cost, which include the EV charging station discharging adjustment cost, battery depreciation cost, reserve, and flexible ramp adjustment cost. Eq. 44 is the load shedding and wind spillage cost.
where
4.4.2 Constraints
The constraints of the real-time 15-min TPB disposal strategy are basically the same as those of the intraday 4-h strategy, which include the thermal unit operation constraints (Eqs 28–31), the EV charging station operation constraints (Eqs 1–18), the wind power, system flexibility, and load constraints (Eqs 19–21, 32–39), which are not presented here.
5 Numerical example
In this study, numerical simulations were conducted on a modified IEEE 118-bus system (Cui, et al., 2017) to verify the effectiveness of the proposed TPB multi-timescale disposal strategy. The EV charging stations were aggregated into 10 charging stations, each comprising 13,500 charging spots, integrated into the grid. Wind power output, load forecasting data, and actual data were extracted from the study by Heydarian-Forushani et al. (2018). The thermal unit reserve, flexible ramp capacity, and cost were obtained from the study by Heydarian-Forushani et al. (2015). The load shedding and wind spillage costs were 200 $ MWh−1 and 40 $ MWh−1, respectively (Heydarian-Forushani, et al., 2018). To simulate EV charging station uncertainty, the number of EVs in the EV charging stations, SOE, and capacity of the EV charging stations were acquired. The EV charging station parameters are presented in Table 1 (Heydarian-Forushani, et al., 2018). The proposed TPB multi-timescale disposal strategy for wind integrated power systems considering EV charging stations was implemented on MATLAB R2018a using the YALMIP toolbox and solved by the ILOG CPLEX 12.8 on a personal Dell computer with an Intel 2.6-GHz dual-core processor and 6 GB of RAM. For each TPB multi-timescale disposal strategy in the numerical simulations, the optimal solutions were found within 562 s.
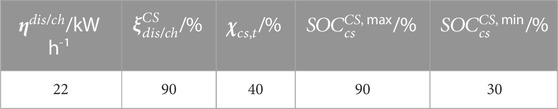
TABLE 1. EV charging station parameters.
5.1 Analysis of tight power balance multi-timescale disposal results
On a multi-timescale, to investigate the impact of the integration of EV charging stations on load shedding and wind spillage problems, four cases were set up to analyze the results, as presented in Table 2.
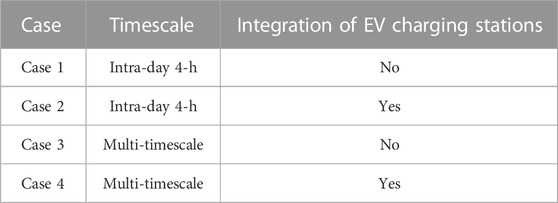
TABLE 2. Intra-day 4-h and multi-timescale TPB disposal.
For different cases, the total system operation cost, load shedding, wind spillage, thermal unit flexible ramp, and thermal unit flexible ramp savings are listed in Table 3. The thermal unit flexible ramp saving indicates the flexible ramping capacity offered by the EV charging stations.
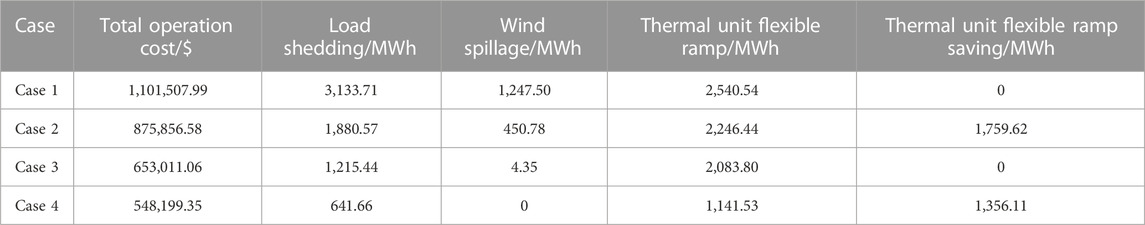
TABLE 3. TPB multi-timescale disposal results.
First, we analyze the impact of the integration of EV charging stations. According to Table 3, Case 2 shows a 20.49% reduction in the total system operation cost, 39.99% reduction in load shedding, and 63.87% reduction in wind spillage when compared to Case 1. Case 4 shows a 16.05% reduction in the total system operation cost, 47.21% reduction in load shedding, and 100% reduction in wind spillage when compared to Case 3. Owing to the flexibility offered by EV charging stations, the secure and economic operation of the system is improved. Accordingly, the integration of EV charging stations can effectively address the TPB problem.
Subsequently, the impact of different timescale disposal strategies is analyzed. The results are evident by comparing the intra-day 4-h and multi-timescale disposal strategies. Without the integration of EV charging stations, Case 3 shows a 40.72% reduction in the total system operation cost, 61.21% reduction in load shedding, and 99.65% reduction in wind spillage when compared to Case 1. With the integration of EV charging stations, Case 4 exhibits a 37.41% reduction in the total system operation cost, 65.88% reduction in load shedding, and 100% reduction in wind spillage when compared to Case 2. Accordingly, the multi-timescale TPB disposal reduces the total system operation cost, load shedding, and wind spillage to varying degrees when compared to the intra-day 4-h.
The intra-day 4-h thermal unit output and multi-timescale thermal unit output adjustments are illustrated in Figure 4. According to Figure 4, the total adjustments of the intra-day 4-h and multi-timescale thermal unit outputs are 1777.86 and 628.41 MW, respectively. The total multi-timescale thermal unit output adjustment is less than that of the intra-day 4-h output. The intra-day 4-h thermal unit output adjustment significantly increases in periods 5 and 15, and the multi-timescale thermal unit output adjustment significantly increases in period 5. The situation is caused by the varying forecasting accuracies of the wind power output and load at different timescales. In certain periods, the forecasting results of different timescales can deviate significantly, which increases the thermal unit output adjustment. The intra-day 4-h and multi-timescale load shedding for each period are depicted in Figure 5. The multi-timescale load shedding for each period is much less than that of intra-day 4-h.
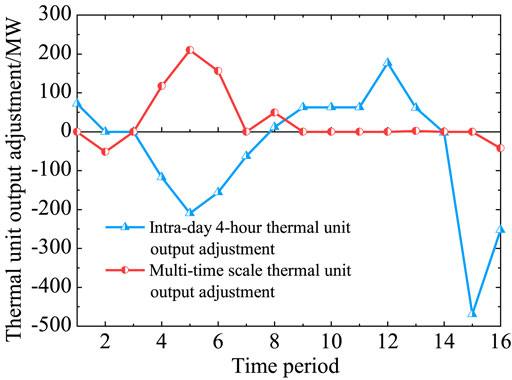
FIGURE 4. Thermal unit output adjustment at different timescales.
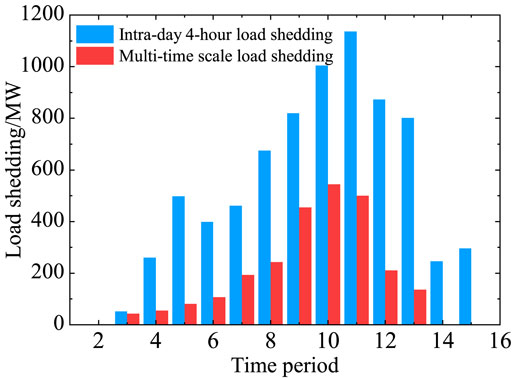
FIGURE 5. Load shedding at different timescales.
The aforementioned analysis shows that the proposed multi-timescale TPB disposal can promote the disposal level of the TPB and reduce the thermal unit output adjustment more effectively than the intra-day 4-h TPB disposal strategy.
5.2 Comparison of different EV scales
To investigate the impact of different EV scales on the TPB multi-timescale disposal results, this section establishes ten scenarios of EV scales from 20% to 200% of the initial EV scale. Under the ten scenarios, the total operation cost, thermal unit flexible ramp saving, and load shedding are illustrated in Figures 6, 7.
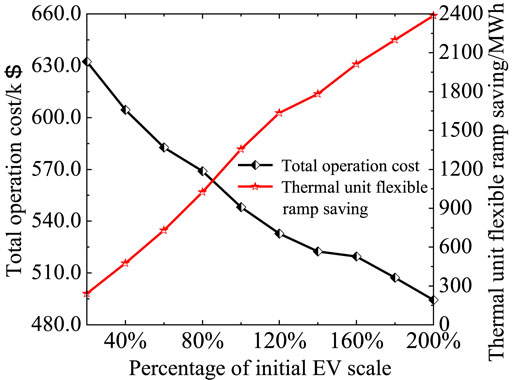
FIGURE 6. Impact of different EV scales on the total operation cost and thermal unit flexible ramp saving.
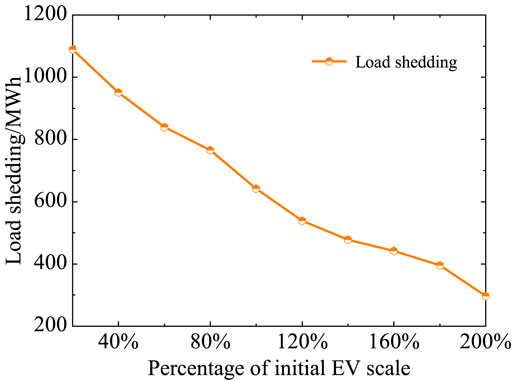
FIGURE 7. Impact of different EV scales on load shedding.
According to Figures 6, 7, as the EV scale increases, the total operation cost and load shedding decrease, and the thermal unit flexible ramp saving increases. Therefore, an increase in the EV scale promotes the disposal level of the TPB and enhances the economic operation of the system.
5.3 Comparison of different wind power scenarios
To investigate the impact of different wind power scenarios on TPB’s multi-timescale disposal, three wind power scenarios are set up in this section, as shown in Figure 8.
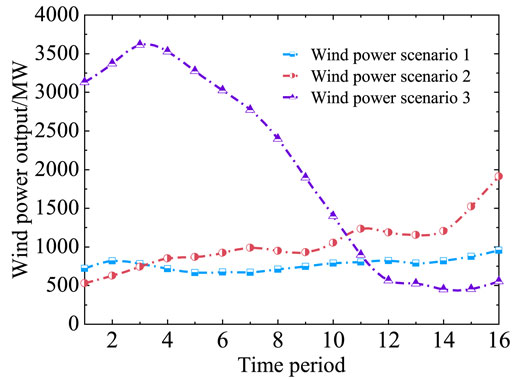
FIGURE 8. Three different wind power scenarios.
Wind power scenario 1: the penetration rate of wind power is 10.75%. Wind power scenario 2: the penetration rate of wind power is 21.51%. Wind power scenario 3: the penetration rate of wind power is 40.66%.
The total system operation cost, load shedding, wind spillage, thermal unit flexible ramp, and thermal unit flexible ramp savings under the three wind power scenarios are listed in Table 4.
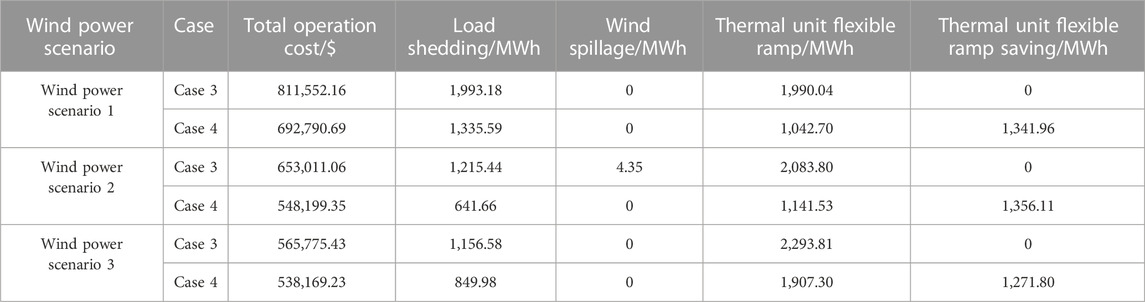
TABLE 4. TPB multi-timescale disposal results of three wind power scenarios.
According to Table 4, in the case of multi-timescale disposal without the integration of EV charging stations, that is, Case 3, Wind power scenario 1 exhibits the highest total operation cost and load shedding; Wind power scenario 2 has an intermediate total operation cost and load shedding; and Wind power scenario 3 has the lowest total operation cost and load shedding. In the case of multi-timescale disposal with the integration of EV charging stations, that is, Case 4, the total system operation cost, load shedding, wind spillage, thermal unit flexible ramp, and thermal unit flexible ramp savings of each wind power scenario are all decreased to a certain extent.
Therefore, the integration of EV charging stations for multi-timescale disposal can promote the disposal level of TPB under different wind power scenarios. The aforementioned analysis indicates that the proposed strategy can be applied to different wind power scenarios, thereby verifying the effectiveness of the proposed strategy.
5.4 Comparison of different load shedding rates
To analyze the impact of different load shedding rates on the TPB multi-timescale disposal results, the total operation cost under different load shedding rates is shown in Figure 9.
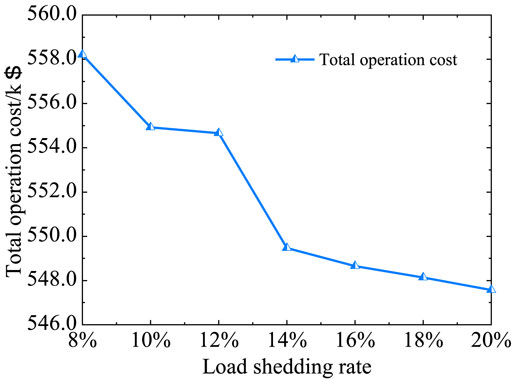
FIGURE 9. Impact of different load shedding rates on the total operation cost.
According to Figure 9, as the load shedding rate increases, the total operation cost shows a decreasing trend. Therefore, the increase in load shedding rate improves the economic and security operation of the system. In addition, when the load shedding rate falls below 6% due to insufficient load shedding, the system power balance constraint cannot be met, and the proposed strategy becomes unsolvable. Therefore, to ensure the solvability of the proposed strategy, the load shedding rate should be more than 6%.
6 Conclusion
In this article, a TPB multi-timescale disposal strategy considering an EV charging station that offers flexible ramping capacity is proposed to address the TPB problem at different timescales. By analyzing the simulation results, the following conclusions can be drawn:
1) The integration of EV charging stations can offer flexible ramping capacity to the power system, thereby effectively addressing the TPB problem. The increase in the EV scale promotes the disposal level of the TPB and enhances the economic operation of the system.
2) The accuracy of wind power and load forecasting increases with a decrease in the forecasting timescale. Compared with single-timescale TPB disposal, multi-timescale TPB disposal can significantly reduce system load shedding and wind spillage.
3) Multi-timescale disposal with the integration of EV charging stations can promote the disposal level of the TPB problem under different wind power scenarios. The analysis of the simulation results indicates that the proposed strategy can be applied to different wind power scenarios, thereby verifying its effectiveness.
The focus of this article was to address the TPB issue at multi-timescales and propose a TPB multi-timescale disposal strategy for wind-integrated systems considering EV charging stations. The future research direction can include: 1) investigating the application of other flexible resources, such as dispersed energy storage and thermostatically controlled loads, to the proposed TPB multi-timescale disposal strategy and 2) extending the proposed TPB multi-timescale disposal strategy with automatic generation control (AGC) to capture 1-min timescale variability and uncertainty of wind power output.
Data availability statement
The original contributions presented in the study are included in the article/supplementary material; further inquiries can be directed to the corresponding author.
Author contributions
SY conceptualized and formed the methodology. YC prepared the original draft. JX and SY reviewed and edited the manuscript. JX supervised the study. SY administered the project. All authors have read and agreed to the published version of the manuscript.
Funding
This research was funded by the Science and Technology Foundation of SGCC “Research on Real-time Warning and Co-disposal Strategy under Power Tight Balance State Considering Distributed Flexible Resources” (5100-202155476A-0-5-ZN).
Conflict of interest
Author SY was employed by the company China Electric Power Research Institute.
The remaining authors declare that the research was conducted in the absence of any commercial or financial relationships that could be construed as a potential conflict of interest.
Publisher’s note
All claims expressed in this article are solely those of the authors and do not necessarily represent those of their affiliated organizations, or those of the publisher, editors, and reviewers. Any product that may be evaluated in this article, or claim that may be made by its manufacturer, is not guaranteed or endorsed by the publisher.
References
Bagherinezhad, A., Khatami, R., and Parvania, M. (2020). Continuous-time look-ahead flexible ramp scheduling in real-time operation. Int. J. Electr. Power & Energy Syst. 119, 105895. doi:10.1016/j.ijepes.2020.105895
Baniasadi, A., Habibi, D., Bass, O., and Masoum, M. (2019). Optimal real-time residential thermal energy management for peak-load shifting with experimental verification. IEEE Trans. Smart Grid 10 (5), 5587–5599. doi:10.1109/TSG.2018.2887232
Bessa, R., Matos, M., Soares, F., and Lopes, J. (2012). Optimized bidding of a EV aggregation agent in the electricity market. IEEE Trans. Smart Grid 3 (1), 443–452. doi:10.1109/TSG.2011.2159632
Chang, Y., Xie, J., Qiu, C., and Ge, Y. (2022). A disposal strategy for tight power balance considering electric vehicle charging station providing flexible ramping capacity. IEEE Access 10, 119805–119813. doi:10.1109/ACCESS.2022.3220671
Cui, M., and Zhang, J. (2018). Estimating ramping requirements with solar-friendly flexible ramping product in multi-timescale power system operations. Appl. energy 225, 27–41. doi:10.1016/j.apenergy.2018.05.031
Cui, M., Zhang, J., Wu, H., and Hodge, B. (2017). Wind-friendly flexible ramping product design in multi-timescale power system operations. IEEE Trans. Sustain. Energy 8 (3), 1064–1075. doi:10.1109/TSTE.2017.2647781
Ding, X., Xu, J., Sun, Y., Liao, S., and Zheng, J. (2022). A demand side controller of electrolytic aluminum industrial microgrids considering wind power fluctuations. Prot. Control Mod. Power Syst. 7 (4), 49–763. doi:10.1186/s41601-022-00270-x
Ghaljehei, M., and Khorsand, M. (2022). Day-ahead operational scheduling with enhanced flexible ramping product: Design and analysis. IEEE Trans. Power Syst. 37 (3), 1842–1856. doi:10.1109/TPWRS.2021.3110712
Han, H., Wei, T., Wu, C., Zang, H., Sun, G., Wei, Z., et al. (2022). A low-carbon dispatch strategy for power systems considering flexible demand response and energy storage. Front. Energy Res. 10. doi:10.3389/fenrg.2022.883602
Heydarian-Forushani, E., Golshan, M., and Shafie-Khah, M. (2015). Flexible security-constrained scheduling of wind power enabling time of use pricing scheme. Energy 90, 1887–1900. doi:10.1016/j.energy.2015.07.014
Heydarian-Forushani, E., Golshan, M., Shafie-khah, M., and Siano, P. (2018). Optimal operation of emerging flexible resources considering sub-hourly flexible ramp product. IEEE Trans. Sustain. Energy 9 (2), 916–929. doi:10.1109/TSTE.2017.2766088
Hu, C., Cai, Z., Zhang, Y., Yan, R., Cai, Y., and Cen, B. (2022). A soft actor-critic deep reinforcement learning method for multi-timescale coordinated operation of microgrids. Prot. Control Mod. Power Syst. 7 (3), 29–432. doi:10.1186/s41601-022-00252-z
Khoshjahan, M., Dehghanian, P., Moeini-Aghtaie, M., and Fotuhi-Firuzabad, M. (2019). Harnessing ramp capability of spinning reserve services for enhanced power grid flexibility. IEEE Trans. Industry Appl. 55 (6), 7103–7112. doi:10.1109/TIA.2019.2921946
Khoshjahan, M., Moeini-Aghtaie, M., Fotuhi-Firuzabad, M., Dehghanian, P., and Mazaheri, H. (2020). Advanced bidding strategy for participation of energy storage systems in joint energy and flexible ramping product market. IET Generation, Transm. Distribution 14 (22), 5202–5210. doi:10.1049/iet-gtd.2020.0224
Li, W., Liang, R., Luo, F., Feng, S., Yang, B., Liu, Z., et al. (2022). Response potential assessment of user-side flexible resources of regional power distribution networks based on sequential simulation of optimal operation. Front. Energy Res. 10. doi:10.3389/fenrg.2022.1096046
Mirzaei, M. A., Sadeghi-Yazdankhah, A., Mohammadi-Ivatloo, B., Marzband, M., Shafie-khah, M., and Catalão, J. P. (2019). Integration of emerging resources in IGDT-based robust scheduling of combined power and natural gas systems considering flexible ramping products. Energy 189, 1–116195. doi:10.1016/j.energy.2019.116195
Mueller, F., Woerner, S., and Lygeros, J. (2019). Unlocking the potential of flexible energy resources to help balance the power grid. IEEE Trans. Smart Grid 10 (5), 5212–5222. doi:10.1109/TSG.2018.2878998
Neyestani, N., Damavandi, M., Shafie-Khah, M., Contreras, J., and Catalão, J. (2015). Allocation of plug-in vehicles' parking lots in distribution systems considering network-constrained objectives. IEEE Trans. Power Syst. 30 (5), 2643–2656. doi:10.1109/TPWRS.2014.2359919
Nikoobakht, A., Aghaei, J., Shafie-Khah, M., and Catalao, J. P. (2019). Assessing increased flexibility of energy storage and demand response to accommodate a high penetration of renewable energy sources. IEEE Trans. Sustain. Energy 10 (2), 659–669. doi:10.1109/TSTE.2018.2843161
Olsen, K., Zong, Y., You, S., Bindner, H., Koivisto, M., and Gea-Bermúdez, J. (2020). Multi-timescale data-driven method identifying flexibility requirements for scenarios with high penetration of renewables. Appl. Energy 264, 114702. doi:10.1016/j.apenergy.2020.114702
Park, H., Huang, B., and Baldick, R. (2022). Enhanced flexible ramping product formulation for alleviating capacity shortage in look-ahead commitment. J. Mod. Power Syst. Clean Energy 10 (4), 850–860. doi:10.35833/MPCE.2020.000942
Shaaban, M., Tan, W., and Abdullah, M. (2018). A multi-timescale hybrid stochastic/deterministic generation scheduling framework with flexiramp and cycliramp costs. Int. J. Electr. Power & Energy Syst. 99, 585–593. doi:10.1016/j.ijepes.2018.02.004
Shafie-Khah, M., Heydarian-Forushani, E., Osório, G., Gil, F., Aghaei, J., Barani, M., et al. (2016). Optimal behavior of electric vehicle parking lots as demand response aggregation agents. IEEE Trans. Smart Grid 7 (6), 2654–2665. doi:10.1109/TSG.2015.2496796
Su, W., and Chow, M. (2012). Computational intelligence-based energy management for a large-scale PHEV/PEV enabled municipal parking deck. Appl. Energy 96, 171–182. doi:10.1016/j.apenergy.2011.11.088
Wang, Q., and Hodge, B. (2017). Enhancing power system operational flexibility with flexible ramping products: A review. IEEE Trans. Industrial Inf. 13 (4), 1652–1664. doi:10.1109/TII.2016.2637879
Wu, H., Shahidehpour, M., Alabdulwahab, A., and Abusorrah, A. (2015). Thermal generation flexibility with ramping costs and hourly demand response in stochastic security-constrained scheduling of variable energy sources. IEEE Trans. Power Syst. 30 (6), 2955–2964. doi:10.1109/TPWRS.2014.2369473
Yamujala, S., Jain, A., Sreekumar, S., Bhakar, R., and Mathur, J. (2022). Enhancing power systems operational flexibility with ramp products from flexible resources. Electr. Power Syst. Res. 202, 107599. doi:10.1016/j.epsr.2021.107599
Zhang, B., and Kezunovic, M. (2016). Impact on power system flexibility by electric vehicle participation in ramp market. IEEE Trans. Smart Grid 7 (3), 1285–1294. doi:10.1109/TSG.2015.2437911
Zhang, X., Che, L., Shahidehpour, M., Alabdulwahab, A., and Abusorrah, A. (2016). Electricity-natural gas operation planning with hourly demand response for deployment of flexible ramp. IEEE Trans. Sustain. Energy 7 (3), 996–1004. doi:10.1109/TSTE.2015.2511140
Keywords: tight power balance disposal strategy, wind-integrated power system, electric vehicle charging station, multi-timescale, flexible ramping capacity, load shedding, wind spillage
Citation: Yang S, Chang Y and Xie J (2023) Tight power balance multi-time scale disposal strategy for wind integrated system considering electric vehicle charging station. Front. Energy Res. 11:1163891. doi: 10.3389/fenrg.2023.1163891
Received: 11 February 2023; Accepted: 18 April 2023;
Published: 11 May 2023.
Edited by:
Yi Guo, ETH Zürich, SwitzerlandReviewed by:
Zhenkun Li, Shanghai University of Electric Power, ChinaJun Cao, Luxembourg Institute of Science and Technology (LIST), Luxembourg
Shiwei Xia, North China Electric Power University, China
Copyright © 2023 Yang, Chang and Xie. This is an open-access article distributed under the terms of the Creative Commons Attribution License (CC BY). The use, distribution or reproduction in other forums is permitted, provided the original author(s) and the copyright owner(s) are credited and that the original publication in this journal is cited, in accordance with accepted academic practice. No use, distribution or reproduction is permitted which does not comply with these terms.
*Correspondence: Jun Xie, anhpZUBoaHUuZWR1LmNu