 Peter Schillebeeckx1*
 M. Verwerft2
 P. Romojaro2
 G. Žerovnik3
 N. Messaoudi2G. Alaerts1
 L. Fiorito2K. Govers2J. Paepen1Y. Parthoens2B. Pedersen4A. Stankovskiy2
 G. Van den Eynde2R. Wynants1
- 1European Commission, Joint Research Centre (JRC), Geel, Belgium
- 2Belgian Nuclear Research Centre (SCK CEN), Mol, Belgium
- 3Jožef Stefan Institute (JSI), Ljubljana, Slovenia
- 4European Commission, Joint Research Centre (JRC), Ispra, Italy
A method to determine the neutron production rate of a spent nuclear fuel segment sample by means of non-destructive assay conducted under standard controlled-area conditions is described and demonstrated. A neutron well counter designed for routine nuclear safeguards applications is applied. The method relies on a transfer procedure that is adapted to the hot cell facilities at the Laboratory for High and Medium level Activity of SCK CEN in Belgium. Experiments with 252Cf(sf) sources, certified for their neutron emission rate, were carried out at the Joint Research Centre to determine the characteristics of the detection device. Measurements of a segment of a spent nuclear fuel rod were carried out at SCK CEN resulting in an absolute and non-destructive measurement of the neutron production rate avoiding any reference to a representative spent nuclear fuel sample to calibrate the device. Results of these measurements were used to study the performance of depletion codes, i.e., ALEPH2, SCALE, and Serpent2. The study includes a code-to-code and code-to-experiment comparison using different nuclear data libraries.
1 Introduction
Characterisation of spent nuclear fuel (SNF) is essential for the back-end of the fuel cycle to support a safe, secure, ecologic and economic handling, transport, storage and disposal of SNF. From operational safety perspectives, several quantities are to be known (Broadhead et al., 1995; Gauld and Ryman, 2001; Hu et al., 2016; Govers et al., 2019): the neutron and
The results of model calculations need to be validated and realistic confidence limits have to be determined (Rochman et al., 2023; Seidl et al., 2023). Both the validation and estimation of confidence limits require high quality experimental data. At present, such data are primarily based on a combination of destructive chemical and radiochemical analysis methods (OECD NEA, 2016; Michel-Sendis et al., 2017), involving various steps starting with the dissolution of the sampled material, affecting the final uncertainty of the results (OECD NEA, 2011). Data obtained by NDA are rather scarce and limited to the measurement of the decay power by calorimetry (McKinnon et al., 1986; Maeda et al., 2004; SKB, 2006; Murphy and Gauld, 2010). Most of the data originate from measurements at the calorimeter installed at Clab, the Swedish Interim Storage Facility (SKB, 2006; Murphy and Gauld, 2010). More extensive discussions on the use of these data are given in Romojaro (2023) and Ilas and Burns (2022).
In this work an absolute measurement of the production rate of prompt fission neutrons by a SNF segment is presented. The experiments were carried out at the Laboratory for High and Medium level Activity (LHMA) of SCK CEN, the Belgian nuclear research centre. A detailed description of the experimental procedures and conditions is reported in Schillebeeckx et al. (2020).
An absolute measurement of the neutron emission rate of a SNF segment is desribed by Perret et al. (2021). In that work the total emission rate including the contribution of (α,n) neutrons and neutron multiplication by neutron induced fission is determined. In the present work the neutron correlation technique applying the point model of Hage and Cifarelli (Hage and Cifarelli, 1985a; Hage and Cifarelli, 1985b; Cifarelli and Hage, 1986) is used to separate these contributions and determine the neutron production rate only due to spontaneous fission. A similar measurement, however, of a solution from reprocessed SNF was performed by Miura and Menlove (Miura and Menlove, 1994). Relative measurements of the total neutron emission rate are described in, e.g., Yokoyama et al. (1981), Prokopowicz and Pytel (2016) as a valuable tool to assess axial profiles of the burnup (BU). The latter is most often defined as the energy released per mass of heavy metal in the fuel. A detailed discussion on the BU of SNF can be found in another contribution to this issue (Žerovnik, 2023).
Neutron emission of spent UO2 fuel with a cooling time in the range of 2–50 years is dominated by spontaneous fission of 244Cm (Žerovnik et al., 2018). Therefore, results of neutron measurements can be used to validate the performance of codes to predict the 244Cm inventory as an alternative to radiochemical analysis that typically has an uncertainty above 5% (Zwicky et al., 2010; Gauld et al., 2016; Hu et al., 2017). Starting from fresh UO2 fuel, the most probable production path of 244Cm starts with the production of 239Pu by the 238U
Neutron emission is an important observable for nuclear safeguards applications to verify the plutonium content in SNF and reprocessed raffinates. Examples of passive NDA methods measuring the neutron emission of SNF assemblies are the FORK type of detectors (Rinard and Bosler, 1988) and the more advanced Differential Die-Away Self-Interrogation (DDSI) (Trahan et al., 2020) and Passive Neutron Albedo Reactivty (PNAR) (Tobin et al., 2018) systems. They are based on the neutron emission from spontaneous fission of 244Cm as primary neutron source. At present, these methods are primarely applied by nuclear safeguards authorities. They can also be used by nuclear power plant operators and safety authorities to verify the design and operation history of SNF assemblies input data for the estimatation or prediction of the nuclide inventory and related observables by depletion calculations. The design and calibration of such NDA systems strongly relies on theoretical calculations using neutron transport and depletion codes. The potential to predict the output of the FORK detector by depletion codes and to improve the verification of declared SNF characteristics is demonstrated in Vaccaro et al. (2018). Evidently, a quantitative interpretation of the calculated results requires a reliable depletion code (including the nuclear data), which has been validated by experimental data.
The design characteristics and irradition history of the sample are specified in Section 2. The depletion codes that were validated are described in Section 3. This section includes a code-to-code comparison and a study of the impact of nuclear data libraries. The detection system together with the determination of the main operating and performance characteristics using certified 252Cf(sf) sources are discussed in Section 4. The results of the measurements of the SNF segment sample are given in Section 5 together with a discussion of the calculated and experimentally determined neutron production rate. Section 6 summarises the main findings and provides an outlook.
In this paper, conventional uncertainty propagation based on normal distributions is applied (JCGM, 2008). All uncertainties are standard uncertainties quoted at a 68% confidence level and are given in standard compact notation (JCGM, 2008). For the use of cross section data from the evaluated nuclear data libraries (e.g., ENDF/B, JEFF and JENDL) we refer to the JANIS website maintained by the Nuclear Energy Agency of the OECD (OECD NEA, 2023).
2 Characteristics of the SNF segment sample
A segment sample was taken from a SNF rod that was irradiated in the Tihange 1 PWR during cycles 20 (from April 1998 until August 1999) and 21 (from September 1999 until March 2001). The study of this rod is part of the Rod-Extremity and Gadolinia AnaLysis (REGAL) program coordinated by SCK CEN (Eysermans et al., 2022). The assembly from which the rod (i.e., rod D05) was taken, was an AFA 2G assembly type manufactured by AREVA. It consists of a 15 × 15 array of fuel rods with 21 guide tubes for insertion of control rods or instrumentation. It contains 188 UO2 rods (4.5 wt% 235U/U) and 16 (U,Gd)Ox fuel rods (10 wt% Gd2O3/(U,Gd)Ox and 2 wt% 235U/U). At the end of both cycles, after approximately 450 days, stretch-out operations took place for an additional period of about 50 days, showing a progressive decrease of the core power and coolant temperature to maintain core criticality. Because control rods are fully withdrawn during stretch-out, this stage presents power peaking in the upper zone of the core (positive axial off-set). More details of the irradiation history, fuel composition and geometry are reported in Eysermans and Verwerft (2022).
The rod average burnup, which was reconstructed from core mapping calculations and the reactor power history, was calculated as slightly above 50 MWd/kg. The rod has been used in various research projects, with samples taken for different types of investigations (Verwerft et al., 2014; Lemmens et al., 2017; Adriaensen et al., 2020; Mennecart et al., 2020; Eysermans et al., 2022). The axial variation of the BU was verified by a
The sample for the neutron measurements was taken from the region between 2,056 mm and 2,108 mm from the rod bottom end. The characteristics of the sample are reported in Table 1. The main uncertainty of the net weight of the fuel material is due to the uncertainty on the state of the cladding: uncertainty of the wall thickness, degree of oxidation and presence of deposits.
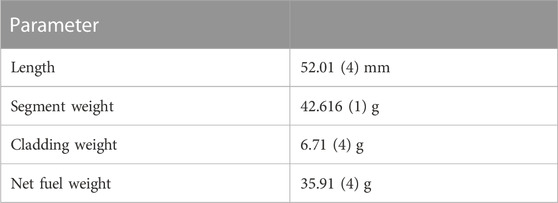
TABLE 1. Characteristics of the SNF segment sample that was used for the neutron measurements at the LHMA facilities of SCK CEN.
A sample for a burnup analysis was taken from the region between 1819 mm and 1842 mm. The results of the burnup analysis are reported in Eysermans et al. (2022), Govers et al. (2022) and summarised in Table 2. The inventory of 137Cs, 143+144Nd, 145+146Nd, 148Nd and 150Nd for this sample was determined by radiochemical analysis. The uncertainty of the weighted average burnup is the combined standard uncertainty due to the sampling, weighing, dilution processes and nuclide inventory analysis. In the calculation of the weighted average of the burnup and its uncertainty the presence of common uncertainty components were taken into account. The average count rates resulting from the
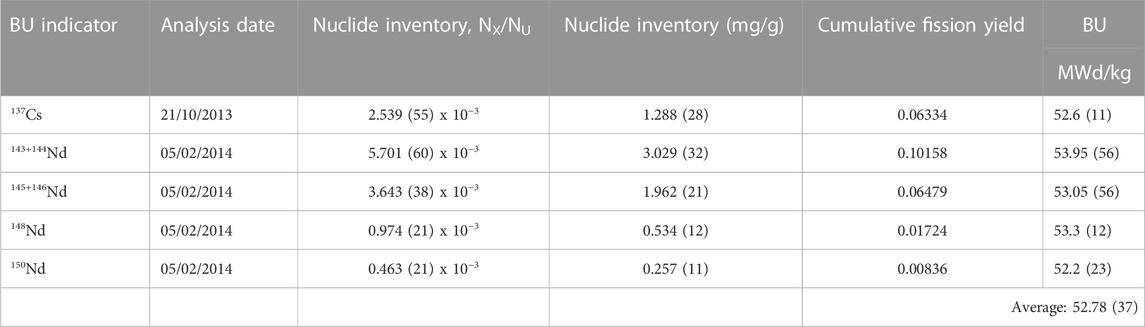
TABLE 2. Results of a radiochemical analysis of a SNF segment sample taken in the region between 1819 mm and 1842 mm for a cooling time of 4,630 days (Adriaensen and Dobney, 2020). The nuclide inventory (NX) is expressed relative to the initial number of U atoms (NU) and relative to the total weight of the fuel, i.e., including the oxygen. The BU is expressed relative to the initial amount of uranium. The irradiation-averaged fission yields were calculated using the irradiation history as input (Eysermans et al., 2022; Eysermans and Verwerft, 2022) according to the method described in (Govers et al., 2022). The BU values were derived from the inventory assuming 200 MeV per fission. The uncertainties of the BU reflect solely those of the nuclide inventory.
3 Depletion calculations
The neutron production rate by spontaneous fission and (α,n) reactions in the SNF sample together with the inventory of 137Cs, 148Nd and the main contributors to the neutron production were estimated using ALEPH2, SCALE and Serpent2. The impact of nuclear data was verified using Serpent2 combined with different nuclear data libraries.
3.1 Description of depletion codes and usage
ALEPH2 is a Monte Carlo burnup code developed at SCK CEN (Stankovskiy and Van den Eynde, 2012). It couples the Monte Carlo particle transport code MCNP with a deterministic fuel depletion algorithm based on the RADAU5 solver using an implicit 5th order Runge-Kutta method (Hairer and Wanner, 1999). The results presented in this work were obtained with ALEPH version 2.8 using MCNP-6.2 (Werner, 2017). Serpent2 (Leppänen et al., 2015; Tuominen et al., 2019) is a particle transport and fuel depletion code developed at VTT, the Technical Research Centre of Finland. The work in this study was performed with code version 2.2.0. Serpent2 uses the Chebyshev Rational Approximation Method (CRAM) (Pusa, 2016) to simulate the fuel depletion. SCALE is a modelling and simulation suite for nuclear safety analysis and design developed by ORNL, the Oak Ridge National Laboratory of the United States (Rearden and Jessee, 2017). In this study calculations were performed with SCALE version 6.2.2, using the TRITON depletion sequence and coupling the KENO-V.a neutron transport modules with the ORIGEN depletion solver.
To reduce bias effects in the code-to-code comparison a set of common design properties and irradiation conditions were defined to produce similar input models for the ALEPH2, SCALE and Serpent2 codes. The following common properties and conditions, which were also assumed in Eysermans et al. (2022), were adopted:
- cross sections are Doppler-broadened at 600 K for the coolant and cladding and at 900 K for the fuel;
- a constant coolant density was evaluated according to the coolant pressure and the irradiation-averaged temperature at the sample height;
- a constant boron concentration of 500 wt. ppm–corresponding to the irradiation-averaged concentration–is used;
- the smeared density of the fuel was used. In the case of burnable poison rods, the theoretical density of the blend was taken;
- since the density of the cladding material (M5) was not known, Zircaloy-4 was used as cladding material.
In addition, a number of simplifications and user’s choices independent from the burnup code were adopted and are reported below.
A 2D assembly model (infinite lattice) was adopted to reproduce the fuel assembly geometry. Reflective conditions were applied at the assembly boundaries. Hot dimensions were modelled with all codes for the assembly pitch and for the rod pitch, to account for the spacer grid thermal expansion.
Different choices were made on the spatial discretization of the Bateman equations into so-called depletion zones. In the Serpent2, SCALE and ALEPH2 models each fuel rod–either UO2 or gadolinia rod–was treated as an independent depletion zone. A concentric equi-volume radial meshing (16 depletion zones in SCALE and 5 depletion zones in ALEPH2 and Serpent2) of the burnable poison rods and of the fuel rod D05 was implemented to better characterize the effective neutron fluence rate and, hence, burnup peaks at the pellet periphery for UO2 fuel, inwards “onion-peeling” or “shell-like” depletion of 155Gd and 157Gd in burnable poison rods. Therefore, both choices should give similar results. The irradiation history of the sample in fuel rod D05 was incorporated in all models using depletion steps shorter than 1 MWd/kg.
ALEPH2 uses the Monte Carlo code MCNP-6.2 (Werner, 2017) for the neutron transport calculations and determines the neutron fluence and its energy distribution using a fine energy structure. The latter is used together with energy dependent cross sections to calculate spectrum averaged reaction rates that are fed into the Bateman equation solver. A total of 105 neutron histories per batch and 225 active batches were used. The same approach and same number of neutron histories were used for the Serpent2 calculations. In the SCALE calculation the neutron transport was performed using the Monte Carlo package KENO-V.a in multi-group mode, using 238 energy groups. For these calculations 20,000 histories per batch and 5,000 active batches were used. With these specifications, the uncertainty of the 244Cm inventory due to Monte Carlo counting statistics is less than 0.5%.
The neutron fluence was normalized to the power history that was determined for the sample in fuel rod D05. For the ALEPH2 and Serpent2 calculations the power history was normalised to match the experimental inventory for 148Nd in Table 2. For the SCALE calculation this inventory was slightly underestimated by 0.11%. This approach reduces the bias associated to the different energy deposition algorithms implemented in the burnup codes, and to the related user’s choices.
The calculations were carried out using different nuclear data libraries for neutron induced cross sections, fission product yields and radioactive decay data, i.e., JEFF-3.1.2, JEFF-3.3, JEFF-4T1, ENDF/B-VII.0, ENDF/B-VII.1, ENDF/B-VIII.0, JENDL-4.0u, and JENDL-5.0. The method and nuclear data used for the production of (α,n) neutrons in SCALE are adopted from the SOURCES code (Shores, 2000; Wilson et al., 2009). The corresponding thick target yields (TTY) were combined with the Serpent2 nuclide vector to determine the (α,n) contribution. The neutron emission by (α,n) reactions in ALEPH2 is derived by combining microscopic (α,n) cross sections with alpha-particle stopping powers from ASTAR (NIST, 2023). Table 3 compares the specific neutron emission rates resulting from the microscopic cross sections in TENDL-2015 (OECD NEA, 2023) and JENDL-AN/2005 (Murata et al., 2006) with those of SCALE. The data in Table 3 reveal that the specific neutron emission rates in SCALE are on average about 5% and 10% larger compared to those calculated in ALEPH2 using the JENDL-AN/2005 and TENDL-2021 libraries, respectively. For the ALEPH2 calculations the JENDL-AN/2005 cross sections were used.
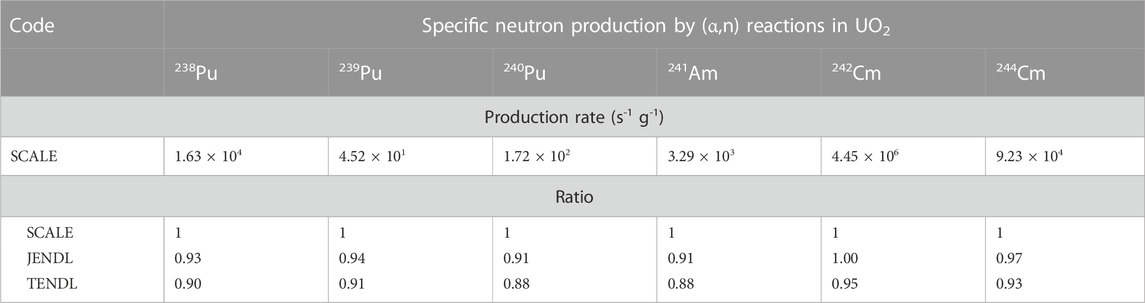
TABLE 3. Specific neutron production by (α,n) reactions in UO2, i.e., neutron emission rate per mass of nuclide. The specific neutron emission rates adopted in SCALE are compared with those derived from a combination of stopping powers in ASTAR (NIST, 2023) and (α,n) cross sections in TENDL-2021 (OECD NEA, 2023) and JENDL-AN/2005 (Murata et al., 2006). The latter are given relative to those adopted in SCALE.
3.2 Results
The calculated inventory of 137Cs, 148Nd and 244Cm, BU and neutron emission rates are compared in Table 4. The data are for a cooling time of 6,437 days, which corresponds to the date of the neutron measurements. The neutron production rate associated to spontaneous fission results for 97.7% and 1.6% from 244Cm(sf) and 246Cm(sf), respectively. Hence, the uncertainty of the calculated production rate is strongly determined by the uncertainty of the 244Cm inventory. Results in Fiorito et al. (2015), Leray et al. (2016), Zu et al. (2016) and Rochman et al. (2018) show that at present this uncertainty is about 10% and mainly due to the uncertainty of the 242Pu(n,γ) and 243Am(n,γ) cross sections (Zu et al., 2016). An assessment of the status of cross section evaluations of the 238,240,241,242Pu isotopes in Nobre (2019) reveals that the evaluation procedures to estimate these cross sections for the latest versions of the main libraries did not include all experimental data. Hence, the status of these cross sections in the data libraries can be improved. The relative contribution to the neutron production rate resulting from (α,n) reactions is estimated to be about 2%. This contribution is dominated by the α-decay of 244Cm, 238Pu and 241Am, i.e., for 41%, 32%, and 22%, respectively. Details about the production paths of the nuclides contributing to the neutron production are given in Fiorito et al. (2021). Their recommended decay properties are given in DDEP (2023).
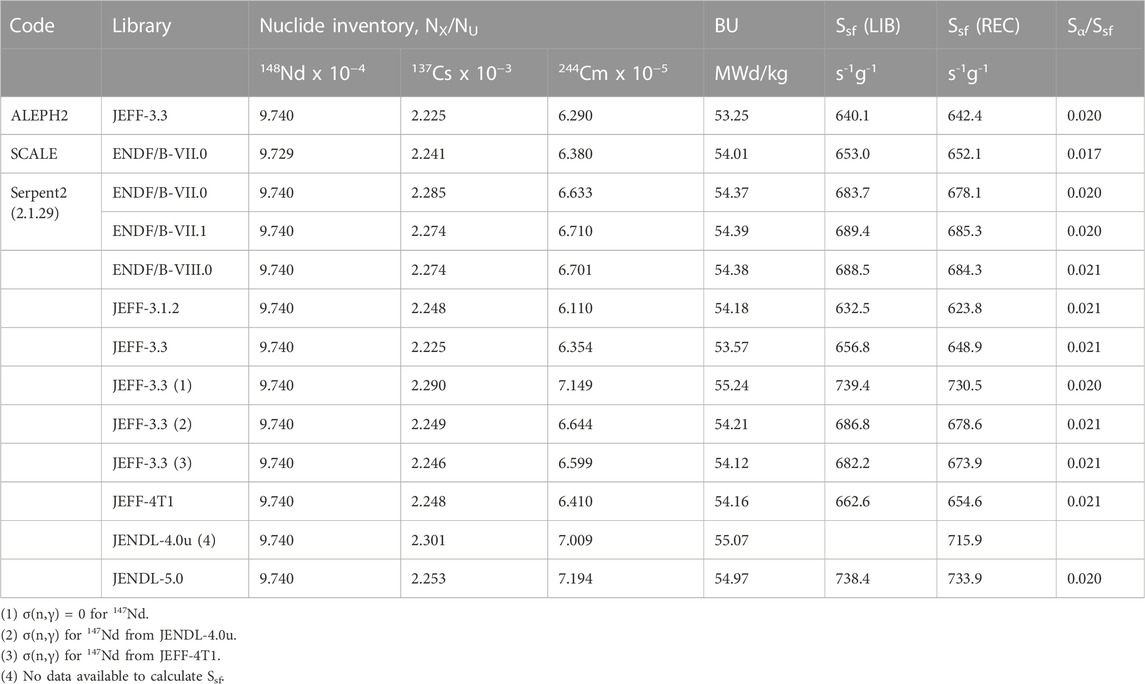
TABLE 4. Nuclide inventory for 148Nd,137Cs and244Cm, BU and neutron production due to spontaneous fission Ssf and (α,n) reactions Sα. Results obtained with ALEPH2, SCALE and Serpent2 using different nuclear data libraries are given. The Ssf rates are derived by using the data in the library and the decay data and neutron emission data recommended in DDEP (2023) and Santi and Miller (2008).
Since for the calculations with ALEPH2 and Serpent2 the same assumptions and conditions were used to produce the input model, there is a very good agreement between their results when using the same nuclear data library. The 137Cs inventory is identical. The small difference of 0.6% in BU is most probably due to a difference in energy production nuclear data. The difference of 1% in 244Cm inventory is found back in the neutron emission rate using the recommended decay and neutron emission nuclear data. The larger difference in calculated neutron emission rates of about 2.5% using the specified JEFF-3.3 nuclear data library suggests that not all nuclear data can be traced back to the same library. This effect together with the small difference in 244Cm inventory requires further investigation. The difference between ALEPH2 and SCALE using the ENDF/B-VII.0 library as reference library are larger. The 137Cs and 244Cm inventory differ by 2% and 4%, respectively, while the BU differs by less than 0.7%. Differences can be expected due to the model differences described in Section 3.1. However, they cannot explain the difference in, e.g., the 137Cs inventory which is most probably due to a difference in cumulative fission yields. It should be noted that some of the nuclear data in the SCALE version 6.2.2 differ from those in ENDF/B-VII.0 as discussed in more detail in the SCALE manual (Rearden and Jessee, 2017).
The results obtained with Serpent2 are used to study the effect of nuclear data. Due to the normalisation to the 148Nd inventory, nuclear data affecting this inventory will have a direct impact on other observables. The largest effect is observed for the 244Cm inventory and neutron production rate. This is due to the high relative sensitivity of the 244Cm inventory to the number of fissions, which is about 3.8 for the REGAL sample at the end of irradiation. The impact of the 147Nd(n,γ) reaction is illustrated by the results obtained with JEFF-3.3 and different data for the 147Nd(n,γ) cross section. Table 5 shows that the spectrum averaged cross sections derived from the cross section in JENDL-4.0u and JEFF-4T1, which are based on Suyama and Mochizuki (2005) and Rochman et al. (2016), respectively, are lower compared to those derived from the other libraries. A reduction of the 148Nd production by the 147Nd(n,γ) reaction will be compensated by an increase in the number of neutron induced fission reactions. This results in an increase of the 137Cs and 244Cm inventory, the BU and neutron emission rate. A similar compensation effect occurs when the cumulative fission yields are changed. The difference in cumulative fission yields of 148Nd in Table 6 explains differences between the results derived with JENL-4.0u and those with JEFF-3.3 using the 147Nd(n,γ) cross section from JENDL-4.0u.
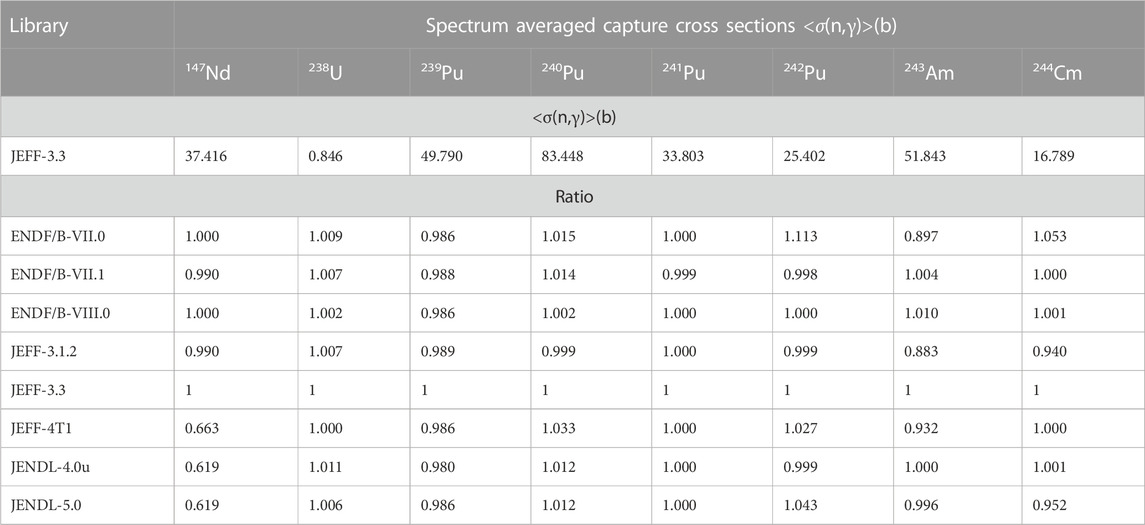
TABLE 5. Spectrum averaged capture cross sections <σ(n,γ)> for 147Nd,238U,239,240,241,242Pu,243Am and244Cm derived from the σ(n,γ) cross sections adopted in different libraries. The values derived from the JEFF-3.3 library are given together with the values derived from other libraries relative to those of JEFF-3.3.
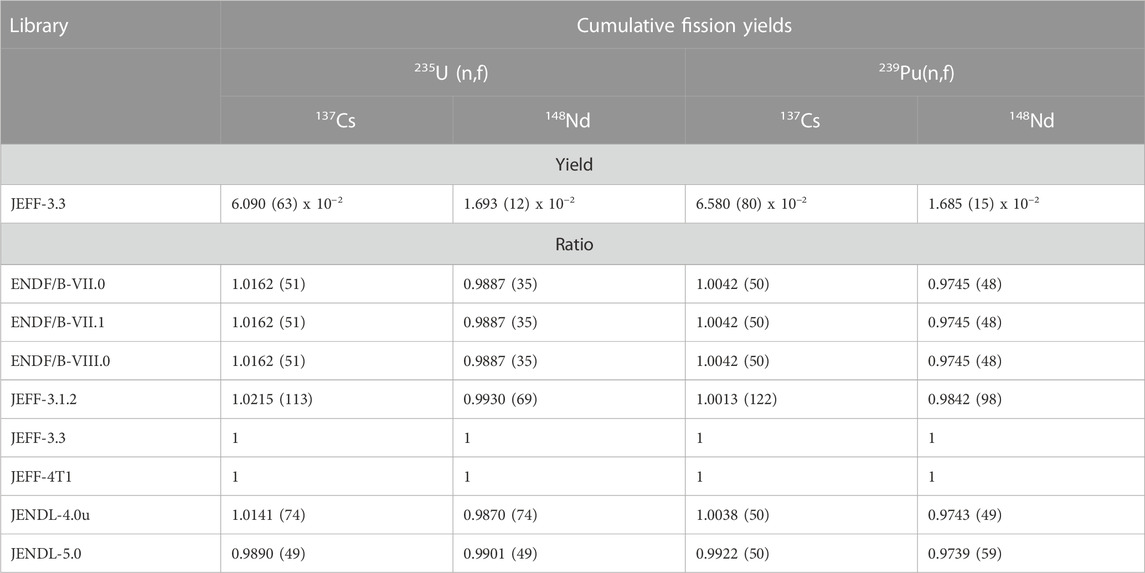
TABLE 6. Cumulative fission yields for 137Cs and148Nd for neutron induced fission of235U and239Pu by thermal neutrons adopted in different data libraries. The values derived from the JEFF-3.3 library are given together with the values derived from other libraries relative to those of JEFF-3.3.
The BU derived from the different code/libraries combinations varies between 53.33 MWd/kg and 55.07 MWd/kg. This suggests that a normalisation of calculated data to the delivered power can vary by 3.3% depending on the code and nuclear data library that is used. The observed variation can only partly be explained by differences in nuclear data influencing the 148Nd inventory. As mentioned before, the calculated BU in Table 4 also depends on assumptions made about the energy production due to neutron induced fission and some capture reactions. Note that the BU derived from the inventory of BU-indicators but not based on a full depletion calculation, such as those in Table 2, are often biased since they do not account for differences in the reaction processes contributing to the energy production. An extensive discussion on the determination of the BU is presented in Žerovnik (2023).
Evidently, the calculated 137Cs inventory is affected by both the normalisation and its cumulative fission yield. The ratio of the calculated and experimental 137Cs inventory varies between 0.982 and 1.016. The higher value obtained with JENDL-4.0u is due to the normalisation to the 148Nd inventory. The lower value when using the JEFF-3.3 library is consistent with the results in Eysermans et al. (2022). The reduction using the JEFF-3.3 library compared to JEFF-3.1.2 is due to the reduction of 2.1% in cumulative fission yield for 137Cs of JEFF-3.3 compared to the one in JEFF-3.1.1 (see Table 6). This reduction, which is almost twice the quoted uncertainty, requires a clarification from the evaluators. Unfortunately, the combined uncertainty of the experimental inventory is larger than the difference in adopted yields and cannot be used to make a judgement.
The results in Table 4 and Table 5 show that differences in the recommended 242Pu(n,γ) and 243Am(n,γ) cross sections result in differences in the theoretical estimates of the 244Cm inventory and neutron emission by spontaneous fission. The smaller estimates calculated with JEFF-4T1 compared to those obtained with JEFF-3.3 combined with the 147Nd(n,γ) cross section in JEFF-4. T1 are due to the reduction in the 243Am(n,γ) cross section. Due to the different processes involved in the 244Cm production compensating effects occur. E.g., the increase in 244Cm production by the 243Am(n,γ) reaction using the cross section in ENDF/B-VII.1 compared to ENDF/B-VII.0 is compensated by a reduction in 243Am inventory due to a smaller 242Pu(n,γ) cross section.
Table 4 compares the calculated neutron production rates provided by the codes, using the specified nuclear data library, and the rates derived from the calculated nuclide inventory using the half-life and branching for spontaneous fission recommended by the Decay Data Evaluation Project (DDEP) (DDEP, 2023) and the average number of prompt fission neutron from the evaluation of Santi and Miller (Santi and Miller, 2008). Apparently, none of the libraries adapted fully the values for the decay data and average number of prompt fission neutrons recommended by the DDEP (DDEP, 2023) and Santi and Miller (2008). A maximum difference of almost 1.5% is noticed for the results obtained with JEFF-3.1.2. Differences in nuclear data relevant for the estimation of the decay heat of SNF between the main libraries (JEFF, ENDF/B) and recommended decay libraries (ENSDF, DDEP) are also discussed by Doran et al. (2022).
4 Neutron detection system for SNF sample measurements
4.1 Experimental details
The neutron detection system is a transportable neutron well counter that is routinely used for nuclear safeguards verification measurements. The design is based on an Active Well Coincidence Counter (AWCC) device developed at the Los Alamos National Laboratory (US) (Menlove, 1979). A schematic representation with the transfer and transport containers inserted in the measurment position is shown in Figure 1. This figure is based on the MCNP input geometry using version 5.1.60 (X-5 Monte Carlo Team, 2005). The AWCC consists of 42 3He proportional counters embedded in polyethylene that is used as a neutron moderator. The counters are divided into six groups of seven counters. Each group is connected to one Amptek A111 hybrid charge sensitive preamplifier, discriminator and pulse shaper board (Swansen, 1985).
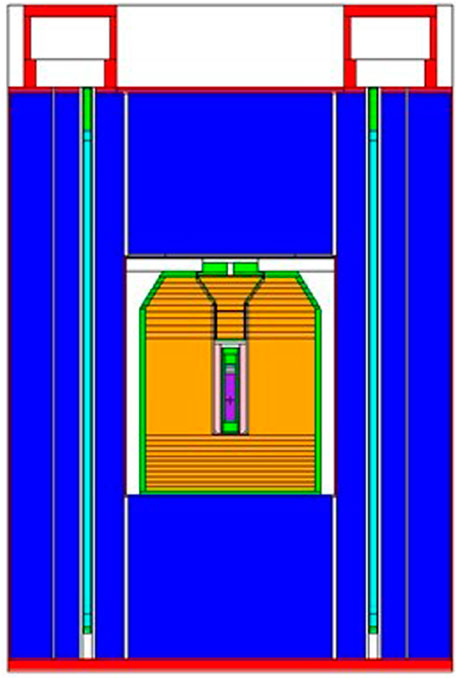
FIGURE 1. Schematic representation of the neutron detection system with the SNF segment sample in the transfer and transport containers. The figure is based on the MCNP input geometry using the version 5.1.60 (X-5 Monte Carlo Team, 2005). More details are given in Schillebeeckx et al. (2020).
The logic output of each board is send to a logic OR gate. The output of this OR gate is used as an input for a shift register (Swansen et al., 1980; Krick and Swansen, 1984) and a CAEN DT5751 digitiser (CAEN, 2023). The latter produced list-mode data of the time of arrival of each detected event and was used to register Rossi-alpha spectra. The JSR-12 shift register was used to register the total number of detected events and the number of events that are detected in two time windows that are opened (triggered) by each neutron detection event. The width of these windows, referred to as the gate width, was set to tg = 64 μs. The first window is opened a short time (or pre-delay) tp = 4.5 μs after each trigger event. The accumulated content, mostly referred to as “Reals + Accidentals” or “R + A”, is due to a contribution of real coincident events and accidental coincident events. The second gate is opened at a very long time delay after the first gate. Its content provides a direct measure of the accidental coincident events. From the counts in these two windows the recorded totals and reals rate are derived which are denoted by T and R, respectively.
Hot cell facilities are mostly not suited to accommodate a detection system as shown in Figure 1. Therefore, a dedicated procedure was developed to transfer a SNF sample from the hot cell to the neutron detection system eliminating the risk of contamination and minimising the radiation exposure of staff. A detailed description of the full detection system and the expected and measured radiation dose levels is given in (Schillebeeckx et al., 2020).
4.2 Characteristics derived from measurements with certified 252Cf(sf) sources
Experiments with radionuclide sources were carried out at JRC Ispra to determine the operating and performance characteristics of the neutron detection device that was developed for the SNF measurements, i.e., the well counter including the transfer and transport containers.
The count rate as a function of high voltage was derived for different measurement conditions including measurements with a 252Cf(sf) source combined with a 8 GBq 137Cs source and with the SNF segment sample. The high voltage plateau obtained with the SNF sample shows a clear reduction of the width due to the increased γ-ray pile-up background (Schillebeeckx et al., 2020). Therefore, the operating voltage for the experiments with the SNF sample was set at the lower edge of the plateau, i.e., at 2000 V (Schillebeeckx et al., 2020).
The main characteristics, i.e., the parameters for an empirical dead time correction, the gate fraction and detection efficiency, for the full detection system including transfer and transport containers were derived from measurements with compact 252Cf(sf) sources that were certified for their neutron production rate. The sources were produced from the same base material and encapsulated in an A3024 capsule type of Eckert and Ziegler (Eckert & Ziegler, 2023). The 248Cm decay product of the base material was separated on 16/09/2017. The isotopic composition of the base material at 30 January 2018 is given in Table 7. The sources were certified for the neutron production rate at NPL, the National Physical Laboratory (UK), based on measurements applying the manganese sulfate bath technique (Roberts and Parfitt, 2010) and using a detection system consisting of a moderating assembly combined with three 10BF3 proportional counters. The latter was calibrated with a standard source of a similar type for which the neutron emission rate was previously measured by the manganese bath technique. The certified production rates together with the neutron emission rate at the time of the calibration experiments with the neutron detection system are given in Table 8. The total uncertainty together with the contribution of the uncorrelated and correlated components are specified. For the calculation of the neutron emission rate at the time of experiments the isotopic composition was taken into account.
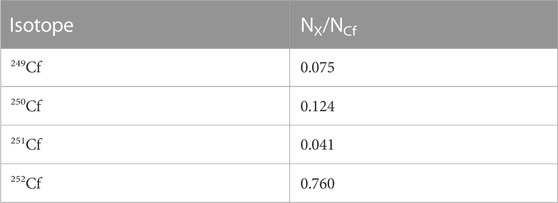
TABLE 7. Isotopic composition (relative number of atoms) of the Cf base material at 30/01/2018.
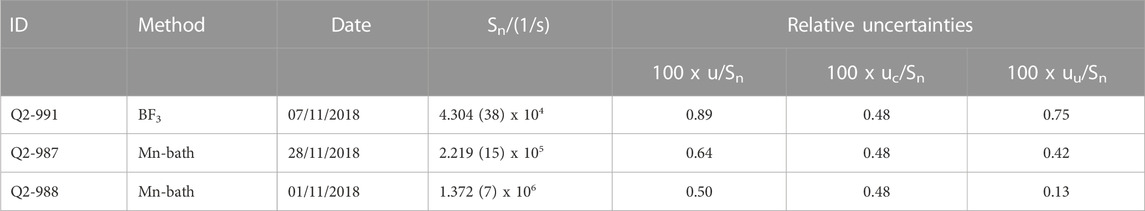
TABLE 8. Neutron emission rate (Sn) of the252Cf(sf) neutron sources that were certified for their emission rate at NPL. The total uncertainty (u) together with the correlated (uc) and uncorrelated (uu) components are given.
Theoretical estimates of the measured totals and reals rate denoted by Tm and Rm, respectively, can be expressed as:
with T0 and R0 the theoretical estimates of the singlets and doublets, respectively, and gT and gR factors to account for dead time effects in the counting system. In this work empirical expressions as a function of the measured totals rate have been used for these corrections [see Swansen et al. (1980), Krick and Swansen (1984)]:
with (d1, d2, d3, d4) free parameters. Applying the point model proposed by Hage and Cifarelli (Hage and Cifarelli, 1985a; Hage and Cifarelli, 1985b; Cifarelli and Hage, 1986) and Böhnel (Böhnel, 1975) the theoretical estimates of singlets T0 and doublets R0 are related to the detection efficiency εsf and the neutron emission properties of a spontaneous fission point source by (Croft and Henzlova, 2013):
with Ssf the production rate of prompt fission neutrons from spontaneous fission and
The factorial moments for prompt neutron emission and number of delayed neutrons after spontaneous fission of 252Cf and 244Cm together with the half-life and fraction for spontaneous fission for these nuclides are reported in Table 9. The normalised factorial moments at the time of the measurements (
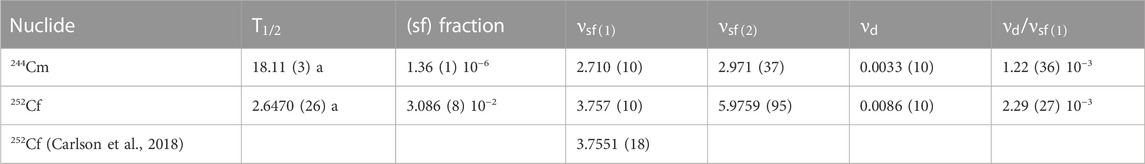
TABLE 9. Half-lives (DDEP, 2023), fraction for spontaneous fission (DDEP, 2023), normalised factorial moments derived from the multiplicity distribution of the prompt fission neutrons for 244Cm(sf) and252Cf(sf) in Santi and Miller (2008) and delayed neutron emission data from Nichols et al. (2008). The average total number of prompt fission neutrons for 252Cf(sf) resulting from the neutron standards project (Carlson et al., 2018) is also given.
A least squares fit was applied to adjust the dead time parameters, gate fraction and detection efficiency to the observed totals and reals rates with the neutron production rates, the factorial moments, total number of delayed fission neutrons and relative detection efficiency for delayed fission neutrons including their uncertainties as input data. A procedure proposed by Fröhner (Fröhner, 1997) was followed by considering all the input data, including nuclear data, together with their uncertainties on the same footing as the experimental data. In the fit, the correlated and uncorrelated uncertainty components of the certified neutron production rates were separated. This was realised by introducing a normalisation factor for the correlated uncertainty component. This factor together with its uncertainty was also treated as an experimental input.
The experimental data could be reproduced limiting the exponential exponents for the dead time correction in Eqs 3, 4 to the linear term, i.e., d2 = d4 = 0. The final parameters together with their uncertainties and correlation matrix are given in Table 10. From the values in Table 10 a ratio d3/d1 = 4.40 (25) is derived, which is within two standard deviations consistent with the common assumed ratio d3/d1 = 4 (Krick and Swansen, 1984). The gate fraction f = 0.6267 (45) is in very good agreement with the values that were derived in Schillebeeckx et al. (2020) from an analysis of the Rossi-alpha distribution. The gate fraction in Schillebeeckx et al. (2020) was determined by a parameterization of the Rossi-alpha distribution using a sum of two exponentials and by a direct numerical integration. This resulted in gate fractions f = 0.6268 (5) and f = 0.6278 (10), respectively. The detection efficiency εsf = 0.2859 (18) derived from the fit is in very good agreement with the detection efficiency εsf = 0.2852 (10) which was derived in Schillebeeckx et al. (2020) from the same experimental data, however, without any knowledge of the emission rate of the neutron sources. The main difference with the results of Schillebeeckx et al. (2020) are the uncertainties of the derived detector characteristics. The uncertainties in Schillebeeckx et al. (2020) are only due to counting statistics, while in the present analysis additional uncertainty components due to the certified neutron production rates are propagated. Note that the neutron production rates derived in Schillebeeckx et al. (2020) by an absolute method applying the point model of Hage and Cifarelli (Hage and Cifarelli, 1985a; Hage and Cifarelli, 1985b; Cifarelli and Hage, 1986) are within less than 1% fully consistent with the certified values in Table 8.
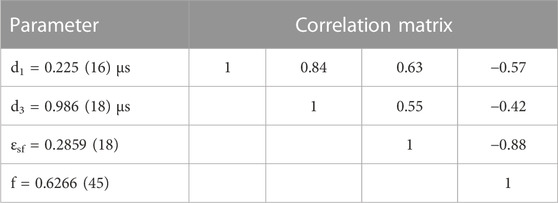
TABLE 10. Parameters for the empirical dead time correction, gate fraction and detection efficiency derived from measurements with certified 252Cf(sf) sources.
4.3 Characteristics for measurements with a SNF segment sample
The characteristics for measurements with the SNF sample were derived by combining experimental data with results of Monte Carlo simulations with MCNP using the version 5.1.60 (X-5 Monte Carlo Team, 2005).
Given the good agreement between the gate fraction derived from the least squares fit with the certified 252Cf(sf) sources and the one derived from the direct integration of the Rossi-alpha distribution, the gate fraction for the measurements with the SNF sample was determined from an integration of the Rossi-alpha distribution. This resulted in a fraction f = 0.6338 (45) (Schillebeeckx et al., 2020). The uncertainty was increased based on the results obtained with the 252Cf(sf) sources in Section 4.2.
To derive the detection efficiency for measurements with the cylindrical SNF segment sample from the one for a 252Cf(sf) point source Monte Carlo simulations were performed. This resulted in correction factors to account for the difference in geometry and difference in the energy distribution of the emitted neutrons. The results are reported in Table 11. In this table the ratio between the detection efficiency for a cylindrical SNF sample with the neutron emitting material homogeneously distributed in the sample and a 252Cf point source is given. The table also reports the detection efficiency for (α,n) neutrons, delayed fission neutrons and prompt fission neutrons due to neutron induced fission in the SNF sample relative to the detection efficiency for prompt fission neutrons from a 252Cf(sf) point source. The difference between the efficiency of prompt fission neutrons from the SNF sample and the 252Cf point source is mainly due to the geometry. Details about the calculations are given in Schillebeeckx et al. (2020). The results in Schillebeeckx et al. (2020) reveal that the impact of the assumptions made about the energy distribution of the neutrons and the radial distribution of the neutron emitting material in the sample is less than 0.2%.
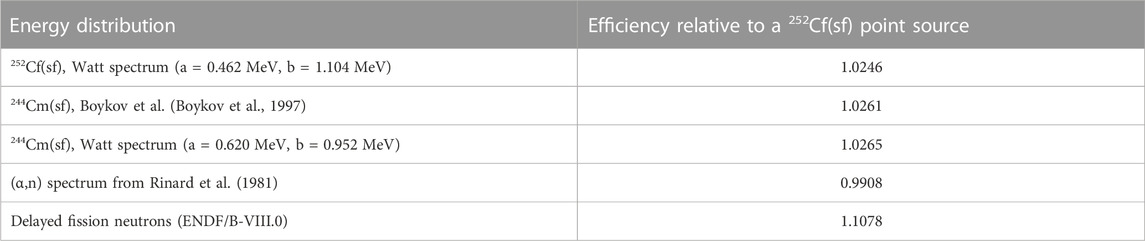
TABLE 11. Detection efficiency for (sf) and (α,n) neutrons, delayed fission neutrons from244Cm(sf) and prompt fission neutrons due to neutron induced fission in the SNF sample relative to the detection efficiency for prompt fission neutrons from a 252Cf(sf) point source. The uncertainties due to the simulated number of histories are smaller than the last significant digit.
5 Results and discussion
5.1 Results
The measurements to determine the neutron production rate of the SNF sample were carried out at the LHMA facility of SCK CEN on 15/10/2018, corresponding to a cooling time of 6,437 days. The totals and reals rates resulting from the measurements with the SNF sample are reported in Table 12 together with the applied dead time correction and background contributions. The background data in Table 12 are derived from results of repeated measurements during a period of 40 days. The uncertainties are the standard deviations of the repeated measurements. During the same period the stability of the device was verified by repeated measurements with a 252Cf(sf) point source. The standard deviation of the decay corrected neutron intensity derived from the totals and reals rates applying the point model of Hage and Cifarelli (Hage and Cifarelli, 1985a; Hage and Cifarelli, 1985b; Cifarelli and Hage, 1986) was 0.12%.
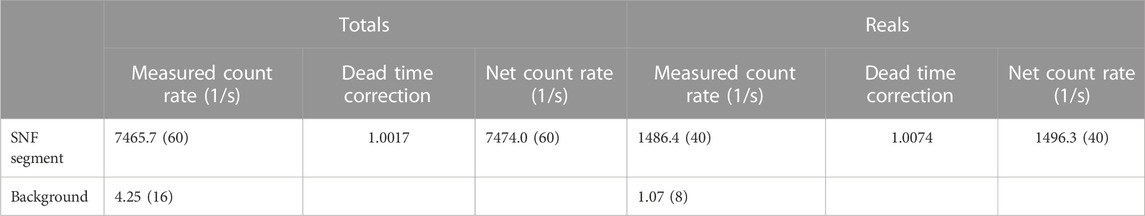
TABLE 12. Results of the SNF segment sample neutron measurements at the LHMA of the SCK CEN. The data were obtained for a cooling time of 6,437 days.
Following the point model developed by Hage and Cifarelli (Hage and Cifarelli, 1985a; Hage and Cifarelli, 1985b; Cifarelli and Hage, 1986) and in particular the event tree logic applied in Hage and Cifarelli (1985b), the totals and reals rate derived from the measurements with the SNF sample can be expressed as:
with:
-
-
-
-
-
-
-
-
-
-
-
-
-
-
-
-
-
-
-
-
The relation between the leakage multiplication M, the leakage probability
Equations 7–9 rely on the so-called fast fission concept, which assumes that a fission cascade is of negligible duration in time and neutron induced fission by neutrons moderated in the surrounding material can be neglected. In Eqs 7, 8 a distinction is made between properties of the different primary neutron sources and the prompt fission neutrons from neutron induced fission. However, it is assumed that the properties for all prompt fission neutrons resulting from neutron induced fission are independent of the neutron inducing a fission reaction. Assuming that all neutrons follow a similar energy distribution, the contribution due to delayed neutrons can be neglected and neutrons are only absorbed by neutron induced fission, the expressions in Eqs 7, 8 reduce to those proposed in (Hage and Cifarelli, 1985b):
Equations 7, 8 were applied to derive the production rates due to spontaneous fission and (α,n) reactions in the SNF sample from the totals and reals rate in Table 12 and the input data specified in Table 13. The gate fraction and detection efficiencies used for these calculations were discussed in Section 5.2. Details about the determination of the other quantities are given in Schillebeeckx et al. (2020). The leakage multiplication M = 1.006 (2) assumed in the present work is fully consistent with the one derived in Kim et al. (2004).
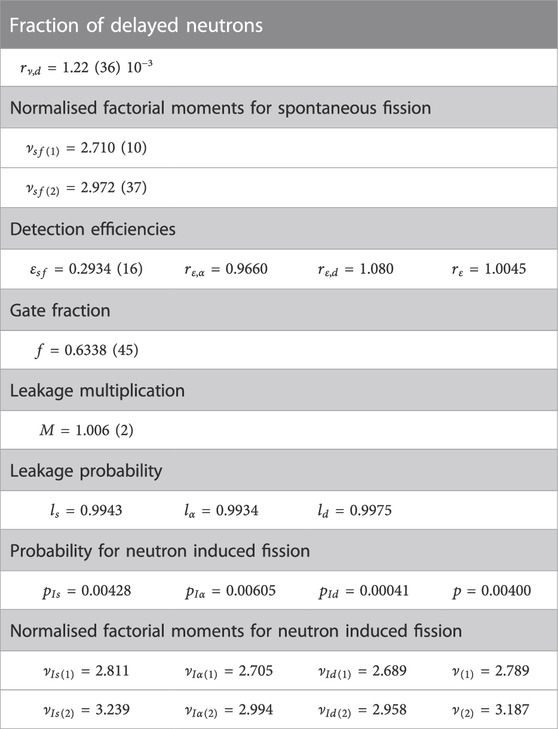
TABLE 13. Input parameter data to derive the neutron production rates from the totals and reals rates using the relations in Eq. 7 and Eq. 8.
The final neutron production rate due to spontaneous fission and the ratio of neutrons produced by (α,n) reactions and by spontaneous fission are reported in Table 14. The table includes the results obtained by applying Eqs 10, 11 and those of Schillebeeckx et al. (2020). The latter were obtained by applying the point model of Hage and Cifarelli (Hage and Cifarelli, 1985a; Hage and Cifarelli, 1985b; Cifarelli and Hage, 1986) in an absolute way without the use of any certified neutron source. For the neutron emission due to spontaneous fission the maximum difference is about 0.6%. The impact of the various assumptions that can be made to go from Eqs 7–11 are discussed in more detail in Schillebeeckx et al. (2020). This discussion together with the results in Table 14 reveal that the production rate of spontaneous fission neutrons is not very sensitive to these assumptions. However, the influence on the neutron production by (α,n) reactions is larger.
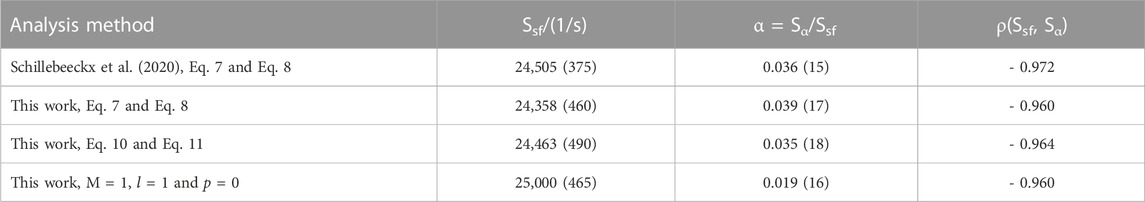
TABLE 14. Neutron production rate due to spontaneous fission Ssf and α-ratio resulting from different methods to analyse the experimental data in Table 12. The results are for a cooling time of 6,437 days.
The uncertainty of the neutron production rate due to spontaneous fission is about 2%, which is a reduction by a factor 2 compared to the uncertainty of the 244Cm inventory derived by radiochemical analysis (Eysermans et al., 2022). The contribution to the uncertainty of the counting statistics, detection efficiency, gate fraction, first and second order factorial moments for 244Cm(sf) and multiplicity are specified in Table 15. This table reveals that the main contribution is due to the second order factorial moment, detection efficiency and gate fraction. The impact of the detection efficiency and gate fraction can be reduced by improving the design of the well counter, i.e., by increasing the detection efficiency, optimising the moderator/detector geometry to create a single exponential behaviour of the Rossi-alpha distribution and optimising the electronics to reduce the dead time. To reduce the uncertainty of the factorial moments new dedicated experiments are required.
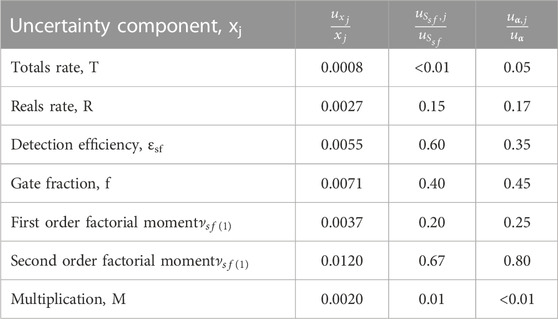
TABLE 15. Contribution of the counting statistics, the detection efficiency, gate fraction, first and second order factorial moments for 244Cm(sf) and neutron multiplication to the uncertainty of the derived neutron production rate due to spontaneous fission and the α-ratio.
5.2 Discussion
The production rate by spontaneous fission divided by the amount of fuel derived from the direct neutron experiments is 678 (12) s-1 g-1. This value is within uncertainties in agreement with the one derived from the experimentally determined nuclide inventory, which is 699 (28) s-1 g-1 (Romojaro, 2022). The α-ratio Sα/Ssf = 0.039 (17) is almost a factor 2 larger compared to the one derived from the nuclide inventory which is Sα/Ssf = 0.020 (1) (Romojaro, 2022). The latter is in good agreement with the calculated values in Table 4. Given the uncertainty of more than 40% of the α-ratio derived from the neutron measurements it is hard to discuss this value.
To compare the theoretical and experimental production rates, the uncertainty of the experimental value has to be combined with the uncertainty of the experimental inventory of 148Nd, which is at present 2%. This results in a combined uncertainty for the experimental production rate due to spontaneous fission of 4%.
Considering the 4% relative uncertainty of the experimental neutron production rate due to spontaneous fission, most of the calculated results agree with the experimentally determined value. The best agreement is obtained for the results with ENDF/B-VII.0 and JEFF-3.3 using the 147Nd(n,γ) cross section of JENDL-4.0u, both combined with the recommended decay and neutron emission data. The results obtained with JEFF-3.3 support the reduction of the 147Nd(n,γ) cross section proposed in Suyama and Mochizuki (2005) and Rochman et al. (2016). Since the ENDF/B-VII.0 data are obtained with a larger cross section for the 147Nd(n,γ) reaction, the good agreement with the experimental data results from a compensating effect due to differences in, e.g., 242Pu(n,γ) and 243Am(n,γ) cross sections (see Table 5). The largest deviations are observed for JENDL-4.0u and JENDL-5.0, which would question the lower cumulative fission yield for 148Nd adopted in these libraries (see Table 6). Evidently, due to the above mentioned compensating effects more quantitative conclusions are hard to be drawn.
7 Summary and outlook
An absolute non-destructive measurement of the neutron production rate of a SNF sample in standard controlled area conditions was presented. The sample was a segment taken from a SNF rod that was irradiated in the Tihange 1 PWR reactor to a burnup of 50 MWd/kg. The composition and design specifications of this fuel rod and the irradiation conditions are well documented. The SNF segment sample used for the neutron measurements was characterised for its net fuel weight. Additional representative samples were characterised by radiochemical analysis for different types of investigations such as the inventory of fission products used as BU indicators.
The neutron measurements were performed using a neutron well counter that was designed for routine nuclear safeguards applications. They were carried out at the LHMA facility of SCK CEN (BE) on 15/10/2018, corresponding to a cooling time of 6,437 days. The characteristics of the detection device were determined at JRC Ispra (IT) by measurements with 252Cf(sf) point sources that were certified for their neutron production rate at NPL (UK). The characteristics for measurements with the SNF sample were derived by combining experimental data with results of Monte Carlo simulations. Finally, the neutron production rate due to spontaneous fission Ssf and the α-ratio between neutrons from (α,n) reactions and spontaneous fission were derived from the totals and reals rate applying an extension of the point model of Hage and Cifarelli. This resulted in a specific neutron emission rate due to spontaneous fission of 678 (12) s-1g-1 and a relative contribution of (α,n) neutrons of α = 0.039 (18). The neutron production rate due to spontaneous fission, which primarily originates from 244Cm(sf), is determined with an uncertainty that is a factor 2 smaller compared to the uncertainty of the 244Cm inventory derived from radiochemical analysis. This neutron emission rate from spontaneous fission is in very good agreement with the emission rate calculated from the experimentally determined nuclide inventory. An analysis of the different uncertainty components reveals that the uncertainties can be reduced by optimising the design of the detection system and improving the status of the neutron multiplicity distribution for 244Cm(sf). An optimised detection system opens the possibility to measure high neutron emitting samples from irradiated MOX fuel and samples with a low neutron emission rate and relatively high γ-ray emission rate, such as the segments from the bottom and top part of the fuel rod.
The results demonstrate that the NDA method presented in this work is a valuable radiometric method to complement radiochemical analysis techniques for depletion code validation. It does not require chemical treatments such as dissolution of the SNF sample including the cladding and further dilution and/or chemical separation processes. Evidently, this reduces the impact of systematic effects due sample preparation and the final uncertainty.
A code-to-code comparison was presented including results derived with different nuclear data libraries. The study reveals that differences of more than 3% can be expected between the BU estimated by different codes and libraries. This limitation in the BU prediction directly affects the performance of depletion codes to estimate key observables such as the decay power and γ-ray and neutron emission properties of SNF assemblies. Therefore, a better understanding of BU estimators, in particular those provided by the operator and the one derived from depletion codes, is required.
A comparison of results obtained with SCALE and ALEPH2 demonstrates the need of using traceable nuclear data to understand their impact. The impact of different nuclear libraries was studied based on results obtained with Serpent2. The study included the role of the 147Nd(n,γ) reaction cross section to predict the nuclide inventory of 148Nd that was used to normalize the data. In addition, the role of the cumulative fission yields for 137Cs and 148Nd and the cross sections of capture reactions leading to the creation of 244Cm was discussed.
A comparison between experimental and calculated neutron production rates supports a reduction of the 147Nd(n,γ) cross section in JENDL-4.0 and JEFF-4T1. In addition, we recommend to adopt in the evaluated data libraries the decay data recommended by DDEP (DDEP, 2023), the average prompt fission neutrons evaluated by Pauli and Santi (Santi and Miller, 2008) and to review the cumulative fission yields, including their uncertainties, for some key nuclides like 137Cs and 148Nd. To improve the use of the neutron production rate of a spent fuel sample as a BU indicator and to support the development of passive neutron NDA systems the status of the 242Pu(n,γ) and 243Am(n,γ) reaction cross sections has to be improved.
Data availability statement
The original contributions presented in the study are included in the article/supplementary material, further inquiries can be directed to the corresponding author.
Author contributions
All authors listed have made a substantial, direct, and intellectual contribution to the work and approved it for publication.
Funding
The present work was partly funded by the European Union’s Horizon 2020 Research and Innovation Programme under grant agreement No 847593 (project EURAD, Work Package 8) and the Euratom Research and Training Programme 2014–2018 under Grant Agreement No. 847552 (SANDA).
Conflict of interest
The authors declare that the research was conducted in the absence of any commercial or financial relationships that could be construed as a potential conflict of interest.
Publisher’s note
All claims expressed in this article are solely those of the authors and do not necessarily represent those of their affiliated organizations, or those of the publisher, the editors and the reviewers. Any product that may be evaluated in this article, or claim that may be made by its manufacturer, is not guaranteed or endorsed by the publisher.
References
Adriaensen, L., Dobney, A., and Cachoir, C. (2020). REGAL - Radiochemical analysis of sample FT1X57-D05-BU1. Report R-6375 (rev.3). Mol: SCK CEN.
Böhnel, K. (1975). Die Plutoniumbestimmung in Kernbrennstoffen mit der Neutronen-Koinzidenzmethode. Report KFK-2203. Karlsruhe: Kerforschungszentrum.
Boykov, G. S., Gerasimenko, B., Dmitriev, V., Drapchinsky, L., Kostochkin, O., Petrzhak, K., et al. (1997) Precision prompt neutron spectrum measurements of minor actinides for transmutation problem, Proc. Int. Conf. Nucl. Data Sci. Technol. Vol. 2, pp. 1310–1312. Trieste, Italy.
Broadhead, B. L., DeHart, M. D., Ryman, J. C., Tang, J. S., and Parks, C. V. (1995). Investigation of Nuclide Importance to Functional Requirements Related to Transport and Long-Term Storage of LWR Spent Fuel. Report ORNL/TM-12742. Tennessee: Oak Ridge National Laboratory.
CAEN (2023). DT5751. Available at: https://www.caen.it/products/dt5751/.
Carlson, A. D., Pronyaev, V. G., Capote, R., Hale, G. M., Chen, Z.-P., Duran, I., et al. (2018). Evaluation of the neutron data standards. Nucl. Data Sheets 148, 143–188. doi:10.1016/j.nds.2018.02.002
Caruso, S., Murphy, M., Jatuff, F., and Chawlq, R. (2007). Validation of 134Cs, 137Cs and 154Eu single ratios as burnup monitors for ultra-high burnup UO2 fuel. Ann. Nucl. Energy 34, 28–35. doi:10.1016/j.anucene.2006.11.009
Cifarelli, D. M., and Hage, W. (1986). Models for a three-parameter analysis of neutron signal correlation measurements for fissile material assay. Nucl. Instrum. Methods Phys. Res. A251, 550–563. doi:10.1016/0168-9002(86)90651-0
Croft, S., and Henzlova, D. (2013). Determining 252Cf source strength by absolute passive neutron correlation counting. Nucl. Instrum. Methods Phys. Res. A 714, 5–12. doi:10.1016/j.nima.2013.02.002
DDEP (2023). Decay data evaluation project, . Available at: http://www.nucleide.org/DDEP_WG/DDEPdata.htm.
Doran, H. R., Cresswell, A. J., Sanderson, D. C. W., and Falcone, G. (2022). Nuclear data evaluation for decay heat analysis of spent nuclear fuel over 1 – 100 k year time scale. Eur. Phys. J. Plus 137, 665. doi:10.1140/epjp/s13360-022-02865-7
Eckert & Ziegler (2023). Industrial radiation sources. Available at: https://www.ezag.com/fileadmin/ezag/user-uploads/pdf/isotope/5_industrial_sources.pdf.
Eysermans, J., and Verwerft, M. (2022). Databook of flat burnup samples from rod D05 extracted from fuel assembly FT1X57, Tihange 1 NPP. Report R-8189 (rev.1). Mol: SCK CEN.
Eysermans, J., Verwerft, M., Govers, K., Ichou, R., Ilas, G., Meryturek, U., et al. (2022). REGAL International Program: Analysis of experimental data for depletion code validation. Ann. Nucl. Energy 172, 109057. doi:10.1016/j.anucene.2022.109057
Fiorito, L., Piedra, D., Cabellos, O., and Diez, C. J. (2015). Inventory calculation and nuclear data uncertainty propagation on light water reactor fuel using ALEPH2 and SCALE 6.2. Ann. Nucl. Energy 83, 137–146. doi:10.1016/j.anucene.2015.03.046
Fiorito, L., Romojaro, P., Cabellos, O., García-Hormigo, M., Hernandez-Solis, A., Sánchez-Fernández, S., Stankovskiy, A., Van den Eynde, G., et al. (2021). On the use of criticality and depletion benchmarks for verification of nuclear data. Ann. Nucl. Energy 161, 108415. doi:10.1016/j.anucene.2021.108415
Fröhner, F. H. (1997). Assigning uncertainties to scientific data. Nucl. Sci. Eng. 126, 1–18. doi:10.13182/nse97-a24453
Gauld, I. C., and Ryman, J. C. (2001). Nuclide importance to criticality safety, decay heating, and source terms related to transport and Interim storage of high-burnup LWR fuel. Maryland, United States: U.S. Nuclear Regulatory Commission. Report NUREG/CR-6700 (ORNL/TM-2000/284).
Gauld, I. C., Giaquinto, J. M., Delashmitt, J. S., Hu, J., Ilas, G., Haverlock, T. J., et al. (2016). Re-evaluation of spent nuclear fuel assay data for the Three Mile Island unit 1 reactor and application to code validation. Ann. Nucl. Energy 87, 267–281. doi:10.1016/j.anucene.2015.08.026
Govers, K., Boulanger, D., Meert, K., Leinders, G., and Verwerft, M. (2019). Characterization of Belgian spent fuel. Report BLG-1142. Mol: SCK CEN.
Govers, K., Adriaensen, L., Dobney, A., Geysemans, M., Cachoir, C., and Verwerft, M. (2022). Evaluation of the irradiation-averaged fission yield for burnup determination in spent fuel assays. EPJ Nucl. Sci. Technol. 8, 18. doi:10.1051/epjn/2022018
Hage, W., and Cifarelli, D. M. (1985a). Correlation analysis with neutron count distributions in randomly or signal triggered time intervals for assay of special fissile materials. Nucl. Sci. Eng. 89, 159–176. doi:10.13182/nse85-8
Hage, W., and Cifarelli, D. M. (1985b). On the factorial moments of the neutron multiplicity distribution of the fission cascades. Nucl. Instrum. Methods Phys. Res. A236, 165–177.
Hairer, E., and Wanner, G. (1999). Solving ordinary differential equations II: Stiff and differential-algebraic problems. J. Comput. Appl. Math. 111, 93–111. doi:10.1016/s0377-0427(99)00134-x
Hu, J., Gauld, I. C., Peterson, J. L., and Bowman, S. M. (2016). US Commercial Spent Nuclear Fuel Assembly Characteristics: 1968 - 2013. Report NUREG/CR-7227 (ORNL/TM-2015/619). Tennessee: Oak Ridge National Laboratory.
Hu, J., Giaquinto, J. M., Gauld, I. C., Ilas, G., and Keever, T. J. (2017). Analysis of new measurements of Calvert Cliffs spent fuel samples using SCALE 6.2. Ann. Nucl. Energy 106, 221–234. doi:10.1016/j.anucene.2017.04.005
Ilas, G., and Burns, J. R. (2022). SCALE 6.2.4 validation for light water reactor decay heat analysis. Nucl. Technol. 208, 403–413. doi:10.1080/00295450.2021.1935165
JCGM (2008). JCGM/WG 1, evaluation of measurement data - guide to the expression of uncertainty in measurements. Available at: https://www.bipm.org/en/committees/jc/jcgm/publications.
Kim, H. J., Ko, W. I., Lee, S. Y., and Kim, H. D. (2004). The effect of the neutron multiplication factor on a nuclear material measurement in dry-processed spent fuel material. J. Nucl. Sci. Technol. 41, 384–4. doi:10.1080/00223131.2004.10875727
Krick, M. S., and Swansen, J. E. (1984). Neutron multiplicity and multiplication measurements. Nucl. Instrum. Methods Phys. Res. 219, 384–393. doi:10.1016/0167-5087(84)90349-1
Lemmens, K., González-Robles, E., Kienzler, B., Curti, E., Serrano-Purroy, D., Sureda, R., et al. (2017). Instant release of fission products in leaching experiments with high burn-up nuclear fuels in the framework of the Euratom project FIRST- Nuclides. J. Nucl. Mater. 484, 307–323. doi:10.1016/j.jnucmat.2016.10.048
Leppänen, J., Pusa, M., Viitanen, T., Valtavirta, V., and Kaltiaisenaho, T. (2015). The Serpent Monte Carlo code: Status, development and applications in 2013. Ann. Nucl. Energy 82, 142–150. doi:10.1016/j.anucene.2014.08.024
Leray, O., Rochman, D., Grimm, P., Ferrouukhi, H., Vasiliev, A., Hursin, M., et al. (2016). Nuclear data uncertainty propagation on spent fuel nuclide compositions. Ann. Nucl. Energy 94, 603–611. doi:10.1016/j.anucene.2016.03.023
Maeda, S., Sekine, T., and Aoyama, T. (2004). Measurement and analysis of decay heat of fast reactor spent MOX fuel. Ann. Nucl. Energy 31, 1119–1133. doi:10.1016/j.anucene.2003.11.002
McKinnon, M. A., Doman, J. W., Heeb, C. M., and Creer, J. M. (1986). Monticello BWR Spent Fuel Decay Heat Predictions and Measurements. Report PNL-5799. Washington State: Pacific Northwest National Laboratory.
Menlove, H. O. (1979). Description and operation manual for the active well coincidence counter. Report LA-7823-M. New Mexico: Los Alamos National Laboratory.
Mennecart, T., Leinders, G., Cachoir, C., Cornelis, G., Verpoucke, G., Modolo, G., et al. (2020). First phase of the spent fuel autoclave leaching experiments (SF-ALE) at SCK⋅CEN. Proc. Top Fuel 2019, pp. 173–180. Seattle, United States. Available at: https://www.ans.org/pubs/proceedings/issue-2336/
Michel-Sendis, F., Gauld, I., Martinez, J. S., Alejano, C., Bossant, M., Boulanger, D., et al. (2017). SFCOMPO-2.0: An OECD NEA database of spent nuclear fuel isotopic assays, reactor design specifications, and operating data. Ann. Nucl. Energy 110, 779–788. doi:10.1016/j.anucene.2017.07.022
Miura, N., and Menlove, H. O. (1994). The use of curium neutrons to verify plutonium in spent fuel and reprocessing wastes. Report LA-12774-MS. New Mexico: Los Alamos National Laboratory.
Murata, T., Matsunobu, H., and Shibata, K. (2006). Evaluation of the (α,xn) reaction data for JENDL/AN-2005. Report JAEA-research 2006-052. Japan: Japan Atomic Energy Agency.
Murphy, B. D., and Gauld, I. C. (2010). Spent Fuel Decay Heat Measurements Performed at the Swedish Central Interim Storage Facility. Report NUREG/CR-6971 (ORNL/TM-2008/016). Tennessee: Oak Ridge National Laboratory.
Nichols, A. L., Aldama, D. L., and Verpelli, M., Handbook of nuclear data for safeguards: Database extensions. INDC(NDS)-0502. IAEA Report, 2008.
NIST (2023). Stopping power and range tables for heliumm ions. Available at: https://physics.nist.gov/PhysRefData/Star/Text/ASTAR.html.
Nobre, G. (2019). Assessment of the current status of cross-section evaluations of plutonium minor isotopes. Report BNL-211652-2019-INRE. New York: Brookhaven National Laboratory.
OECD NEA (2016). Evaluation guide for the evaluated spent nuclear fuel assay database (SFCOMPO). Nuclear Science. NEA/NSC/R(2015).
OECD NEA (2023). JANIS. Available at: https://www.oecd-nea.org/jcms/pl_39910/janis.
OECD NEA (2011). Spent Nuclear Fuel Assay Data for Isotopic Validation. State-of-the-art Report. Nuclear Science. NEA/NSC/WPNCS/DOC(2011).
Perret, G., Rochman, D., Vasiliev, A., and Ferrroukhi, H. (2021). Neutron emission measurements of PWR spent fuel segments and preliminary validation of depletion calculations. EPJ Web Conf. 247, 10004. doi:10.1051/epjconf/202124710004
Prokopowicz, R., and Pytel, K. (2016). Determination of nuclear fuel burn-up axial profile by neutron emission measurement. Nucl. Instrum. Methods Phys. Res. A 838, 18–23. doi:10.1016/j.nima.2016.09.021
Pusa, M. (2016). Higher-order Chebyshev rational approximation method and application to burnup equations. Nucl. Sci. Eng. 182, 297–318.
Rearden, B. T., and Jessee, M. A. (2017). SCALE code system. Version 6.2.2. Report ORNL/TM-2005/39. Tennessee: Oak Ridge National Laboratory.
Rinard, P. M., and Bosler, G. E. (1988). Safeguarding LWR spent fuel with the fork detector. Report LA-11096-MS. New Mexico: Los Alamos National Laboratory.
Rinard, P. M., Bosler, G. E., and Phillips, J. R. (1981). Calculated Neutron-Source Spectra from Selected Irradiated PWR Fuel Assemblies. Report LA-9125-MS. New Mexico: Los Alamos National Laboratory.
Roberts, N. J., and Parfitt, M. J. (2010). MCNPX modelling of the NPL manganese bath facility based on a converted CAD model. Radiat. Meas. 45, 1346–1349. doi:10.1016/j.radmeas.2010.06.057
Rochman, D., Leray, O., Perret, G., Vasiliev, A., Ferroukhi, H., and Koning, A. J. (2016). Re-evaluation of the thermal neutron capture cross section of 147Nd. Ann. Nucl. Energy 94, 612–617. doi:10.1016/j.anucene.2016.03.024
Rochman, D. A., Vasiliev, A., Dokhane, A., and Ferroukhi, H. (2018). Uncertainties for Swiss LWR spent nuclear fuels due to nuclear data. EPJ Nucl. Sci. Technol. 4, 6. doi:10.1051/epjn/2018005
Rochman, D., Álvarez-Velarde, F., Dagan, R., Fiorito, L., Häkkinen5, S., Kromar, M., et al. (2023). On the estimation of nuclide inventory and decay heat: A review from the EURAD European project. Eur. Phys. J. N. 9, 14. doi:10.1051/epjn/2022055
Santi, P., and Miller, M. (2008). Reevaluation of prompt neutron emission multiplicity distributions for spontaneous fission. Nucl. Sci. Eng. 160, 190–199. doi:10.13182/nse07-85
Schillebeeckx, P., Verwerft, M., Žerovnik, G., Parthoens, Y., Pedersen, B., Alaerts, G., et al. (2020). A non-destructive method to determine the neutron production rate of a sample of spent nuclear fuel under standard controlled area conditions. Luxembourg: JRC Technical Report EUR 30379 EN, European Atomic Energy Community. doi:10.2760/6148853,JRC121586
Seidl, M., Schillebeeckx, P., and Rochman, D. (2023). On the potential to increase the accuracy of source term calculations for spent nuclear fuel. Front. Energy Res. this issue.
Shores, E. F. (2000). Data updates for the SOURCES-4A computer code, LA-UR-00-5016. Los Alamos, Nucl. Instrum. Methods Phys. Res. B 179, 78–82. doi:10.1016/S0168-583X(00)00694-7
SKB (2006). Measurements of decay heat in spent nuclear fuel at the Swedish Interim storage facility. Clab, SKB Report R-05-62.
Stankovskiy, A., and Van den Eynde, G. (2012). Advanced method for calculations of core burn-up, activation of structural materials, and spallation products accumulation in accelerator-driven systems, Sci. Technol. Nucl. Installations, 2012, 545103. doi:10.1155/2012/545103
Suyama, K., and Mochizuki, H. (2005). Effect of neutron induced reactions of neodymium-147 and 148 on burnup evaluation. J. Nucl. Sci. Technol. 42, 661–669. doi:10.1080/18811248.2004.9726434
Swansen, J. E., Collinsworth, P. R., and Krick, M. S. (1980). Shift-Register coincidence electronics system for thermal neutron counters. Nucl. Instrum. Methods 176, 555–565. doi:10.1016/0029-554x(80)90386-9
Swansen, J. E. (1985). Deadtime reduction in thermal neutron coincidence counter. Nucl. Instrum. Methods Phys. Res. B 9, 80–88. doi:10.1016/0168-583x(85)90781-5
Tobin, S. J., Peura, P., Bélanger-Champagne, C., Moring, M., Dendooven, P., and Honkama, T. (2018). Measuring spent fuel assembly multiplication in borated water with a passive neutron albedo reactivity instrument. Nucl. Instrum. Methods Phys. Res. A 897, 32–37. doi:10.1016/j.nima.2018.04.044
Trahan, A.C., McMath, G.E., Mendoza, P.M., Trellue, H.R., Backstrom, U., and Balkeståhl, L.P. (2020). Results of the Swedish spent fuel measurement field trials with the Differential Die-Away Self-Interrogation Instrument. Nucl. Instrum. Methods Phys. Res. A 955, 163329. doi:10.1016/j.nima.2019.163329
Tuominen, R., Valtavirta, V., and Leppänen, J. (2019). New energy deposition treatment in the Serpent 2 Monte Carlo transport code. Ann. Nucl. Energy 129, 224–232. doi:10.1016/j.anucene.2019.02.003
Vaccaro, S., Tobin, S. J., Favalli, A., Grogan, B., Jansson, P., Liljenfeldt, H., et al. (2016). PWR and BWR spent fuel assembly gamma spectra measurements. Nucl. Instrum. Methods Phys. Res. A 833, 208–225. doi:10.1016/j.nima.2016.07.032
Vaccaro, S., Gauld, I. C., Hu, J., DeBaere, P., Petersen, J., Schwalbach, P., et al. (2018). Advancing the FORK detector for quantitative spent nuclear fuel verification. Nucl. Instrum. Methods Phys. Res. A 888, 202–217. doi:10.1016/j.nima.2018.01.066
Verwerft, M., Vos, B., Van den Berghe, S., and Govers, K. (2014). First nuclides post-irradiation examination report rod D05 - OM1. Report R-5579. Mol: SCK CEN.
Werner, C. J. (2017). MCNP user’s manual code version 6.2. Report LA-UR-17-29981. New Mexico: Los Alamos National Laboratory.
Wilson, W., Perry, R., Charlton, W., and Parish, T. (2009). Sources: A code for calculating (alpha, n), spontaneous fission, and delayed neutron sources and spectra. Prog. Nucl. Energy 51, 608–613. doi:10.1016/j.pnucene.2008.11.007
X-5 Monte Carlo Team (2005). MCNP—a general N-particle transport code, version 5. Volume I: Overview and theory, LA-UR-03-1987. New Mexico: Los Alamos National Laboratory.
Yokoyama, T., Ueda, M., Kurosawa, F., and Enomoto, T. (1981). Measurement and analysis of neutron emission rate for irradiated BWR fuel. J. Nucl. Sci. Technol. 18, 249–260. doi:10.1080/18811248.1981.9733252
Žerovnik, G., Schillebeeckx, P., Govers, K., Borella, A., Ćalić, D., Fiorito, L., et al. “Observables of interest for the characterisation of spent nuclear fuel”, JRC Technical Reports, EUR 29301 EN (2018).
Zu, T., Yang, C., Cao, L., and Wu, H. (2016). Nuclear data uncertainty propagation analysis for depletion calculation in PWR and FR pin-cells. Ann. Nucl. Energy 94, 399–408. doi:10.1016/j.anucene.2016.04.006
Keywords: neutron emission, neutron correlation counting, spent nuclear fuel (SNF), depletion calculation, spontaneous fission
Citation: Schillebeeckx P, Verwerft M, Romojaro P, Žerovnik G, Messaoudi N, Alaerts G, Fiorito L, Govers K, Paepen J, Parthoens Y, Pedersen B, Stankovskiy A, Van den Eynde G and Wynants R (2023) An absolute measurement of the neutron production rate of a spent nuclear fuel sample used for depletion code validation. Front. Energy Res. 11:1162367. doi: 10.3389/fenrg.2023.1162367
Received: 09 February 2023; Accepted: 24 March 2023;
Published: 24 April 2023.
Edited by:
Hosam Saleh, Egyptian Atomic Energy Authority, EgyptReviewed by:
Hatun Korkut, Sinop University, TürkiyeRudrodip Majumdar, National Institute of Advanced Studies, India
Copyright © 2023 Schillebeeckx, Verwerft, Romojaro, Žerovnik, Messaoudi, Alaerts, Fiorito, Govers, Paepen, Parthoens, Pedersen, Stankovskiy, Van den Eynde and Wynants. This is an open-access article distributed under the terms of the Creative Commons Attribution License (CC BY). The use, distribution or reproduction in other forums is permitted, provided the original author(s) and the copyright owner(s) are credited and that the original publication in this journal is cited, in accordance with accepted academic practice. No use, distribution or reproduction is permitted which does not comply with these terms.
*Correspondence: Peter Schillebeeckx, cGV0ZXIuc2NoaWxsZWJlZWNreEBlYy5ldXJvcGEuZXU=