 Hao Yisheng
 Wu Zhen1,2,3
 Qiu Rui
- 1Department of Engineering Physics, Tsinghua University, Beijing, China
- 2Key Laboratory of Particle and Radiation Imaging of Ministry of Education, Beijing, China
- 3Nuctech Company Limited, Beijing, China
Introduction: This paper proposes a five-layer fully connected neural network for predicting radiation parameters in a radiation space based on detector readings.
Methods: The network is trained and tested using gamma flux values from individual detector positions as input, and is used to predict the gamma radiation field in 3D space under different source term distributions. The method is evaluated using the mean percentage change error (PCT) for the test set under different source term distributions.
Results: The results show that the neural network method can accurately predict radiation parameters with an average PCT error range of 0.53% to 3.11%, within the given measurement input error range of ± 10%. The method also demonstrates its ability to directly reconstruct the 3D radiation field with some simple source terms.
Discussion: The proposed method has practical value in real operations within radiation spaces, and can be used to improve the accuracy and efficiency of predicting radiation parameters. Further research could explore the use of more complex source term distributions and the integration of other types of sensors for improved accuracy.
1 Introduction
To satisfy the current and ambitious goals with respect to climate change, a complete transformation of the global energy system is required. Nuclear energy is a major source of low-carbon electricity and plays a significant role in preventing greenhouse gas emissions. Due to the radiation dose limits of personnel and the environment during the construction and operation of nuclear power facilities, traditional nuclear technology that are implemented in traditional nuclear power plants often lacks flexibility. Before workers are allowed to enter a radiation operation space, the three-dimensional (3D) radiation field in the entire work space is typically defined. The geometry model, combined with the computer-calculated simulated worker dose exposure information, can then be used to determine the radiation dose of the workers that can be quantitatively gained before the work commences (Hughes, 1996). This is pertinent for reducing the radiation damage received by the workers during the actual operation process to create a safe working environment. The typical focus of the above process is to establish a 3D radiation field in the personnel operation area. Therefore, carrying out research on the reconstruction method of the dose distribution of a 3D radiation field can provide a more accurate and practical method for optimizing workers’ protection equipment and measures against radiation. This facilitates great improvement of the safety level of the physical nuclear devices; furthermore, it can also more comprehensively ensure the health of workers. Therefore, research on the reconstruction method of radiation fields supports broad applications in the whole life cycle of the operation, including the inspection and eventual decommissioning of nuclear equipment (Zhu et al., 2010; Liu et al., 2011).
The methods for calculating radiation field parameters can be divided into two categories: Direct calculation methods and reverse reconstruction methods. By considering the geometric factors, source terms, and material information of the computing space, the direct calculation method uses a numerical basis to calculate the radiation field parameters in the geometric space. At present, the most commonly used direct calculation methods are the Monte Carlo method, discrete coordinate method and point kernel integration method. Although direct calculation methods can accurately calculate the radiation parameters within the radiation field, all three methods need to accurately describe the source term information in the radiation field. This is not always feasible; in practical application scenarios, the activity information of the source term is often unknown, while other information of the source term, such as the location of the source term and the geometric information of the entire radiation field, is often available. In practice, it is necessary to first invert the source term parameters in the space, predict the source term parameters, and then calculate the radiation field parameters for the whole space by a direct calculation method.
As shown in Figure 1, the reverse reconstruction method is mainly used to analyze and reconstruct the overall radiation field from finite sampling points through interpolation algorithms and artificial intelligence calculation methods. Much research has been conducted on inverse reconstruction methods based on interpolation algorithms. Wang and Cai, (2018) proposed a method based on net function interpolation to the reciprocal of the dose rate field. Sai et al. (2016) incorporated the interpolation technique for multiple secondary scattering data into the reconstruction process, and Zhu et al. (2021) proposed a method based on the improved Cahn-Hilliard (C-H) equation to reconstruct the 3D gamma dose rate field using arbitrarily located sparse measurements. Although reverse reconstruction methods based on interpolation algorithms have been extensively studied, these methods often require a large number of uniform sampling points located throughout space, and in reality, these are often unattainable requirements.
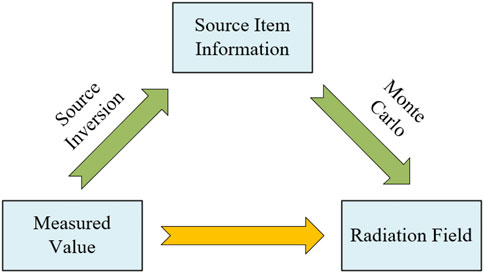
FIGURE 1. Flowchart of the radiation field reconstruction algorithm.
For nuclear technology, artificial intelligence methods are mainly used in equipment fault diagnosis and have achieved good results (Zhong and Ban, 2022a; Zhong and Ban, 2022b; Zhong et al., 2022). However, few studies have been performed on artificial intelligence (AI)-based reverse reconstruction methods. In the actual radiation field, the relationship between the measured values of the radiation obtained by the scattered detector and the radiation parameters in the whole space is often difficult to describe with a determined mathematical model. Subsequently, the non-linear method represented by the neural network is likely to become an effective tool for radiation field reconstruction. Li et al. (2018) proposed using a simple radial basis function (RBF) neural network model that, when combined with the inverse distance weighting method used to calculate difference values, can be used to obtain whole space radiation parameters, as verified by a simple calculation. Zhou et al. (2021) proposed an adaptive back propagation (BP) neural network with learning rate attenuation, and its accuracy and feasibility were verified. Although the two aforementioned reconstruction methods have achieved positive results, they still exhibit some shortcomings, which include (1) these two methods have only been applied in the rapid reconstruction of the two-dimensional radiation field and have not been verified in the three-dimensional radiation field, (2) both methods require a large amount of uniform sampling performed throughout the whole space, which cannot be realized in the real radiation field environment, and (3) the two methods only include a single source term. In reality, the distribution of sources is not constant. The influence of source term parameters on the reconstruction of the radiation field needs further discussion.
In conclusion, based on the artificial intelligence method, it is very important to solve the actual radiation protection problem and study algorithms for 3D radiation field reconstruction from individual sampling points considering source term parameters. To solve the above problems, as shown in Figure 2, we propose an algorithm to reconstruct the 3D gamma radiation field based on finite sampling values by using neural networks and then test different distribution source terms by using common complex geometric examples. The Monte Carlo method is used in this paper to calculate the distribution of the 3D radiation field to obtain a data set that is then used during the process training of the neural network. Finally, the 3D gamma radiation field is reconstructed.
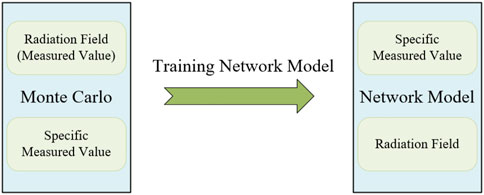
FIGURE 2. Calculation flow chart of this paper.
2 3D Radiation field reconstruction methods and processes
Neural networks are common machine learning models within the field of artificial intelligence and are used mostly in supervised learning methods. The purpose of supervised learning is to train a model so that any input value can be used in the model, which outputs a predicted value. Ideally, the predicted value is close to the real value, reflecting the good “fit” of the mapping relationship between the input value and the output value. If a neural network method is used to reconstruct the flux distribution of the whole 3D space from the values obtained with a limited number of detectors, rapid reconstruction of the 3D radiation field can be realized, which is of great significance to actual radiation shielding (Mahdavi et al., 2019; Zhou et al., 2021).
As shown in Figure 3, we develop a five-layer multilayer perceptron (MLP) neural network to accurately reconstruct the gamma radiation field studied in this paper. An MLP, also known as a fully connected neural network, is a neural network composed of a single perceptron with full connections, which is one of the most traditional neural networks. An MLP network consists of an initial input layer, an intermediate hidden layer, and a final output layer. The nodes of the input layer correspond to the photon flux value at the detector in the radiation space. To simulate the measurement errors that may occur during the actual measurement process, the input layer data are superimposed with a certain range of fluctuation error terms. The nodes of the output layer correspond to the division of mesh grids in the X, Y, and Z directions. Then, the radiation source terms in the radiation field space are changed to obtain different data sets for neural network training and verification of the model. The three points should be noted as follows:
(1) The input received by the neural network is the numerical value of the detector, and the result of the fluctuation error term of the random range
(2) Preprocessing is performed for the training data set
where
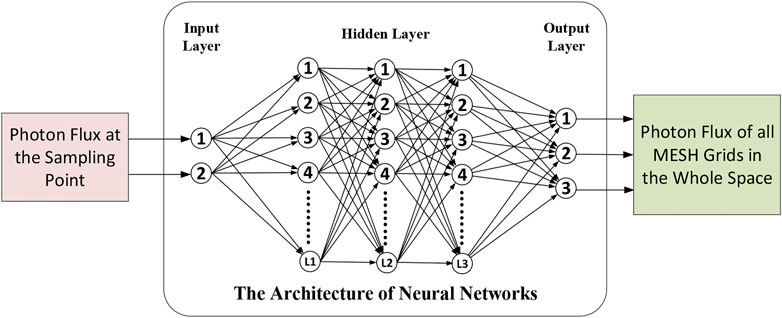
FIGURE 3. Schematic diagram of the five-layer MLP network.
(3) The evaluation of the network can be divided into two steps, in which the percentage change error (PCT) is used. In the first step, we use the output value of the model
This paper utilized a five-layer MLP neural network to reconstruct the three-dimensional dose distribution in space for different types of neutron sources with varying numbers, shapes, and distributions. Following the principle of simplicity to complexity in exploration experiments, this study sequentially validated the calculations for five scenarios: A monoenergetic neutron point source, a neutron point source with a Maxwellian energy distribution, a dual neutron source with one discrete neutron energy spectrum and one Maxwellian continuous neutron energy spectrum, a neutron surface source, and a neutron volume source.
3 Description of calculation examples
3.1 Geometric description
The 3D model used in this paper is shown in Figure 4. A 3D model room is simulated, and the X, Y, and Z directions correspond to the three dimensions of the length, width, and height of the room, with values of 5.00 m, 3.00 m, and 3.00 m, respectively; the room is separated by a wall, with a thickness of 0.10 m; the thickness of the outer wall is 0.20 m, and a door is opened in a portion of its X-Z plane, with a width of 0.80 m and a height of 2.00 m. The position of the radiation source is located at the coordinates (1.00 m, 1.50 m, and 1.50 m) and placed in the inward space of the room. The source is used as the default radiation source. Moreover, a cylindrical beam is added to the inner room, with the beam position at Y = 2.00 m, Z = 2.00 m, radius R = 0.20 m, above the side of the radiation source.
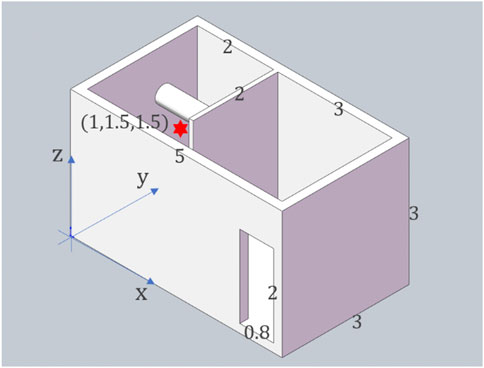
FIGURE 4. Geometric presentation of the studied 3D space.
3.2 Material description
In this example, the outer wall of the house is made of boron-containing concrete with a thickness of 20.00 cm; the walls inside the house consist of two layers of material: One layer is boron-containing polyethylene with a thickness of 5.00 cm, and the other layer is carbon steel with a thickness of 5.00 cm, which combined constitute the thickness of the interior wall of 10.00 cm. The cylindrical beams in the inner room are also made of carbon steel, with a radius of 0.20 m. The materials used above are the most commonly used shielding materials in nuclear facilities. The source term used in this paper is a neutron source of 0.00253 eV–2.00 MeV; in this energy interval, the reaction cross-section of different nuclides (n, γ) varies tremendously, which greatly increases the complexity of the gamma radiation field in the room. The information on materials above is found in the dedicated manual, and the specific data are shown in Table 1:
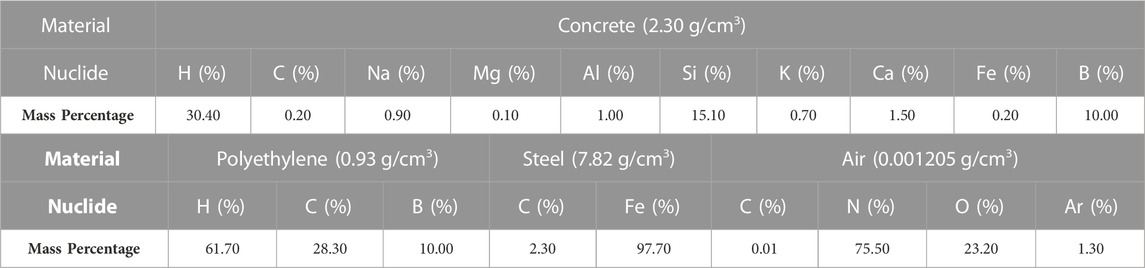
TABLE 1. Nuclide and density parameter information of the studied material.
3.3 Statistical description
As shown in Figure 5, the following is an example of an initially set single-energy neutron source radiation field. The source term is an isotropic radiation source placed in the middle of the inner room (X = 1.00 m, Y = 1.50 m, Z = 1.50 m), with a direction angle of
(1) Neutron and photon fluxes are counted by detectors placed at 27 selected positions in the room. The upper, middle, and lower layers are placed in the room. Nine spherical detectors are placed in the same position for each layer. The default radius of the detector is 5.00 cm. The calculated flux of neutrons and photons is the flux data in the sphere with a given radius, with the detector position located at the center of the sphere.
(2) The entire 3D space is divided into MESH grids to calculate the radiation field parameters. The specific process is to evenly divide 10 segments at 0.00 m–2.00 m and 10 segments at 2.00 m–5.00 m in the X direction, 10 segments at 0.00 m–3.00 m in the Y direction, and 10 segments at 0.00 m–3.00 m in the Z direction. Therefore, the 3D space of the whole radiation field is divided into

FIGURE 5. Schematic diagram of the Detector’s location.

FIGURE 6. Schematic diagram of mesh distribution in the room.
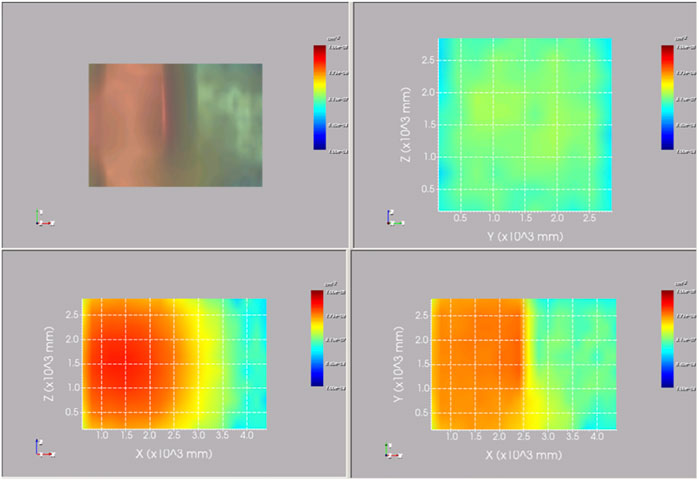
FIGURE 7. Schematic diagram of the photon flux distribution under a neutron source.
Both neutron and photon radiation parameters are important physical quantities to consider in radiation protection. The aim of this paper is to verify the effectiveness of neural networks in predicting radiation fields. The physical process of photon production from neutrons is an indirect process, making the prediction more complex. Therefore, this study focuses on verifying the effectiveness of neural network methods in predicting photon radiation fields.
4 3D Radiation field reconstruction results and discussion
In this paper, simulation and training are carried out for five cases, resulting in new prediction examples from the obtained neural network. Figures 8, 9, Figures 10, 11, Figure 12 show the top views (Z = 1500) of the calculated value, predicted value, statistical error, and relative error of the 3D radiation field photon flux under these five source terms.
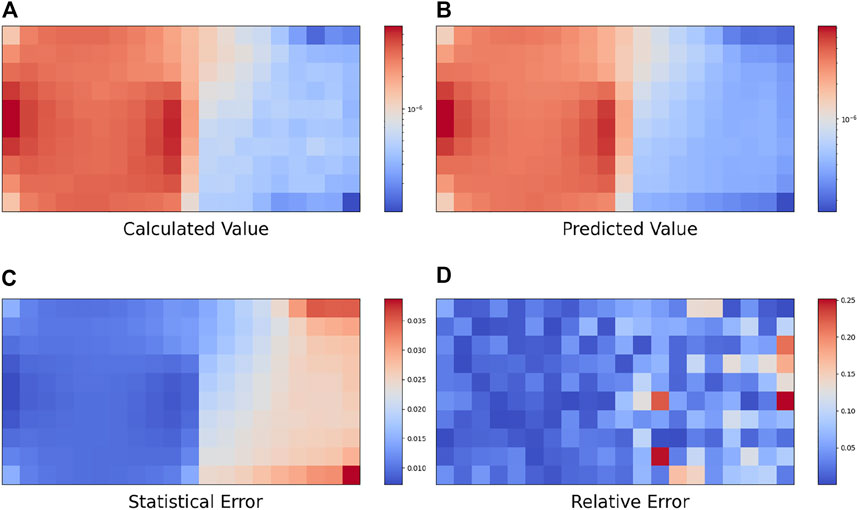
FIGURE 8. Reconstruction results of the single energy source term.
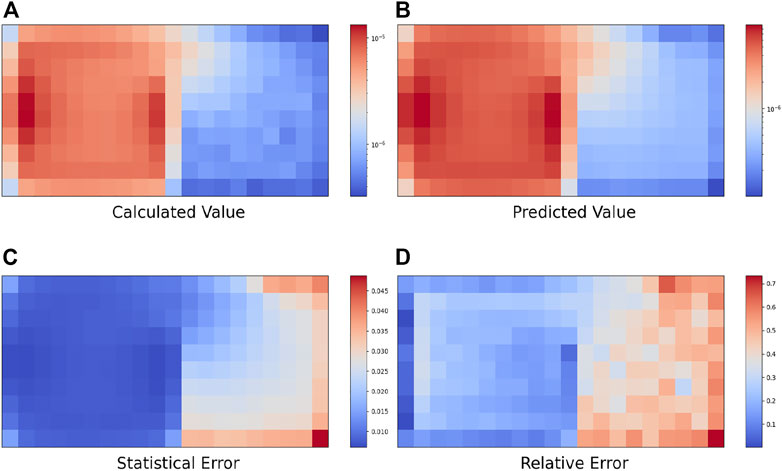
FIGURE 9. Reconstruction results of the maxwell source term.
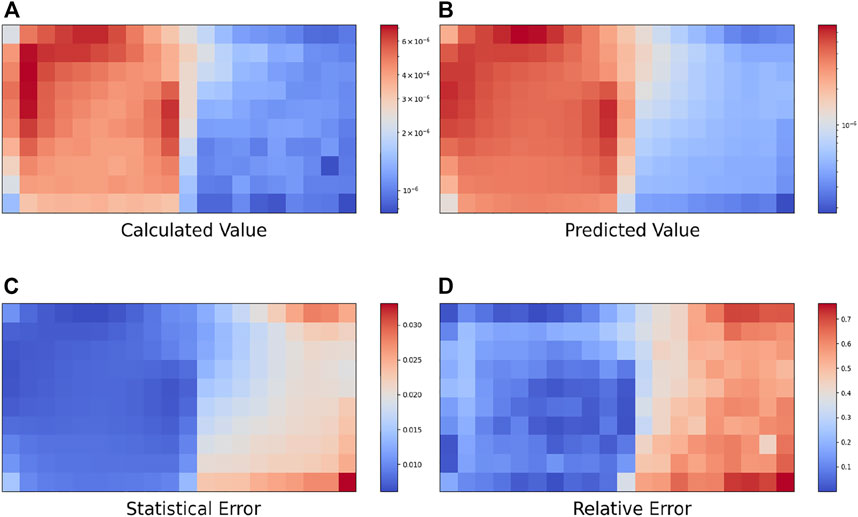
FIGURE 10. Reconstruction results of the double-point source term.
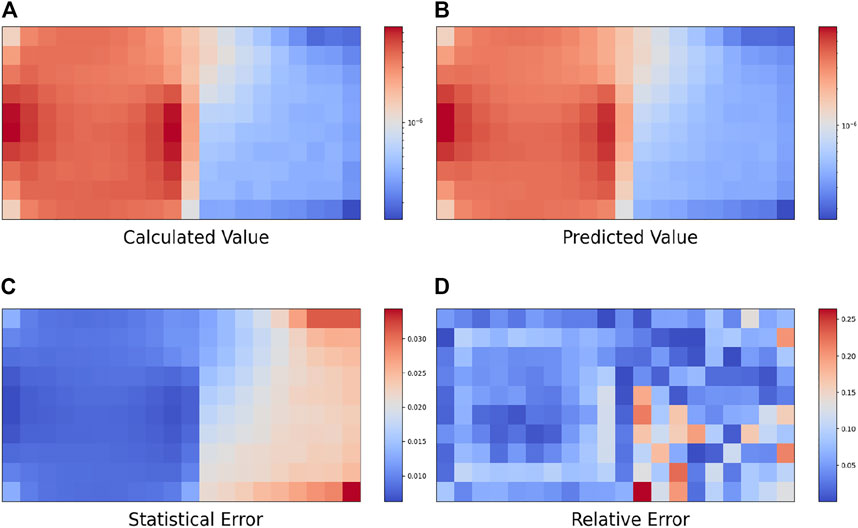
FIGURE 11. Reconstruction results of the 2D surface source term.
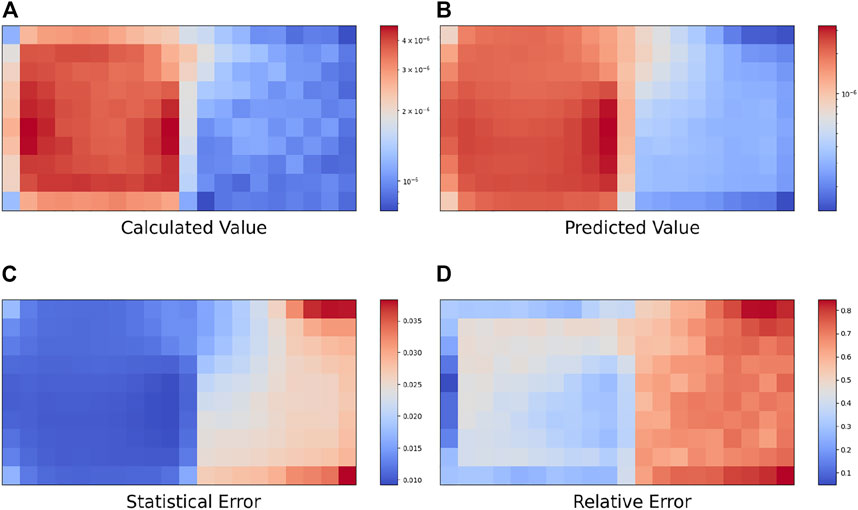
FIGURE 12. Reconstruction results of the 3D cylindrical source term.
The neural network used in this study has an input layer with 27 nodes and an output layer with 2000 nodes, with three hidden layers of 8, 64, and 512 nodes to reduce the feature dimensions. The mean squared error (MSE) function was chosen as the loss function, and the rectified linear unit (ReLU) function was selected as the activation function, with PCT used to evaluate the training performance. The data set was divided into a training set, validation set, and testing set of 3825, 1026, and 553 samples, respectively, with a ratio of 7:2:1. The calculation results are presented below.
4.1 Reconstruction results of the five source terms
(1) Single Energy Point Source
When the radiation source is a single energy neutron point source, the neutron energy range is 0.00253 eV–2.00 MeV, the average PCT value of the test set is 0.53%, and the maximum PCT value between different batches is 1.12%. The average statistical error of the Monte Carlo calculation of the photon flux is 1.86%. The average relative deviation in the whole space MESH grid is 5.23%, and the average relative deviation in the MESH grid on the left side of the wall is 2.49%.
(2) Maxwell Fission Spectrum Point Source
When the radiation source follows the Maxwell fission spectrum distribution, the average PCT value on the test set is 3.11%, and the maximum PCT value between different batches is 3.66%. The average statistical error of the Monte Carlo calculation of the photon flux is 1.82%. The average relative deviation in the whole space MESH grid is 32.67%, and the average relative deviation in the MESH grid on the left side of the wall is 19.78%.
(3) Double-Point Source
When the radiation source is a double-point source, which uses a discrete neutron distribution, the other source utilizes a neutron distribution from the Maxwell fission spectrum. In the test set, the average PCT value was 0.80%, and the maximum PCT value between different batches was 1.43%. The average statistical error of the Monte Carlo calculation of the photon flux is 1.57%. The average relative deviation in the whole space MESH grid is 7.21%, and the average relative deviation in the MESH grid on the left side of the wall is 6.71%.
(4) 2D Surface Source
When the radiation source is in a 2D surface source distribution, the radioactive sources are distributed on the circular surface. In the test set, the average value of PCT is 0.92%, and the maximum value of PCT between different batches is 1.46%. The average statistical error of the Monte Carlo calculation of the photon flux is 1.66%. The average relative deviation in the whole space MESH grid is 36.75%, and the average relative deviation in the MESH grid on the left side of the wall is 17.69%.
(5) 3D Cylindrical Source
When the radiation source is in a 3D cylindrical source distribution, the radioactive sources are distributed in the cylinder, with the weight related to the radius. In the test set, the average PCT value was 1.98%, and the maximum PCT value between batches was 2.79%. The average statistical error of the Monte Carlo calculation of the photon flux is 2.02%. The average relative deviation in the whole space MESH grid is 56.22%, and the average relative deviation in the MESH grid on the left side of the wall is 42.59%.
4.2 Comparison and discussion of reconstruction results
In summary, the reconstruction results of the MLP network for photon flux distribution in radiation field space under different source intensities are shown in Table 2. The mean PCT of the test set ranges from 0.53%–3.11%, and the maximum value is 3.66%, which is less than the error range of the given input measured value (±10.00%). For simple source items, this method can obtain acceptable radiation field prediction values. However, for more complex source items, the relative deviation of the predicted value of the radiation field is larger. This result shows that this method can be used to predict the simple gamma radiation field.
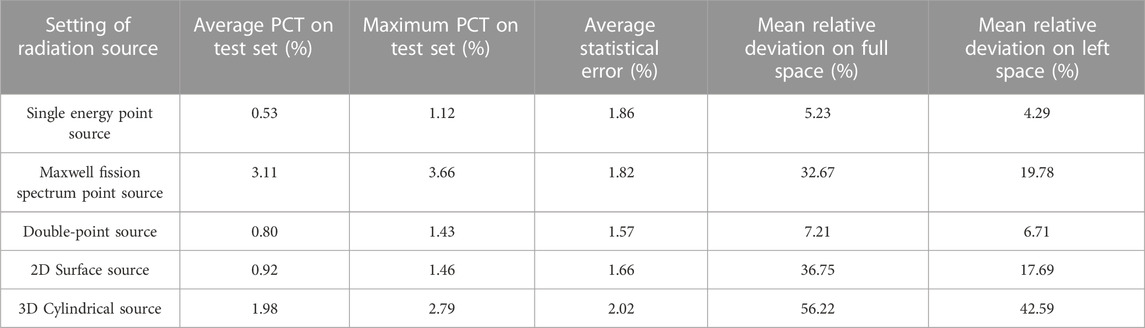
TABLE 2. Summary of reconstruction of radiation field by MLP neural network.
From the results summarized in Table 2, it can be found that the radiation field prediction using a single-energy neutron source and a double-point source has better performance than the other three methods. As the energy spectrum parameters and spatial distribution of the source term become more complex, the prediction results of the neural network become more general. The specific analyses are as follows:
(1) The results demonstrate that when the source parameters are relatively simple, both PCT and calculated values exhibit small relative deviations from the predicted values. However, under complex source parameters, although the PCT is low, the relative error is high and does not match the predicted values. This can be attributed to the fact that the MLP neural network employed in this study is relatively simple, thereby making it difficult to adapt to the extensive spatial distribution and energy spectrum parameter changes of complex source items. Moreover, the generalization capability of the MLP neural network model is limited, and while it performs well on the training set, it does not provide satisfactory prediction results for data outside it. Furthermore, the neural network used in this study exhibits overfitting problems for complex source items, which can be mitigated by increasing the data volume and using dropout and other techniques. Thus, to improve the accuracy of the predictions, one must consider employing a more sophisticated neural network model that is capable of adapting to complex source parameters.
(2) The single-energy neutron source term emits neutrons with equal energy, while the influence of the 3D radiation field is relatively uniform. Therefore, there is a relatively fixed relationship between the sampling value of the detector sampling point and the radiation field of the whole space. When the parameters of the source term become more complex, the neutrons emitted by the source term need to be sampled according to energy, position and angle, and the complexity is greatly increased. Therefore, the relationship between the sampling value of the detector sampling point and the whole space radiation field becomes more complicated, which eventually leads to relatively poor prediction results of the neural network.
(3) The scattering term in the radiation field greatly increases the complexity of the radiation field. Since a wall divides the geometric space into two parts, neutrons can only reach the space on the right side of the wall through multiple scattering. The complex relationship of the sampling value and photon radiation field in the space on the right side of the wall is greatly increased, ultimately leading to relatively poor prediction results of the neural network. Therefore, the prediction effect of the space on the left side of the wall is much better than that of the space on the right side of the wall.
In conclusion, the neural network method has a certain application in the reconstruction of 3D radiation fields, but its predictive performance is affected by factors such as the source item energy spectrum distribution, source item spatial distribution, and scattering terms. In the test scenarios of this study, satisfactory radiation field prediction results were only achieved under the conditions of a single-point source and double-point source. Due to the numerous influencing factors, there is no neural network structure that can effectively solve all radiation field reconstruction problems. Therefore, further investigation is required to explore the effectiveness of the neural network method for radiation field reconstruction under complex source item conditions. In addition, the effects of different neural network types, structures, and hyperparameters on the reconstruction of 3D radiation fields also need to be compared and verified in future studies.
5 Conclusion
In this paper, to solve the common problem of radiation field reconstruction in practice, the reconstruction algorithm of the 3D gamma radiation field from individual sampling points under the source term parameters is studied. We then propose an algorithm for reconstructing the 3D gamma radiation field based on finite sampling values using neural networks, and different distributed source terms are then tested using common complex geometric examples that exist in real use. During the process of neural network training, the Monte Carlo method is used to calculate the distribution of the 3D radiation field used in this paper. To obtain the data set required for training, a five-layer MLP neural network is trained that then identifies the reconstruction function of the 3D gamma radiation field. By testing different distribution source terms, the mean PCT is identified as 0.53%–3.11%, and the maximum value is 3.66%, which is less than the error range (±10%) of the given input measured value, verifying the feasibility and accuracy of the proposed method for the prediction of the gamma radiation field.
The above research results provide positive benefits, as they have broad application prospects for strengthening the radiation protection of on-site operators of nuclear devices, reducing the radiation damage suffered by operators, more accurately evaluating the spatial dose distribution of nuclear facilities that are to be decommissioned, and reducing the collective dose absorbed throughout the life cycle of nuclear facilities. In addition, with the in-depth application of machine learning in recent years, the reconstruction of the radiation field using neural networks may become the next research focus in the field of radiation protection, which is of exploratory significance for the optimization of sites emitting radiation.
Furthermore, research can be continued from the following three aspects. (1) The neural network model used in this paper is relatively basic. Thus, it is necessary to test and study the application of other neural network models in complex radiation dose fields in the future. (2) The 3D model established in this paper is relatively simple, while the reactor geometry and source terms in practice are more complex. In the future, it is also necessary to explore the influence of the number and distribution of different sampling points on the radiation field reconstruction method. (3) In this paper, only the reconstruction of the photon radiation field is verified, and the reconstruction method of the neutron radiation field can be explored in the future.
Data availability statement
The original contributions presented in the study are included in the article/Supplementary Material, further inquiries can be directed to the corresponding authors.
Author contributions
HY: Data analysis, Methodology, Validation, Formal analysis, Visualization Software, Writing Original Draft, recording image data WZ: Data analysis, Methodology, recording image data, Writing Original Draft, Formal analysis, Validation PY: Conceptualization, Methodology, Software, Investigation ZY: Validation, Formal analysis, Visualization Review and Editing QR: Resources, Writing—Review and Editing, Supervision, Data Curation ZH: Conceptualization, Resources, Writing—Review and Editing, Supervision, research Project administration and Funding acquisition LJ: Resources, Writing—Review and Editing, Supervision.
Funding
This work is supported by the National Natural Science Foundation of China (General Program) (U2167209, 12175114); the National Key R&D Program of China (2021YFF0603600); and the Tsinghua University Initiative Scientific Research Program (20211080081).
Conflict of interest
Author WZ was employed by Nuctech Company Limited.
The remaining authors declare that the research was conducted in the absence of any commercial or financial relationships that could be construed as a potential conflict of interest.
Publisher’s note
All claims expressed in this article are solely those of the authors and do not necessarily represent those of their affiliated organizations, or those of the publisher, the editors and the reviewers. Any product that may be evaluated in this article, or claim that may be made by its manufacturer, is not guaranteed or endorsed by the publisher.
References
Hughes, S. (1996). Occupational exposures at nuclear power plants, 1969-1993: ISOE report[J]. J. Radiological Prot. 16 (1), 016.
Li, M., Liu, Y., Peng, M., Xie, C. L., and Yang, L. Q. (2018). A fast simulation method for radiation maps using interpolation in a virtual environment. J. Radiological Prot. 38 (3), 892–907. doi:10.1088/1361-6498/aac392
Liu, Z., Peng, M., and Zhu, H., (2011). Research on framework of virtual simulation system of nuclear facilities decommissioning (in Chinese) [J]. Atomic Energy Sci. Technol. 45 (9).
Mahdavi, S. R., Tavakol, A., Sanei, M., Molana, S. H., Arbabi, F., Rostami, A., et al. (2019). Use of artificial neural network for pretreatment verification of intensity modulation radiation therapy fields. Br. J. Radiology 92 (1102), 20190355. doi:10.1259/bjr.20190355
Sai, X., Chen, Y., and Wei, M. (2016). Preliminary application of Multiquadric scattered data interpolation technique in gamma radiation field visualization[J]. Nucl. Tech. 39 (10).
Wang, Z., and Cai, J. (2018). Inversion of radiation field on nuclear facilities: A method based on net function interpolation. Radiat. Phys. Chem. 153, 27–34. doi:10.1016/j.radphyschem.2018.09.003
Zhong, X., and Ban, H. (2022a). Crack fault diagnosis of rotating machine in nuclear power plant based on ensemble learning. Ann. Nucl. Energy 168, 108909. doi:10.1016/j.anucene.2021.108909
Zhong, X., and Ban, H. (2022b). Pre-trained network-based transfer learning: A small-sample machine learning approach to nuclear power plant classification problem. Ann. Nucl. Energy 175, 109201. doi:10.1016/j.anucene.2022.109201
Zhong, X., Wang, F., and Ban, H. (2022). Development of a plug-and-play anti-noise module for fault diagnosis of rotating machines in nuclear power plants. Prog. Nucl. Energy 151, 104344. doi:10.1016/j.pnucene.2022.104344
Zhou, W., Sun, G., Yang, Z., Wang, H., Fang, L., and Wang, J. (2021). BP neural network based reconstruction method for radiation field applications. Nucl. Eng. Des. 380, 111228. doi:10.1016/j.nucengdes.2021.111228
Zhu, M., Chen, D., and Yang, H. (2010). Optimization and analysis of main coolant pump decontamination schemes in tianwan nuclear power station (in Chinese) [J]. Radiat. Prot. 2010 (03), 181–186.
Keywords: 3D radiation field, reconstruction method, Monte Carlo, artificial intelligence, neural network
Citation: Yisheng H, Zhen W, Yanheng P, Yuhang Z, Rui Q, Hui Z and Junli L (2023) Validation of the neural network for 3D photon radiation field reconstruction under various source distributions. Front. Energy Res. 11:1151364. doi: 10.3389/fenrg.2023.1151364
Received: 26 January 2023; Accepted: 20 March 2023;
Published: 03 April 2023.
Edited by:
Xingang Zhao, Oak Ridge National Laboratory (DOE), United StatesReviewed by:
Jiankai Yu, Massachusetts Institute of Technology, United StatesXinyan Wang, Massachusetts Institute of Technology, United States
Copyright © 2023 Yisheng, Zhen, Yanheng, Yuhang, Rui, Hui and Junli. This is an open-access article distributed under the terms of the Creative Commons Attribution License (CC BY). The use, distribution or reproduction in other forums is permitted, provided the original author(s) and the copyright owner(s) are credited and that the original publication in this journal is cited, in accordance with accepted academic practice. No use, distribution or reproduction is permitted which does not comply with these terms.
*Correspondence: Qiu Rui, cWl1cnVpQHRzaW5naHVhLmVkdS5jbg==; Li Junli, bGlqdW5saUBtYWlsLnRzaW5naHVhLmVkdS5jbg==