 Zhanlong Zhang
 Xiaomei Pan
 Zijian Dong
 Xuemeng Wang
- State Key Laboratory of Transmission and Distribution Equipment and System Safety and New Technology, Chongqing University, Chongqing, China
A large amount of contaminants are collected on the cardboard surface of the valve-side bushing outlet of a converter transformer that has been operating for a long period, and can cause the performance of the oil–paper insulation to degrade. The analysis of their energy spectrum has shown that these contaminants contain free carbon. To investigate causes of the formation of these carbon traces, the authors of this study analyze their law of growth on the surface of the insulating paper in the presence of pure insulating oil and insulating oil containing carbon particles. We examined the influence of carbon tracks of different lengths on the breakdown voltage along the surface of the oil–paper insulation. The results showed that carbonization on the surface of the insulating paper generated carbon traces in pure insulating oil and eventually led to the formation of conductive channels. Moreover, carbon traces were generated by carbon particles deposited on the surface of the insulating paper in insulating oil containing carbon particles. The carbon traces grew from the high-voltage electrode to the ground electrode along the direction of the electric field in both types of oils. The formation of the conductive channel through the poles of the paper in insulating oil containing carbon particles required a lower voltage and a shorter discharge time than that in pure insulating oil. As the concentration of the carbon particles increased, the rate of growth of carbon traces on the surface of the insulating paper increased such that the oil–paper insulation failed earlier than otherwise. Long carbon traces were formed on the surface of the insulating paper in case of a high concentration of carbon particles under the DC pre-pressure mode, and this led to a reduction in the breakdown voltage along the surface of the oil–paper insulation.
1 Introduction
High-voltage direct-current (HVDC) transmission is a key means of optimizing the allocation of renewable energy, and offers a number of advantages in solving the problems of long-distance transmission (Teng et al., 2022). As it is a core component of the HVDC transmission system, the safe operation of the converter transformer is crucial to the overall performance of the system (Chen et al., 2018; Cheng et al., 2019). While the converter transformer mainly uses oil–paper insulation as internal insulation (Zhang et al., 2021), this insulation may develop defects during its operation such that the local field strength becomes concentrated at the relevant sites. Carbon particles are inevitably introduced to the insulating oil during the manufacture, operation, and maintenance of the converter transformer (Tang et al., 2017). These particles accumulate in the region of a high electric field under the action of DC voltage, and are deposited on the surface of the insulating paper to form carbon traces. Compared with those in pure insulating oil, carbon traces on the surface of the cardboard in insulating oil containing carbon particles grow more quickly and have a more significant impact on the electrical field strength of the oil–paper insulation. Therefore, studying the law of growth of carbon traces on the surface of insulating paper under different concentrations of carbon particles as well as the law of influence of their length on the breakdown voltage along the surface of the oil–paper insulation can ensure the safe and stable operation of the converter transformer.
Many studies have investigated the morphology of surface damage to insulating paper caused by discharge. Needle–plate electrodes have been used to conduct creeping discharge tests and found that intensive creeping discharge leads to the formation of white spots on the cardboard surface that expand with the applied voltage and the duration of operation of the converter transformer (Dai et al., 2010; Ma et al., 2013; Huang et al., 2019). The presence of white spots will trigger discharge (Yi and Wang, 2013; Cheng et al., 2016; Zhou et al., 2020). The released energy burns cellulose to form black carbon traces that signify irreversible damage and intensify the discharge until flashover. Past work has shown that carbon traces develop simultaneously along the surface of and inside the cardboard, eventually reaching the ground electrode (Cheng et al., 2009). Research on the pattern of deposition of particles on the insulating surface has mainly focused on the insulators used. The characteristics of accumulation of dirt on the surface of insulators under different voltages have been investigated as well, and the results have shown that the environment of the electric field significantly influences this process (Horenstein and Melcher, 1979; Liu et al., 2009; Lan et al., 2017). Fewer studies have dealt with the patterns of particle accumulation on the cardboard surface of an oil–paper insulation, and the similarities and differences between the patterns of growth of carbon traces on the cardboard surface in pure insulating oil and insulating oil containing carbon particles.
Participants at IEEE conferences have pointed out that solid particles significantly impact the safe operation of the transformer (Miners, 1982). Prevalent research on particles in transformers has focused on their effects on the breakdown voltage of insulating oil. Research has shown that particles in insulating oil can significantly reduce the breakdown voltage of insulating oil, and conductive particles have a greater impact on its breakdown than non-conductive particles (Wang et al., 2011; Zhang et al., 2017; Ghoneim et al., 2019; Mengzhao et al., 2019; Saaidon et al., 2021). Moreover, copper particles and air bubbles in oil trigger a higher creeping discharge of the oil–paper insulation (Thirumurugan et al., 2019). An experimental study on the effects of carbon particles on the characteristics of AC discharge of insulating paper found that carbon particles influence the development of creeping discharge of the insulating cardboard (Vincent et al., 1994). However, few studies have examined the effects of carbon particles on the properties of oil–paper insulation under a DC electric field.
In this paper, the authors build an experimental platform for DC voltage to study carbon traces on cardboard during the creeping discharge of the oil–paper insulation. The pattern of growth of carbon traces on the surface of the cardboard insulation during the entire process of failure, from pressurization to breakdown, was observed in pure insulating oil and insulating oil containing carbon particles. We analyzed the characteristics of damage to the oil–paper insulation caused by the presence of carbon particles in the insulating oil. Moreover, we investigated the influence of different concentrations of carbon particles on the breakdown voltage along the surface of the oil–paper insulation. The result is a complete theoretical basis for evaluating the state of oil–paper insulations in converter transformers.
2 Experimental setup
2.1 Experimental platform
Tip-type defects are most likely to trigger creeping discharge, and are typical of defects in transformer oil–paper insulations. We thus used needle–plate electrodes to simulate the process of creeping discharge on the surface of the oil–paper insulation under an extremely inhomogeneous electric field (Pattanadech and Muhr, 2016). The test platform for the partial discharge of the oil–paper insulation built in this paper is shown in Figure 1. Rx is the resistance, which plays a limiting role during the breakdown of the specimen in protecting the test equipment from damage. ZD is the detection impedance, which converts the pulse current signal into a voltage signal in an oscilloscope to measure the starting discharge voltage of the oil–paper insulation under the needle–plate electrode. A DSLR camera was used to take real-time pictures of morphological changes on the surface of the cardboard.
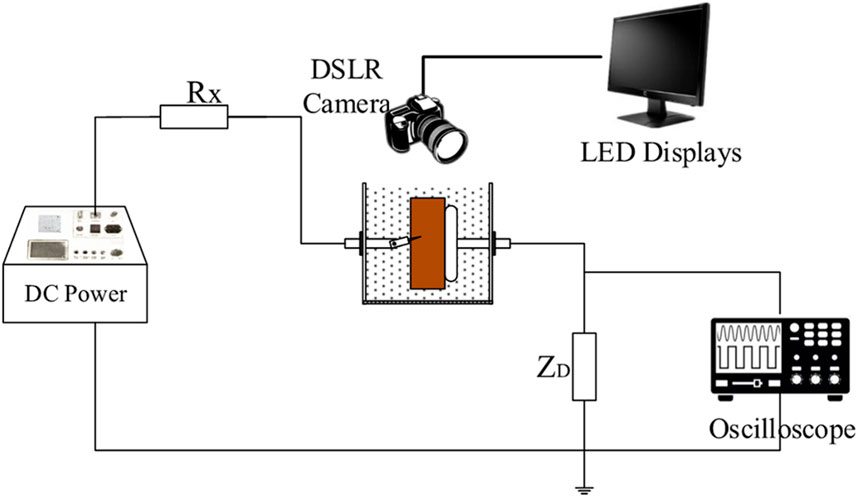
FIGURE 1. Schematic diagram of partial discharge test platform.
The model of the needle–plate electrode is shown in Figures 2A,B. The needle electrode was connected to the DC power supply system. The tip of the needle had a radius of curvature of 100 μm, and was pressed against the insulating cardboard at an angle of 30°. The plate electrode was grounded, and had a diameter of 60 mm. A small groove with a width of 1 mm was set in it to hold the insulating cardboard. To obtain the distribution of intensity of the electric field of the needle–plate model, we used COMSOL Multiphysics software to simulate the electric field. Figure 3 shows the distribution of the intensity of the electric field on the surface of the insulating board when an external DC voltage of 32 kV was applied. The shades of color and sizes of arrows in the figure indicate the intensity of the electric field while the directions of the arrows indicate its direction. It shows that the intensity of the electric field on the surface of the cardboard around the tip of the needle was the highest, that on the surface of the insulating paper far from the tip of the needle decreased, and the electric field was directed from the tip of the needle toward the plate electrode.
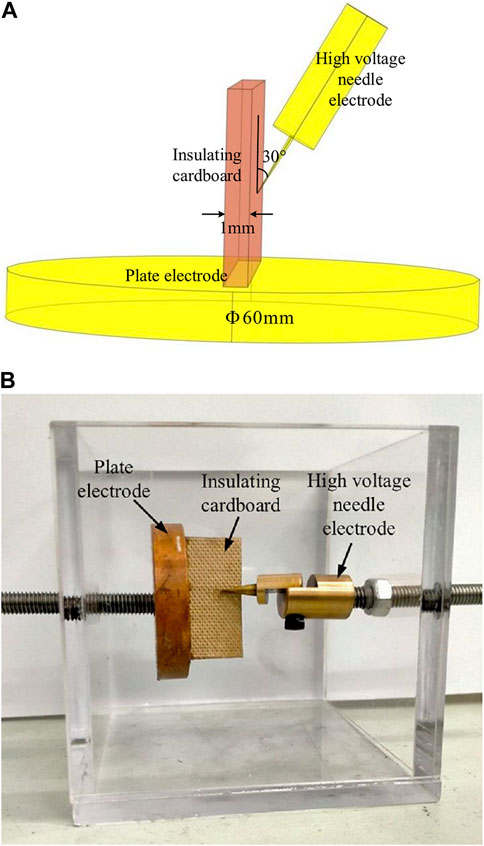
FIGURE 2. Structure and physical of electrode model: (A) Electrode structure diagram and (B) Electrode physical diagram.
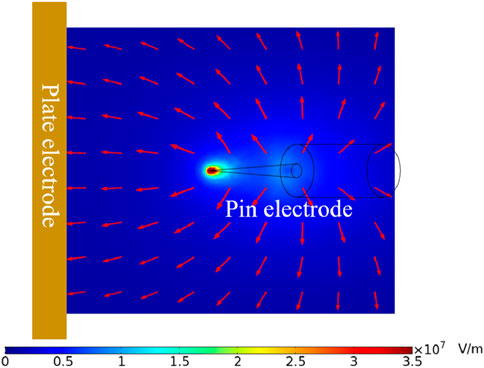
FIGURE 3. Electric field distribution on the surface of cardboard at 32 kV.
2.2 Experimental samples
Samples of No. 25 kratom transformer oil were used along with a 1-mm-thick rectangular insulating cardboard of size 50 mm × 10 mm. To avoid the influence of other solid particles in it, the insulating oil was first filtered by using a filter membrane with a pore size of 0.8 μm to ensure that the number of solid particles larger than 5 μm per 100 mL of filtered insulating oil was smaller than 300. Following this, the insulating paper was pretreated by vacuum-drying. It was left in a vacuum drying chamber at 90 C and 50 Pa for 12 h, was injected with transformer oil, and was then vacuum-impregnated at 80 C and 50 Pa for 24 h to reduce the influence of the high water contents of the insulating oil and insulating cardboard on the results. The current monitoring of impurity particle content in transformer insulating oil showed that the particle size of solid particles in transformer insulation oil was mainly distributed in the range of 1–100 μm under operating conditions. Therefore, carbon particles with a median particle size of 20 μm were used, and their particle size distribution is shown in Figure 4. The median size of the solid particles is a measure of the particle size distribution, and indicates the particle size of the sample when the cumulative percentage of the particle size distribution reaches 50%.

FIGURE 4. Distribution diagram of carbon particle diameters.
Carbon particles are spherical and uniformly distributed. Samples containing different concentrations of carbon particles were obtained by weighing a specific numbers of carbon particles and adding them to the pure insulating oil after treatment. The number of carbon particles per 100 mL of an oil sample was expressed as N, and N1∼N3 had values of 10,000, 50,000, and 10,0000, respectively. The prepared samples of insulating oil needed to be ultrasonically shaken at room temperature for 10 min to ensure that the carbon particles had been uniformly mixed in the transformer oil.
3 Experimental results and discussion
Due to the influence of factors such as the production process and operating environment, there are inevitably defects such as moisture, air bubbles, burrs, and contaminants inside the operating converter transformer, resulting in the increase of the partial electric field of the oil-paper insulation and causing discharge. The failure of insulation caused by the discharge of the oil–paper insulation interface is a major fault in the converter transformer. The insulating oil is easily contaminated by solid particles, including carbon particles, that degrade the performance of the oil–paper insulation. Insulating oil containing carbon particles breaks down in a shorter time than pure insulation oil in case of discharge, which seriously affects the normal operation of the converter transformer. We examined carbon traces on the surface of the cardboard at different concentrations of carbon particles to examine the mechanism of influence of carbon particles on the failure of the oil–paper insulation.
3.1 Development of carbon trances on cardboard surface in pure oil
We used the constant voltage method to study the traces of creepage by implementing an uneven needle–plate model. When the externally applied voltage is high, the discharge may occur at other locations. The discharge energy at the needle tip position is very low and does not easily produce carbon traces. We thus first used AC voltage to create air gaps, each no larger than 0.05 mm. When the electric field at the needle tip exceeds a certain value, a partial discharge was first caused by the microscopic air gap defect. The discharge channel was generated from the needle tip, followed by the growth of carbon traces on the cardboard surface. The selected voltage could not be too small as this would have led to partial discharge such that the development of defects would not have been stable. It could also not be too large as this would have led to the breakdown of the oil–paper insulation. We conducted six preliminary experiments under the same conditions to measure the initial discharge voltage and the breakdown voltage. We set the ramp-up speed to 2 kV/min, and the results are shown in Figure 5. The initial discharge voltage of the oil–paper insulation was about 23 kV, the short-term breakdown voltage was about 44 kV, and these values did not fluctuate by much. Four DC voltages of 38 kV, 39 kV, 40 kV, and 41 kV were selected to carry out the corresponding creeping discharge tests. Five repetitions of experiments at each set of voltages were performed according to the IEC standard, and the growth of carbon traces was observed by using an SLR camera. Because the results of each group of tests were similar, the development of carbon traces on the insulating cardboard at a DC voltage of 40 kV was chosen for subsequent experiments. Figure 6 shows the process of development of carbon traces on the cardboard surface during the failure of the insulation.
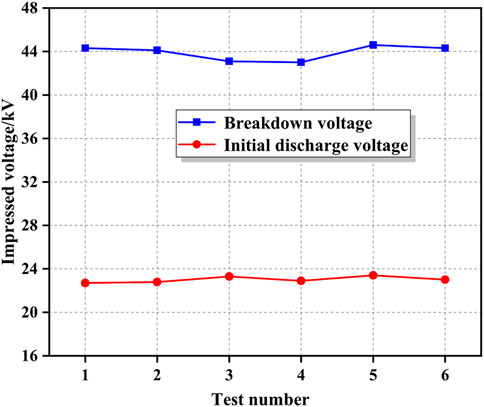
FIGURE 5. Initial discharge voltage and breakdown voltage under pre-experiment.
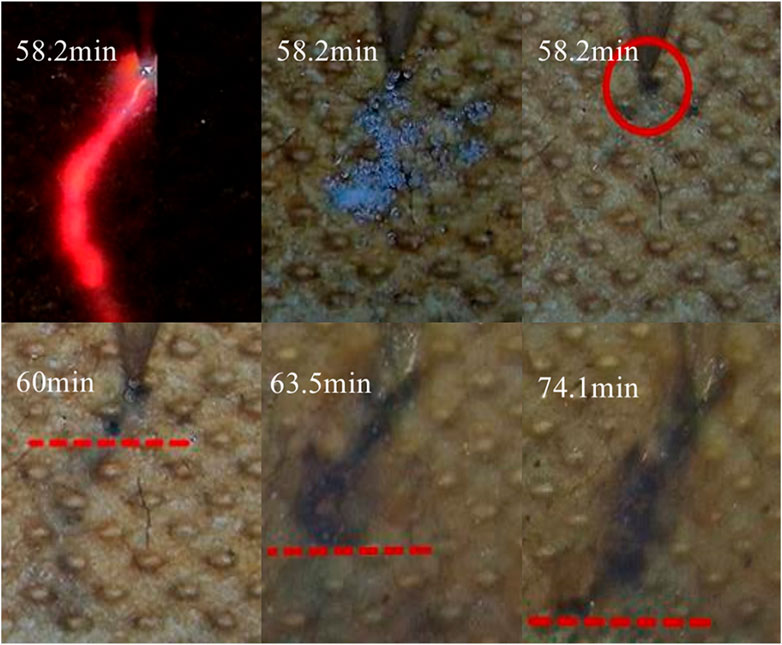
FIGURE 6. Carbon trace development process on cardboard surface in pure insulating oil.
Figure 6 shows that when a DC voltage of 40 kV was applied to the cardboard, a small number of bubbles first appeared at the tip of the pin during the initial stage of pressurization, and corona discharge occasionally appeared in the area of contact between the pin electrode and the insulating cardboard. As voltage was continuously applied, bubbles appeared at other locations of the insulating board and increased in number. The frequency of discharge sparks increased, and was accompanied by a crisp discharge sound. About 58.2 min later, a bright red discharge channel appeared on the surface of the insulating board that also served as a channel for the subsequent growth of carbon traces. A large amount of gas, such as CH4 and H2, was generated after the bright discharge channel had disappeared, mainly due to energy generated by the partial discharge that led to the cracking of the insulating oil. After this stage of development, a visible carbon scar appeared on the contact surface of the needle level with the insulating cardboard, mainly due to multiple electron avalanches at this location, where the charged particles continuously hit the cardboard generating enough heat to carbonize the cellulose. The energy generated by a single electron avalanche was minimal and can only carbonize a tiny part of the insulating paper. When the pressure was continuously applied, the number of electron avalanches increased, the carbonized area of the insulating paper increased, and the gas produced by the decomposition of cellulose increased, which promotes the development of carbonized traces. The carbon trace grew forward along the discharge channel from the needle electrode and eventually developed to the insulating paperboard breakdown at the plate electrode.
The maximum lengths of the carbon traces over time at different applied voltages are shown in Figure 7. It refers to the straight-line distance between the tip of the needle and the most distal end of the carbon trace. The carbon marks showed a trend of rapid growth followed by slow growth at different voltages, and the oil–paper insulation failed when the carbon marks grew to the plate electrode. The main reason for the decline in the rate of growth of the carbon marks was that the products of discharge homogenized the electric field at the end of the high-voltage stage such that the electric field was weakened. The times-to-failure of the oil–paper insulation were 94.9 min at 38 kV, 76.3 min at 39 kV, 74.1 min at 40 kV, and 67.5 min at 41 kV. Therefore, the higher the applied voltage was, the higher was the rate of failure of the insulation, and the more serious was the damage to the insulation board. When the externally applied voltage was low, a longer continuous discharge was needed to produce serious marks of carbonization on the cardboard surface.
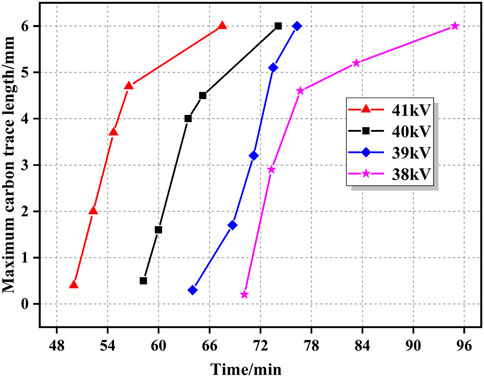
FIGURE 7. Trend of maximum carbon trace length with time at different applied voltages.
3.2 Development of carbon traces on cardboard surface in oil containing carbon particles
We also conducted a partial discharge test of an oil–paper insulation in pure insulating oil by using the needle–plate electrode. Following the application of a constant DC voltage, the partial discharge caused fibers of the insulating paper to break their bonds and loosen. Partial discharge and other discharges inevitably occur during the operation of the converter, and lead to the carbonization of the insulating paper and oil as well as the precipitation of free carbon particles. Over the long-term operation of the converter transformer, the carbon particles gather in the area with a high field strength on the valve-side bushing. Obtaining a sufficient number of carbon particles through the partial discharge test of the oil–paper insulation is impossible due to limitations of the test conditions. Therefore, we configured three concentrations of carbon particles, defined as N1, N2, and N3, according to the index for the classification of particles in insulating oil from the CIGRE Brochure157, and controlled the number of carbon particles per 100 mL of insulating oil to 10,000, 50,000, and 100,000. The effect of the carbon particles on the characteristics of growth of carbon traces on the surface of the insulating cardboard was investigated, and the characteristics of failure of the oil–paper insulation were tested under different particle concentrations.
Because carbon particles have a very small diameter, a large transparent glass box was used in the experiments. It is difficult to observe the motion of carbon particles under the creeping discharge of the needle–plate electrode, because of which we photographed only the process of deposition of carbon particles around the needle electrode. The parameters of the electron microscope and the brightness of the light source were adjusted to ensure clear imaging of the carbon particles. The particles acquired a negative charge after colliding with the grounded electrode and subsequently moved toward the high-voltage needle electrode under the action of the electric field and the traction force. The carbon particles collided with the surface of the insulating paper around the needle electrode and adhered to the surface or rebounded under the combined effects of the adhesive force, electric field force, damping force, elastic force, and capillary force. The rough surface of the insulating paper improved the adhesion of carbon particles to it. Furthermore, the rebounding carbon particles started moving toward the ground electrode due to the reversal of charge polarity, and collided with the insulating paper again and adhered to it under the action of a multi-physical field. Figure 8 shows the trajectory of deposition of the carbon particles obtained by electron microscopy. The particles are marked with red circles in the figure. The charged particles moved toward the needle electrode under the action of an electric field, and were finally deposited on the surface of the insulating paper. A schematic diagram of the growth of carbon traces on the surface of the insulating paper is shown in Figure 9A. Carbon particles in insulating oil were mainly subjected to the combined force of gravity and buoyancy FG, electric field force FE, dielectrophoretic force Fdep and traction force FD moving toward the surface of insulating paper. The deposition morphology of carbon particles on the insulating paper surface was divided into horizontal and vertical directions. The horizontal direction was the regular arrangement of carbon particles along the parallel electric field direction on the insulating paper surface, thus increasing the length of carbon marks on the insulating paper surface. The vertical direction was the deposition of carbon particles along the normal direction on the insulating paper surface, thus increasing the thickness of carbon marks on the insulating paper surface.
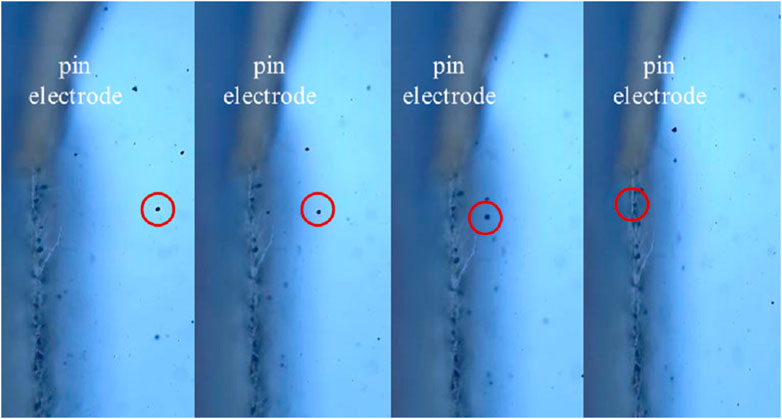
FIGURE 8. Carbon particle deposition trajectory.
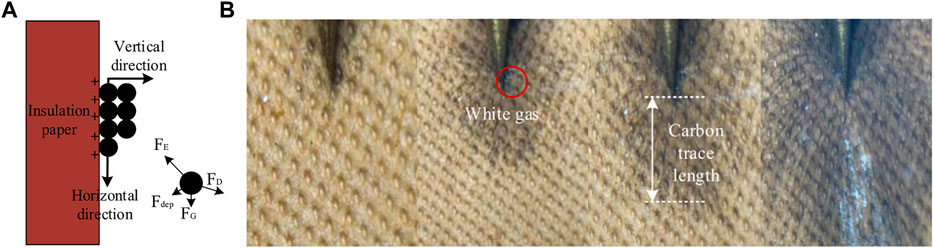
FIGURE 9. Carbon trace development process on cardboard surface in insulating oil containing carbon particles: (A) Schematic diagram and (B) Physical diagram.
A constant DC voltage of 25 kV was externally applied, and the black area on the surface of the insulating paper represents the carbon traces. The development of carbon traces on the surface of cardboard in insulating oil containing carbon particles is shown in Figure 9B. Under the action of an externally applied DC voltage, the carbon particles attached to the surface of the insulating paper and adsorbed certain charges to form a charged body. This changed the distribution of the electric field on the surface of the insulating paper and led to its distortion. Corona discharge occurred on the surface of the insulating paper, and the needle electrode near the area of the carbon traces contained white gas that was formed mainly due to the evaporation of water inside the cardboard or the decomposition of gas residue of the insulation oil. However, under the influence of a DC electric field, white gas quickly disappeared and failed to form a white spot. At this time, the number of discharges was small, the frequency of the “bared” sound was low, and the discharge intensity was weak. With the growth of the pressurization time, the thickness of the carbon traces produced by the carbon particle adhesion increased. Then the carbon traces gradually developed from the needle electrode to the ground electrode. The number of discharges increased, the frequency of the “bare” sound increased, and the intensity of the discharge increased, finally forming a conductive channel through the two levels, causing the oil paper insulation to break down along the surface. A large amount of white gas appeared on the surface of the carbon trace.
To obtain the statistical law of development of carbon traces on the surface of the cardboard under different concentrations of carbon particles, we analyzed the lengths of the carbon traces over time under three particle concentrations (N1–N3). The results are shown in Figure 10. The length of the carbon traces was the distance between the farthest end of the black area and the tip of the needle. It is clear that the length of the carbon traces on the surface of the insulating cardboard increased over time. A comparative analysis of the slope of the folding line shows that the rates of growth of carbon traces on the surface of the insulating cardboard in insulating oil under all concentrations of carbon particles underwent a transition from low to high and then low again. When carbon particles were deposited on the surface of the insulating paper, bumps were formed on it. This led to greater charge aggregation, and increased attraction to the charged carbon particles in the insulating oil. Carbon particles were thus deposited more quickly on the surface of the insulating paper. A conductive channel was formed when the carbon traces were close to the ground electrode. The oil–paper insulation then broke down. The times-to-failure of the oil–paper insulation were 20.5 min when the concentration was N1, 14.3 min when the concentration was N2, and 6.2 min when the concentration was N3. These test results show that under an external voltage, the rate of growth of carbon traces accelerated as the concentration of carbon particles increased and the oil–paper insulation failed more quickly.
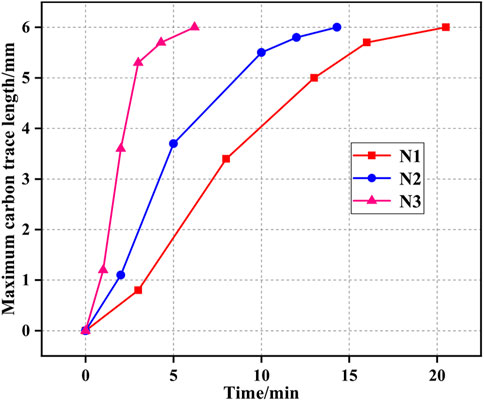
FIGURE 10. Trend of maximum carbon trace length with time under different carbon particle concentrations.
3.3 Effects of different concentrations of carbon particles on properties of oil-paper insulation
The analysis of carbon traces on the cardboard in pure oil and oil containing carbon particles showed that when a discharge-induced fault occurred in the converter transformer in pure insulating oil, carbonization on the surface of the insulating paper produced carbon traces that eventually formed conductive channels. The carbon particles deposited on the surface of the insulating paper produced carbon traces in the insulating oil containing carbon particles. Compared with this, the formation of carbon traces through the poles of the cardboard in pure insulating oil required a higher voltage and a longer discharge time. Thus, when the applied voltage was low, the insulation could last a long time without breaking down even if there was a defect in it. However, the formation of channels of carbon traces through the poles of the cardboard in insulating oil containing carbon particles required a lower voltage and a shorter discharge time. This caused the oil–paper insulation to easily fail when a defect occurred in it.
We used the DC pre-pressure mode for a breakdown test to analyze the effects of different concentrations of carbon particles on the breakdown voltage along the surface. Samples with different concentrations of carbon particles were first pre-pressured at 25 kV for 5 min, and different degrees of carbon traces subsequently appeared on the surface of the insulating paper. The samples were directly ramped up to breakdown at 1 kV/s for repetitive tests. Figure 11 shows the trend of changes in the breakdown voltage along the surface with the concentration of the carbon particles. The breakdown voltage along the surface was 45 kV in pure insulating oil. When the concentration of carbon particles in the insulating oil was N1, the breakdown voltage along the surface was 40 kV, 5 kV lower than that in pure insulating oil. When the concentration of carbon particles in insulating oil was N2, the breakdown voltage along the surface was 36 kV, 9 kV lower than that in pure insulating oil. The breakdown voltage along the surface was 33 kV when the concentration of carbon particles in insulating oil was N3. This was 12 kV lower than that in pure insulating oil. By comparison, it was found that in pure insulating oil, a short period of applied voltage did not produce obvious carbon marks, the breakdown voltage along the surface was high, and the insulation performance of oil paper was good. When carbon particles were in the insulating oil, under the action of the electric field, carbon particles were deposited on the surface of the insulating paper to form carbon marks. The conductive area at the high voltage end was enlarged to shorten the distance between electrodes, which increases the electric field strength on the surface of the insulating paper and affects the breakdown voltage along the surface of oil-paper insulation. When the concentration of carbon particles in the insulating oil was small, the area of carbon traces at oil-paper interface was small, and the influence on the breakdown voltage along the surface was small. When the concentration of carbon particles in the insulating oil increased, more carbon particles were deposited to the oil-paper interface to form a larger area of carbon traces, and the influence on the breakdown voltage along the surface will increase.
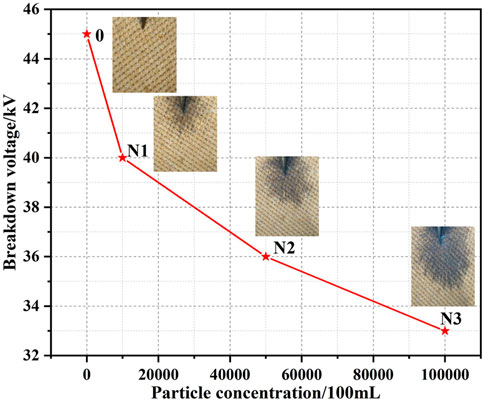
FIGURE 11. Trend of surface breakdown voltage with particle concentration.
4 Discussion
The above results show that carbon particles in oil moved under the action of an electric field, and were deposited on the surface of the insulating paper. The carbon particles attached to the paper affected the distribution of the nearby electric field and changed their trajectory in oil. Their deposition distorted the electric field, which in turn led to easier discharge at the interface of the oil–paper insulation and reduced the breakdown voltage of the insulation. We simulated the dynamics of carbon particles in oil to investigate their dynamic deposition.
A simplified two-dimensional model was built for the simulation by using COMSOL finite element software, to which we added an AC/DC module and a particle-tracking module. The radius of curvature of the needle electrode is 100 μm, which is represented by the radius of 100 μm spherical metals in the simulation model. The plate electrode was 2 mm high and 3 mm wide, and the distance between the high-voltage electrode and the low-voltage electrode was 6 mm. The radius of the carbon particles was 50 μm, and the carbon traces were represented by regularly arranged carbon particles after deposition. The length of the carbon traces L was the straight-line distance between the farthest side and the high-pressure side once the carbon particles had attached to the surface of the cardboard. Three cases of L = 0 mm, L = 1 mm, and L = 2 mm were considered. The resistivity of insulating oil was set to
Where: m is the mass of the carbon particles, v is the velocity of carbon particles, t is time, Fe is the electric field force on the carbon particles, Fd is the traction force on carbon particles, Fg is the combined force of gravity and buoyancy on carbon particles, and Fdeg is the dielectrophoretic force on the carbon particles.
The DC voltage used in the simulation was 25 kV. We assumed that the initial state of the carbon particles was one in which they collided with the plate electrode. The plate electrode was negatively charged after the collision, as shown in Eq. 4.2. The carbon particles were initially stationary. The calculation was stopped when they collided with the insulating paper, and we did not consider the case in which they rebounded:
Where:
The trajectories of carbon particles for L = 0 mm, L = 1 mm, and L = 2 mm are shown in Figure 12. The carbon particles moved in the direction of the electric field toward the high-voltage electrode, and the trajectories of carbon traces of different lengths were very similar. However, as their length on the surface of the insulating paper increased, the carbon particles were deposited closer to the plate electrode. To compare the motion of carbon particles under carbon traces of different lengths, we orthogonally decomposed their velocity. Figure 13 shows the velocity of the carbon particles along the x- and y-axes. As the carbon particles moved away from the region of the strong electric field of the plate electrode along the y-axis, their velocities along this axis gradually decreased. When the particles were close to the region of the strong electric field of the high-voltage electrode, their velocities gradually increased along the y-axis. The velocity of the particles along the x-axis did not change by much, and gradually decreased when they were close to the insulating paper. As the length of the carbon traces increased, the velocity of carbon particles along the x-axis decreased, and they were deposited on the surface of the insulating paper more quickly. The carbon particles were mainly subjected to the force exerted by the electric field and the trailing force due to the viscosity of the insulating oil. Changes in their speed were thus related to the field strength along the path through which the carbon particles moved, and carbon traces on the surface of the insulating paper altered the distribution of the electric field to influence the trajectory of the carbon particles. As the carbon particles were deposited closer to the plate electrode, carbon traces on the surface of the insulating paper grew along the direction of the electric field from the high-voltage electrode to the plate electrode.
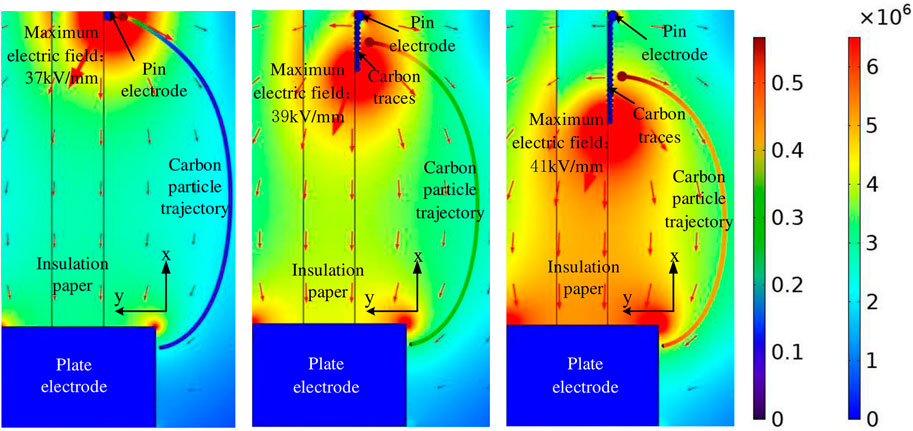
FIGURE 12. Trajectory of carbon particles at different carbon trace lengths.
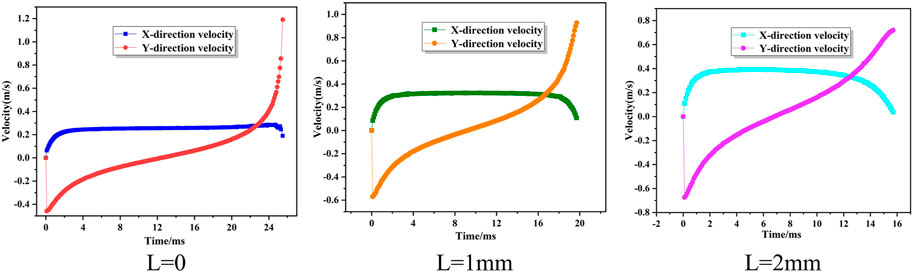
FIGURE 13. Velocity of carbon particles at different carbon trace lengths.
Figure 12 also shows that the maximum value of the electric field at the interface of the oil–paper insulation increased with the length of the carbon traces, and thus made partial discharge along the interface more likely. Moreover, the equivalent insulating distance decreased with the growth of the carbon traces, where this led to a higher probability of breakdown. Therefore, the breakdown voltage along the surface decreased linearly with the increase in the length of the carbon traces.
5 Conclusion
A large amount of carbon particles are generated in insulating oil during the manufacture and operation of converter transformers, and this leads to a degradation in the performance of the oil–paper insulation. In this study, the authors used a needle–plate electrode model to simulate creeping discharge. The law of growth of carbon traces on the surface of the insulating paper and the breakdown voltage along the surface of the oil–paper insulation under different concentrations of carbon particles were studied. The following conclusions can be drawn.
(1) We investigated the characteristics of growth of carbon traces on the cardboard surface in pure insulating oil and insulating oil containing carbon particles. The carbon traces grew along the direction of the electric field from the high-voltage electrode to the ground electrode. Carbon dendrites were produced in pure insulating oil through the carbonization of the insulating paper to form a conductive channel. By contrast, carbon traces were produced in oil containing carbon particles through the deposition of carbon particles on the surface of the insulating paper. Compared with that in pure insulating oil, the formation of a conductive channel through the poles of the paper in insulating oil containing carbon particles required a lower voltage and a shorter discharge time. When the insulation was defective, the oil–paper insulation was more likely to fail.
(2) As the concentration of carbon particles increased, the rate of growth of carbon traces on the surface of the insulating paper increased and the time-to-failure of the oil–paper insulation decreased. In the DC pre-voltage mode, a large area of carbon traces was formed on the surface of the insulating paper in case of a high concentration of carbon particles. The electric field around the interface of the oil–paper insulation was distorted and became more inhomogeneous. This led to a lower breakdown voltage along the surface of the oil–paper insulation.
Data availability statement
The original contributions presented in the study are included in the article/supplementary material, further inquiries can be directed to the corresponding author.
Author contributions
All authors listed have performed the acquisition of experimental data, compilation of experimental data, and writing the paper. All authors agree to be accountable for the content of the work.
Funding
This study is supported by the National Natural Science Foundation of China (No. 52077012).
Acknowledgments
The authors are grateful to the reviewers for their constructive comments and suggestions to improve this manuscript.
Conflict of interest
The authors declare that the research was conducted in the absence of any commercial or financial relationships that could be construed as a potential conflict of interest.
Publisher’s note
All claims expressed in this article are solely those of the authors and do not necessarily represent those of their affiliated organizations, or those of the publisher, the editors and the reviewers. Any product that may be evaluated in this article, or claim that may be made by its manufacturer, is not guaranteed or endorsed by the publisher.
References
Chen, Q., Zhang, J., Chi, M., and Guo, C. (2018). Breakdown characteristics of oil-pressboard insulation under AC-DC combined voltage and its mathematical model. Energies (Basel) 11 (5), 1319. doi:10.3390/en11051319
Cheng, Y., Li, C., and Miao, Y. (2009). “The relationship between surface partial discharge and carbon trace in oil-impregnated paper insulation,” in 2009 IEEE Conference on Electrical Insulation and Dielectric Phenomena. 18-21 October 2009, Virginia Beach, VA, USA, 96–99. doi:10.1109/CEIDP.2009.5377710
Cheng, Y., Wei, J., Zhao, C., and Song, H. (2016). “Experimental research on creepage discharge between oil-impregnated pressboard layers,” in 2016 IEEE Conference on Electrical Insulation and Dielectric Phenomena (CEIDP), Toronto, ON, Canada, 16-19 October 2016, 999–1002. doi:10.1109/CEIDP.2016.7785581
Cheng, Z. D., Cheng, L., Wang, J. H., and Wang, L. (2019). Influence of different oil-paper configurations on the electric field distribution simulation of the internal insulation of converter transformer. IOP Conf. Ser. Mater. Sci. Eng. 657 (1), 012032. doi:10.1088/1757-899X/657/1/012032
Dai, J., Wang, Z. D., and Jarman, P. (2010). Creepage discharge on insulation barriers in aged power transformers. IEEE Trans. Dielectr. Electr. Insulation 17 (4), 1327–1335. doi:10.1109/TDEI.2010.5539705
Ghoneim, S., Bedir, I., Sabiha, N., and Eladly, R. (2019). “Investigation of insulating oils in presence of impurities,” in 2019 21st International Middle East Power Systems Conference (MEPCON), Cairo, Egypt, 17-19 December 2019, 71–75. doi:10.1109/MEPCON47431.2019.9008018
Horenstein, M. N., and Melcher, J. R. (1979). Particle contamination of high voltage DC insulators below corona threshold. IEEE Trans. Electr. Insulation EI-14 (6), 297–305. doi:10.1109/TEI.1979.298185
Huang, Y., Liu, Q., and Wang, Z. (2019). “Effects of moisture and oil flow on white mark propagation on pressboard in an ester liquid,” in 2019 IEEE 20th International Conference on Dielectric Liquids (ICDL), Roma, Italy, 23-27 June 2019, 1–4. doi:10.1109/ICDL.2019.8796674
Lan, L., Zhang, G., Wang, Y., and Wen, X. (2017). Force and motion characteristics of contamination particles near the high voltage end of UHVDC insulator. Energies (Basel) 10 (7), 969. doi:10.3390/en10070969
Liu, J., Zou, J., Tian, J., and Yuan, J. (2009). Analysis of electric field, ion flow density, and corona loss of same-tower double-circuit HVDC lines using improved FEM. IEEE Trans. Power Deliv. 24 (1), 482–483. doi:10.1109/TPWRD.2008.2007009
Ma, Z., Cheng, Y., Chen, M., Wei, J., and Li, C. (2013). “Study on the influence of gases on white marks and carbonized tracks generated by partial discharge in transformer oil-paper insulation,” in 2013 IEEE International Conference on Solid Dielectrics (ICSD), 30 June 2013 - 04 July 2013, Bologna, Italy, 967–970. doi:10.1109/ICSD.2013.6619886
Mengzhao, Z., Wenbing, Z., Dan, M., Wang, X., Hao, J., and Liang, S. (2019). “Partial discharge and breakdown voltage measurement for mineral insulation oil contaminated by cellulose particles,” in 2019 IEEE Sustainable Power and Energy Conference (iSPEC), Beijing, China, 21-23 November 2019, 2518–2521. doi:10.1109/iSPEC48194.2019.8975196
Miners, K. (1982). Particles and moisture effect on dielectric strength of transformer oil using VDE electrodes. IEEE Power Eng. Rev. PER-2 (3), 36. doi:10.1109/MPER.1982.5520335
Pattanadech, N., and Muhr, M. (2016). Partial discharge inception voltage investigation of mineral oil: Effect of electrode configurations and oil conditions. IEEE Trans. Dielectr. Electr. Insulation 23 (5), 2917–2924. doi:10.1109/TDEI.2016.7736853
Saaidon, S. B., Talib, M. A., Rohani, M. N. K. H., Muhamad, N. A., and Jamil, M. K. M. (2021). Breakdown voltage of transformer oil containing cellulose particle contamination with and without bridge formation under lightning impulse stress. IEEE Access 9, 147994–148003. doi:10.1109/ACCESS.2021.3124098
Tang, J., Ma, S., Zhang, M., Liu, Z., and Li, X. (2017). Motion characteristics of a charged metal particle in insulating oil under flow state. IEEJ Trans. Electr. Electron. Eng. 12 (4), 484–490. doi:10.1002/tee.22403
Teng, C., Ding, Y., Zhang, Y., Zhang, Y., Huang, M., and Zhan, Z. (2022). Investigation on distribution of electro-thermal coupling fields influenced by HVDC bushing insulation properties. Front. Energy Res. 10, 1005470. doi:10.3389/fenrg.2022.1005470
Thirumurugan, C., Kumbhar, G. B., and Oruganti, R. (2019). Effects of impurities on surface discharges at synthetic ester/cellulose board. IEEE Trans. Dielectr. Electr. Insulation 26 (1), 64–71. doi:10.1109/TDEI.2018.007439
Vincent, C., Trinh, N. G., Olivier, R., and Aubin, J. (1994). “Behavior of an oil-paper interface in presence of carbon particle contamination,” in Proceedings of 1994 IEEE International Symposium on Electrical Insulation, 05-08 June 1994, Pittsburgh, PA, USA, 534–537. doi:10.1109/ELINSL.1994.401400
Wang, X., Wang, Z. D., and Noakhes, J. (2011). “Motion of conductive particles and the effect on AC breakdown strengths of esters,” in 2011 IEEE International Conference on Dielectric Liquids, Trondheim, Norway, 26-30 June 2011, 1–4. doi:10.1109/ICDL.2011.6015453
Yi, X., and Wang, Z. (2013). Surface tracking on pressboard in natural and synthetic transformer liquids under AC stress. IEEE Trans. Dielectr. Electr. Insulation 20 (5), 1625–1634. doi:10.1109/TDEI.2013.6633692
Zhang, J., Chen, Q., Chi, M., Yang, H., and Liu, H. (2021). Space charge and insulation properties of nano-Al2O3-modified oil-impregnated paper used for HVDC convertor transformer. J. Mater. Sci. Mater. Electron. 32 (3), 3720–3731. doi:10.1007/s10854-020-05117-5
Zhang, J., Wang, F., Li, J., Ran, H., and Huang, D. (2017). Influence of copper particles on breakdown voltage and frequency-dependent dielectric property of vegetable insulating oil. Energies (Basel) 10 (7), 938. doi:10.3390/en10070938
Keywords: carbon particles, oil-paper insulation, creeping discharge, carbon mark growth model, breakdown voltage
Citation: Zhang Z, Pan X, Dong Z, Zhong J and Wang X (2023) Investigating the growth of carbon traces in cardboard in oil-paper insulation. Front. Energy Res. 11:1150322. doi: 10.3389/fenrg.2023.1150322
Received: 24 January 2023; Accepted: 07 March 2023;
Published: 15 March 2023.
Edited by:
Wenliang Zhao, Shandong University, ChinaReviewed by:
Dianhai Zhang, Shenyang University of Technology, ChinaYi Zhao, Hefei University of Technology, China
Copyright © 2023 Zhang, Pan, Dong, Zhong and Wang. This is an open-access article distributed under the terms of the Creative Commons Attribution License (CC BY). The use, distribution or reproduction in other forums is permitted, provided the original author(s) and the copyright owner(s) are credited and that the original publication in this journal is cited, in accordance with accepted academic practice. No use, distribution or reproduction is permitted which does not comply with these terms.
*Correspondence: Zhanlong Zhang, emhhbmd6bEBjcXUuZWR1LmNu