 Heling Dong
 Zhong Tang
95% of researchers rate our articles as excellent or good
Learn more about the work of our research integrity team to safeguard the quality of each article we publish.
Find out more
ORIGINAL RESEARCH article
Front. Energy Res. , 23 February 2023
Sec. Process and Energy Systems Engineering
Volume 11 - 2023 | https://doi.org/10.3389/fenrg.2023.1148734
This article is part of the Research Topic Planning and Operation of Hybrid Renewable Energy Systems, Volume II View all 12 articles
Power electronic transformers (PET) are a new type of power electronic equipment with a multi-port flexible dispatch function, which can play the role of a power hub in a system composed of multiple AC-DC hybrid distribution grids for interactive sharing of power in multiple regions. In this study, a two-stage robust optimization operation model of a hybrid AC-DC distribution network with PET is proposed based on PET power transmission and transformation characteristics. The stochastic uncertainty of the distributed renewable energy output in the AC-DC grid is handled by a two-stage robust optimization method to determine the minimum total system operation cost under the worst case of distributed renewable energy output. Finally, a constrained column generation algorithm is used to solve the two-stage robust optimization model in the min-max-min form and verifies the validity of the model in this study.
With the development of power technology, new energy sources represented by wind and photoelectricity are increasingly connected to power systems and generally belong to distributed generation (DG). The DC part of the AC/DC mixed current distribution is compatible with these DGs, and DC transmission can reduce the number of energy conversions and improve energy utilization, while the AC part is compatible with existing power equipment, saving costs. The AC-DC hybrid distribution grid also has advantages in terms of new energy consumption, peak shaving, and valley filling, and is a feasible solution to cope with future grid development.
A power electronic transformer (PET) consists of a power electronic converter and conventional high-frequency transformer, which allows for more flexible conversion of electrical energy through power electronics technology (Liu et al., 2017; Wang et al., 2017). Generally, power electronic transformers are classified into AC/AC- and AC/DC/AC-type PETs, depending on whether they contain a DC component (Li et al., 2018). PET plays the same role as a traditional voltage source converter (VSC) in an AC/DC distribution network, connecting the AC and DC components of the interactive distribution network. Compared with traditional VSC, PET has some unique advantages, such as its ability to contain multiple AC-DC converter ports, connect multiple AC and DC subgrids simultaneously, control the power and voltage of each port, and achieve power quality control, fault isolation, and energy interaction between ports simultaneously. Therefore, PET can play the role of an energy hub in the AC-DC hybrid distribution network.
Pu et al. (2018) provided an overview of the technology and framework for the optimal operation of PET-based hybrid AC-DC systems, and illustrated the advantages of PET-based AC-DC distribution networks over other power conversion units, such as VSC-based AC-DC distribution networks. Yi and Wang, 2021 proposed a day-ahead economic operation strategy for multi-port PET-based AC-DC distribution networks, reflecting the flexible regulation capability of PET, and established a PET energy flow model. Guo et al. (2019) applied multi-port PET to AC-DC hybrid distributed energy systems, fully consuming renewable energy and reducing system operation cost by using the power regulation function of PET. However, most of the above models do not fully consider the uncertainty of the renewable energy power output, whose random uncertainty significantly affects the power interaction of PET and safe operation of the AC-DC distribution network with access to large-scale scenic power sources.
Owing to the access of a large number of distributed renewable energy sources such as photovoltaic (PV) and wind power, the power supply of the grid has more uncertainty and volatility, posing new challenges for optimal dispatching of the distribution network. The commonly used uncertainty optimization methods include stochastic and robust optimization.
The probability distribution of random variables must be set in stochastic optimization, but the assumed probability distribution model may not be able to accurately portray the variation pattern of the actual uncertainty factors when they are more complex. Zhang et al. (2022) proposed a stochastic optimization model for the impact of new energy uncertainty on the operation results of AC-DC distribution networks containing power electronic transformers. Xu et al. (2021) combined stochastic optimization and conditional value-at-risk theory to propose a stochastic operation optimization method for active distribution networks containing smart soft switches considering risk management. Robust optimization does not require prior knowledge of the specific probabilistic prediction information of uncertain quantities and uses uncertainty sets to model uncertainty and pursue the minimum total cost of system decision options under the worst-case scenario with uncertain variables. Liu et al. (2018) considered the uncertainty of new energy and load, developed a min-max-min two-stage robust optimization model, and regulated the model conservativeness by introducing uncertainty regulation parameters. Fu et al. (2019) proposed a reactive voltage control method for AC-DC distribution networks based on a two-stage robust optimization model and examined the results of the model under different prediction errors. Liao et al., 2020 proposed a two-stage robust optimization strategy for an AC-DC distribution network with an optical storage consortium and used a hierarchical approach to set two objectives to solve it. Zhang et al. (2022) proposed a two-stage robust optimization model incorporating both distribution network reconfiguration and reactive power optimization. Zhong et al. (2022) introduced game theory into the two-stage robust optimization model for AC-DC distribution networks and constructed a master-slave game optimization model. However, few of the above models apply the two-stage robust optimization method to the optimal operation of hybrid AC-DC distribution networks with PET, and further research is required to combine the robust modeling idea with the optimal operation of AC-DC distribution networks with PET.
In this study, a two-stage robust optimal operation model of a hybrid AC-DC distribution network with PET is proposed. By connecting the AC-DC part of the distribution network and the super grid through PET, the utilization rate of distributed renewable energy is improved, and the safe and economic operation of the AC-DC distribution network is ensured. A two-stage robust optimization method is used to address the stochastic uncertainty of the renewable energy output and seek the minimum total system operation cost under the worst case scenario. Finally, a constrained column generation algorithm is used to solve the two-stage optimization model in the form of min-max-min.
Compared with the examples mentioned in the previous section, the two-stage robust optimization method used in this paper has the following advantages: first, compared with the traditional robust optimization method and the stochastic optimization method, the method used in this paper inherits the advantages of robust optimization such as strong accuracy and low out-of-bounds rate, and achieves the purpose of controlling the conservativeness of the model by adding uncertainty adjustment parameters. Secondly, compared with other two-stage robust optimization methods, the method used in this paper sets both spatial and temporal uncertainty adjustment parameters, which can control the number of bad scenarios taken in one cycle and the number of bad scenarios taken at the same time respectively, so that the conservativeness of the model can be controlled more flexibly and accurately to achieve better optimization results.
The hybrid AC-DC distribution network can be divided into three parts according to its composition: AC and DC distribution networks and VSC. The model in this paper used PET to replace the traditional VSC, which connects the DC, AC, and super grids and plays the role of power conversion. In the AC part, the micro turbine (MT), AC load, and energy storage (ES) are connected, and in the DC part, the PV, wind turbine (WT), DC load, and other parts are connected. The AC and DC parts are connected to the superior grid through PET. Figure 1 shows a schematic of the AC-DC hybrid distribution network. Compared with the traditional AC-DC distribution network, that with PET can directly interact with the superior grid through PET, owing to the multi-port nature of PET, avoiding the loss caused by the interaction through the AC grid. Because the power can be freely interacted with in three ports, it improves the flexibility of power dispatching in the distribution network. Compared with traditional VSC, it improves the response speed and network flexibility and reduces the power conversion link, which is more suitable for distribution networks with uncertain DG (Pu et al., 2018; Li et al., 2021).
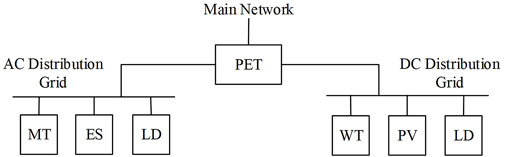
FIGURE 1. Schematic diagram of AC/DC distribution network with PET.
The optimization objective was to minimize the total operating cost during the dispatch cycle of the system. This entailed finding the operating solution with the lowest cost during the dispatch cycle by adjusting the purchased power from the higher grid, generation capacity of the micro turbine, and power of the energy storage equipment.
Among them,
where
The DistFlow tidal model was planned to be used for both the AC and DC parts of this model because part of this model contained non-linear terms that were not favorable for solving the model using software. To improve the solution speed, in this study, linearization and second-order cone relaxation were used to transform the model into a linear problem (Lavaei and Low, 2012), which was then solved by a commercial solver to achieve an easy solution and increase the solution speed as follows:
First, linearization transformation was performed through variable substitution:
The results of the second-order cone relaxation of the DistFlow power flow model of the AC/DC hybrid distribution network were as follows.
AC part:
where
DC part:
where
(1) Upper and lower limit constraints of micro turbine output:
where
(2) Wind turbine and photovoltaic output constraints:
where
(3) Operational constraints of energy storage:
where
In this study, we considered an AC/DC/AC-type PET with a DC section, which can be connected to multiple AC/DC distribution networks simultaneously because of its multi-port feature, and realize the power interaction function between each sub-network and the higher-level network through its AC/DC ports. Considering the limitations of PET, the amount of power interaction between each port was constrained.
Figure 2 shows a schematic diagram of the energy flow of the PET, where
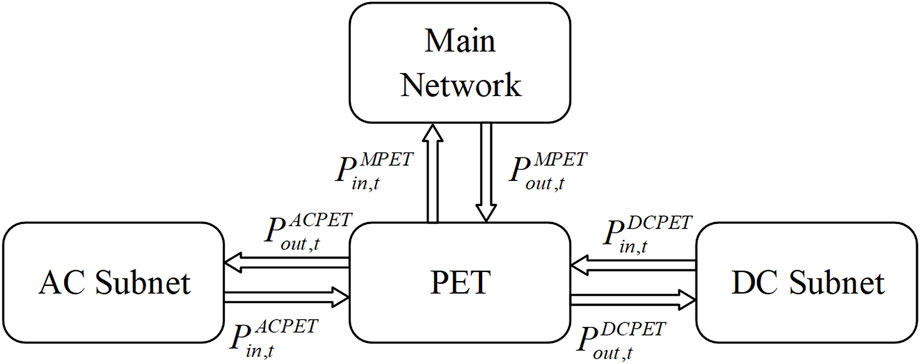
FIGURE 2. Schematic diagram of PET energy flow.
Letting the loss factor of PET be
The capacity constraints of PET ports are:
Linearizing the non-linear term in the constraint so that it is transformed into a rotating cone constraint yields:
where
Owing to the stochastic uncertainty of wind power and PV output, we considered the uncertainty set to characterize the uncertainty of the scenery output:
where
To regulate the uncertainty of the model to control the conservativeness of the model, the time regulation parameters
where
As mentioned above, the optimization objective of the proposed model in this study was to minimize the cost of running one cycle, and the objective function can be expressed in the form of Eq. 1. Without considering the uncertainty of the PV of the wind turbine, the compact form of the objective function can be expressed as:
where c is the column vector of coefficients corresponding to the objective function; D, K, F, G,
Where x and y are optimization variables, and their expressions are:
When the uncertain output of wind and light is considered, a two-stage robust optimization approach can be used to find the scenario with the lowest cost of operating one cycle when the uncertain value of the scenery output is taken to the worst operating scenario with a preset uncertainty concentration, which is mathematically represented as follows:
where the outer layer is the first stage of the minimization problem with x as the optimization variable, and the inner layer is the second stage of the maximum minimization problem with u and y as the optimization variables. The first layer of the minimization problem was the objective function of this study, that is, the cost of running a cycle was minimized, and
where α, β, γ, δ, λ, and μ are pairwise vectors corresponding to each constraint matrix.
To facilitate the solution, the above optimization model must be transformed into the form of a standard two-stage robust optimization model, which is a min-max-min multilayer optimization problem and is difficult to solve using general methods. In order to solve such problems, the commonly used methods are Benders decomposition method and Column and constraint generation (CCG) algorithm, and the CCG algorithm has the unique advantages of shorter computation time and fewer iterations compared with the Benders decomposition method, so the CCG algorithm is used to solve the two-stage robust optimization problem in this paper (Zeng and Zhao, 2013). The optimization problem was decomposed into a master problem and subproblem; the master problem min provided a lower bound for the subproblem max-min by calculation, whereas the subproblem provided a worst-case environment in the uncertainty set to provide an upper bound for the model, and then iterated the model several times so that the difference between the upper and lower bounds only decreased gradually. Finally, the result reached the preset convergence condition to obtain the desired optimization result. The specific process is as follows:
The main problem provides the lower bound for the model as:
where k is the number of current iterations, l is the number of historical iterations,
The objective of the sub-problem was to derive the worst-case scenario with an objective function expressed as follows:
With (x,u) given, the subproblem can be viewed as a deterministic problem, and the equations of the subproblem are transformed into a dual form by the method mentioned above, thus transforming the min problem into a max problem for an easy solution, and the expression obtained is
The results obtained from the subproblem provide the upper bound for the whole model. The specific iteration process is shown in Figure 3.
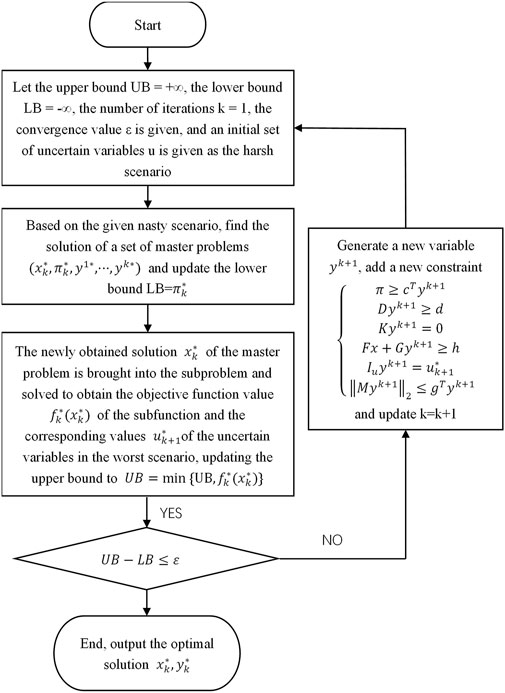
FIGURE 3. Algorithm flow chart.
To verify the correctness and effectiveness of this two-stage robust optimization method for hybrid AC-DC distribution networks with PET proposed in this study, the YALMIP toolbox and CPLEX and Gurobi solvers were used to solve the model. The hardware platform used was AMD Ryzen 7 4800 H 2.90 GHz; 16 GB RAM. The operating system used was Windows 10, and the software was R2017b. The structure of the algorithm used in this study is shown in Figure 4.
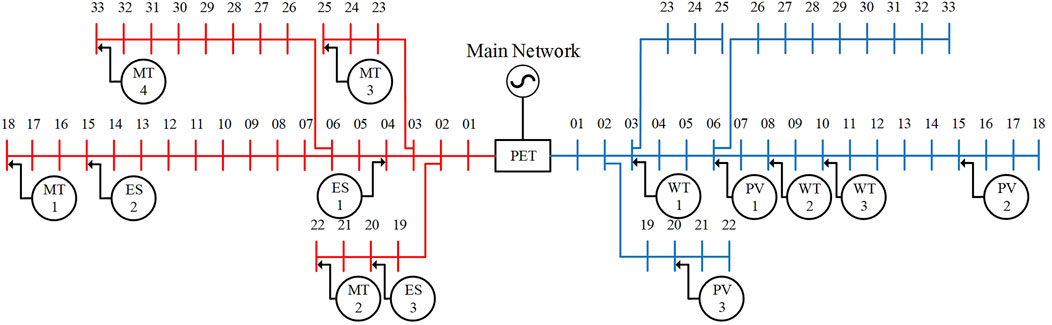
FIGURE 4. Structure diagram of AC/DC distribution network with PET.
As shown in Figure 4, this study adopted a hybrid AC-DC distribution network model combined with two improved IEEE33 node models, where the red line indicates the AC part of the distribution network, and blue indicates the DC part. The PET connects the AC-DC part as well as the main network, and even plays the role of an energy hub. The voltage of the AC part was 12.66 kV and that of the DC part was 15 kV. The limitation range of the node voltage in the distribution network was

TABLE 1. Output constraint of wind turbine.

TABLE 2. Output constraint of photovoltaic.
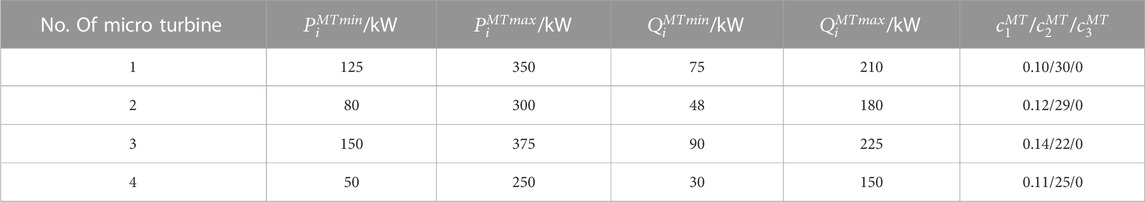
TABLE 3. Parameters of micro turbine.
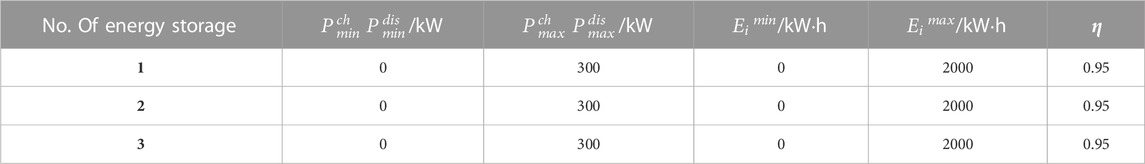
TABLE 4. Energy storage parameters.
This example sets the spatial and temporal uncertainty regulation parameters
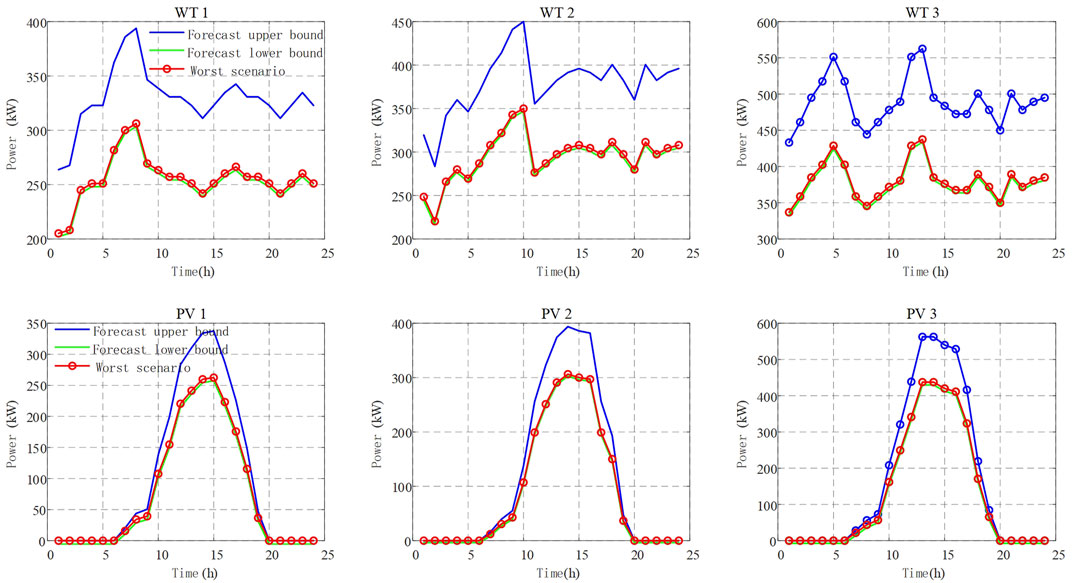
FIGURE 5. Output prediction curve of wind turbine and photovoltaic.
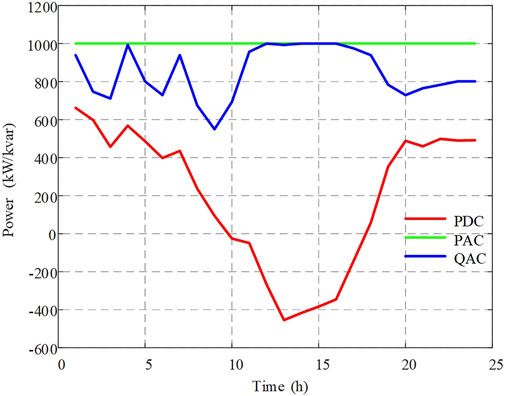
FIGURE 6. AC/DC port power of PET.
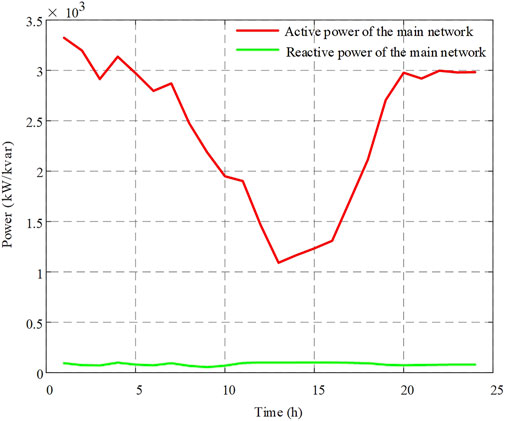
FIGURE 7. Purchased power to the main grid.
Comparing Figure 5 and Figure 8, the turbine generation was higher during the 5–10-h period, reducing the micro turbine generation at this time, thus reducing the system generation cost. Additionally, the dissipation of excess wind power reduced the cost of the wind abandonment penalty. Figure 9 shows the energy storage power curves. When the overall new energy generation of the system was too large, energy could be stored to convert the power to the AC subnetwork through PET and store the excess energy in the storage device to reduce the cost of wind and light abandonment. In addition, when the overall system power was insufficient, it could also be discharged through energy storage to reduce power purchase and generation. When the system as a whole was short of power or when the cost of purchasing power from the higher grid was lower than the cost of generating power, power could be purchased from the higher grid through the PET interaction port with the higher grid to meet the system’s power demand.
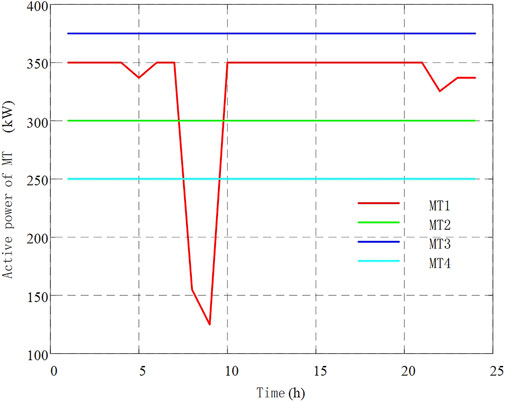
FIGURE 8. Power curve of micro turbine.
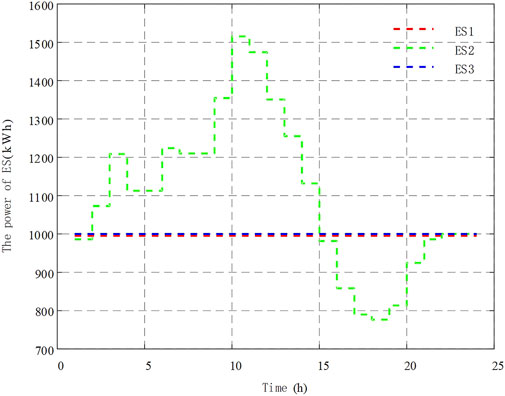
FIGURE 9. Energy storage curve.
Figure 10 shows the voltage curve of the DC part of this model. Due the limitation of the number of graphs, we did not depict the nodal voltage curve of AC part as the AC part is similar to the DC part.
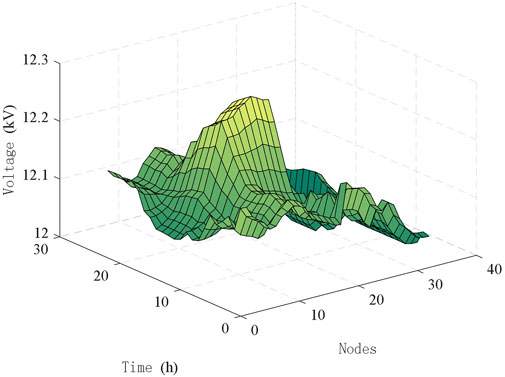
FIGURE 10. Voltage curve of DC section.
The deterministic and stochastic optimization models were compared with the two-stage optimization model proposed in this study. By comparing the cost of operating the distribution network for one cycle under these conditions, the superiority of the models was verified. Furthermore, the impact of the uncertainty parameters on the conservative model was analyzed by comparing the cost of the models under different uncertainty parameters and number of iterations. The model used in this study can be set with different uncertainty adjustment parameters for different DGs; however, for the convenience of presentation, the uncertainty adjustment parameters were the same for each DG in this study.
To verify the control effect of the uncertainty regulation parameter on the conservative type of model, several comparison tests were experimentally designed, as shown in Table 5, showing that the uncertain model was equivalent to the deterministic model when the uncertainty parameter was equal to 0. As the spatial and temporal uncertainty regulation parameters of the system increased, the number of units obtaining the worst case simultaneously and the total number of units that obtained the worst case in one operation cycle also increased. The uncertainty of the system also increased, increasing the cost of the model in one operation cycle, but the computation time and number of iterations decreased. This indicates that the more uncertainty the model considered, the worse the simulated operating conditions were, and the more conservative and costly the model was. Although the deterministic model had the lowest operating cost, it was not robust and, thus, could not cope with the uncertainty of new energy sources. The two-stage robust optimization model used in this study had a higher cost compared with the deterministic model, but it was robust because it considered the uncertainty of new energy. The larger the uncertainty parameter was, the more robust the model was, and the more it could cope with the uncertainty.
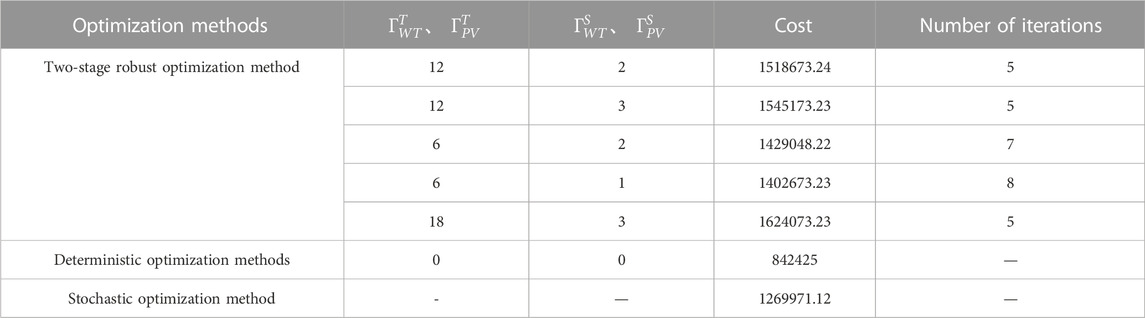
TABLE 5. Influence of uncertain parameters on results.
Compared with the stochastic optimization model commonly used in the literature mentioned previously, the cost of running one cycle of the stochastic optimization model was between that of the two-stage robust optimization and deterministic models. However, because the stochastic optimization model requires too many scenarios to be considered in the calculation, the calculation speed of the algorithm is slower, making its calculation time longer than that of the model used in this study. Additionally, the stochastic optimization model cannot guarantee the conservativeness of the calculation results, and the results have a certain probability of crossing the limit, which is not conducive to the safe power supply of the distribution network. The model used in this study can control the parameters of time and space uncertainty adjustment according to the actual situation to control the number of DGs of bad scenes in one cycle simultaneously, thus controlling the cost of running the model for one cycle. Therefore, the model used in this study is considered to have higher controllability and robustness when dealing with the actual problem.
The spatial uncertainty regulation parameter
This study established an optimal operation model of hybrid AC-DC distribution network with PET based on a two-stage robust optimization method, which considered the uncertainty of scenic power generation by using two-stage robust optimization. Based on ensuring the safety and reliability of the distribution network, the AC-DC part of the distribution network and super grid are connected by PET to improve the utilization rate of new energy and ensure the safe and economic operation of the distribution network. A comparison of the proposed model with deterministic and stochastic optimization models indicates that the model is more robust and can regulate the uncertainty of the system through the uncertainty parameters. However, the method used in this paper has the disadvantage of high cost, the next step will be to consider how to model the uncertainty of renewable energy output in an AC-DC distribution network containing PET using a data-driven approach with a large amount of historical renewable energy data.
The raw data supporting the conclusion of this article will be made available by the authors, without undue reservation.
The HD wrote the original draft. MW and ZT provided the supervision, review, and editing of the draft. All authors contributed to the article and approved the submitted version.
National Natural Science Foundation of China (61872230).
We would like to thank Editage (www.editage.cn) for English language editing.
The authors declare that the research was conducted in the absence of any commercial or financial relationships that could be construed as a potential conflict of interest.
All claims expressed in this article are solely those of the authors and do not necessarily represent those of their affiliated organizations, or those of the publisher, the editors and the reviewers. Any product that may be evaluated in this article, or claim that may be made by its manufacturer, is not guaranteed or endorsed by the publisher.
Fu, Y., Zhang, Z. Q., and Li, Z. K. (2019). Research on reactive power voltage control strategy for hybrid AC/DC distribution network based on two-stage robust optimization model [J]. Proc. CSEE 39 (16), 4764–4774+4978. doi:10.13334/j.0258-8013.pcsee.180940
Guo, S. Q., Mu, Y. F., Chen, N. S., Pu, T. J., Yuan, X. D., and Li, Q. (2019). Day-ahead optimal scheduling of AC/DC hybrid distributed energy system with power electronic transformer [J]. Adv. Technol. Electr. Eng. Energy 38 (02), 44–51. doi:10.12067/ATEEE1806018
Kashem, M. A., Ganapathy, V., Jasmon, G. B., and Buhari, M. I. (2000). “A novel method for loss minimization in distribution networks. Electric Utility Deregulation and Restructuring and Power Technologies,” in Proceedings. DRPT 2000. International Conference on. IEEE Xplore.
Lavaei, J., and Low, S. H. (2012). Zero duality gap in optimal power flow problem. IEEE Trans. Power Syst. A Publ. Power Eng. Soc. 27 (1), 92–107. doi:10.1109/TPWRS.2011.2160974
Li, K., Zhao, Z. M., Yuan, L. Q., Gao, C. Y., Wen, W. S., and You, X. J. (2021). Overview on research of multi-port power electronic transformer oriented for AC/DC hybrid distribution grid [J]. High. Volt. Eng. 47 (04), 1233–1250. doi:10.13336/j.1003-6520.hve.20201250
Li, S. C., Ling, Y. S., Pang, T. Y., and Zhang, H. Y. (2018). Research on power electronic transformer based on AC/DC and DC/AC two level structure [J]. Electr. Energy Manag. Technol. 543 (06), 7–10. doi:10.16628/j.cnki.2095-8188.2018.06.002,No.
Li, X. Y., Hu, Y., Zhu, B. T., and Geng, Q. (2019). Optimal configuration of hybrid AC/DC distribution network with power electronic transformer based on genetic algorithm. J. Water Resour. Power 37 (09), 192–196.
Liao, H. T., Huang, Y. H., Shi, Y. Z., and Chen, J. (2020). A Bi-level two-stage robust optimal operation strategy for AC and DC distribution network with photovoltaic and energy storage [J]. Electr. Power Constr. 41 (03), 110–118.
Liu, C., and Zhi, K. L. (2017). Hybrid cascaded power electronics transformer topology and control scheme [J]. Power Syst. Technol. 41 (02), 596–603. doi:10.13335/j.1000-3673.pst.2016.0942
Liu, Y. X., Guo, L., and Wang, C. S. (2018). Economic dispatch of microgrid based on two stage robust optimization [J]. Proc. CSEE 38 (14), 4013–4022+4307. doi:10.13334/j.0258-8013.pcsee.170500
Pu, T., J., Li, Y., Chen, N. S., Sun, Y. Y., Mu, Y. F., Dong, L., et al. (2018). Key technology and research framework for optimal operation control of hybrid AC/DC system based on power electronic transformer. J. Power Syst. Technol. 42 (09), 2752–2759. doi:10.13335/j.1000-3673.pst.2018.0730
Wang, Y., Zheng, Z. D., and Li, Y. D. (2017). Review of topology and control application of medium and high voltage power electronic transformer [J]. Adv. Technol. Electr. Eng. Energy 36 (05), 1–10.
Xu, C. B., Yang, X. D., Zhang, Y. B., Zhang, K. Y., Wang, X. Z., and Tang, M. (2021). Stochastic operation optimization method for active distribution networks with soft open point considering risk management and control [J]. Automation Electr. Power Syst. 45 (11), 68–76. doi:10.7500/AEPS20200331004
Yi, W. F., and Wang, X. (2021). Research on power electronic transformer based day-ahead economic operation strategy of AC/DC hybrid distribution network [J]. Mod. Electr. Power 38 (03), 339–345. doi:10.19725/j.cnki.1007-2322.2020.0393
Zeng, B., and Zhao, L. (2013). Solving two-stage robust optimization problems using a column-and-constraint generation method. Operations Res. Lett. 41 (5), 457–461. doi:10.1016/j.orl.2013.05.003
Zhang, T., Mu, Y. F., Jia, H. J., Wang, Y. X., and Pu, T. J. (2022). Stochastic operation optimization for AC/DC distribution network with power electronic transformer. J. Power Syst. Technol. 46 (03), 860–869. doi:10.13335/j.1000-3673.pst.2021.0536
Zhang, X. L., Zhou, H., Xiao, Z. H., Zhang, W., and Wu, D. (2017). Power electronic transformer applied to optimization of reactive power in active distribution system [J]. Power Syst. Prot. Control 45 (04), 80–85. doi:10.7667/PSPC160321
Zhang, X., Yao, L., Chen, C., Fang, R. S., and Lin, J. K. (2022). A novel two-stage robust model for Co-optimization of reconfiguration and reactive power in AC/DC hybrid distribution network [J]. Power Syst. Technol. 46 (03), 1149–1162. doi:10.13335/j.1000-3673.pst.2020.1870
Keywords: optimal dispatching, power electronic transformer, AC/DC distribution network, two-stage robust optimization, renewable energy, distributed generation
Citation: Dong H, Tang Z and Wei M (2023) Two-stage robust optimal operation of AC/DC distribution networks with power electronic transformers. Front. Energy Res. 11:1148734. doi: 10.3389/fenrg.2023.1148734
Received: 20 January 2023; Accepted: 15 February 2023;
Published: 23 February 2023.
Edited by:
Sayed Abulanwar, Mansoura University, EgyptReviewed by:
Abdelhady Ghanem, Mansoura University, EgyptCopyright © 2023 Dong, Tang and Wei. This is an open-access article distributed under the terms of the Creative Commons Attribution License (CC BY). The use, distribution or reproduction in other forums is permitted, provided the original author(s) and the copyright owner(s) are credited and that the original publication in this journal is cited, in accordance with accepted academic practice. No use, distribution or reproduction is permitted which does not comply with these terms.
*Correspondence: Heling Dong, NDM1NzA5NTc2QHFxLmNvbQ==
Disclaimer: All claims expressed in this article are solely those of the authors and do not necessarily represent those of their affiliated organizations, or those of the publisher, the editors and the reviewers. Any product that may be evaluated in this article or claim that may be made by its manufacturer is not guaranteed or endorsed by the publisher.
Research integrity at Frontiers
Learn more about the work of our research integrity team to safeguard the quality of each article we publish.