 Jingyuan Wu
 Kai Yang1,2
 Hua Wang
 Qingtai Xiao
94% of researchers rate our articles as excellent or good
Learn more about the work of our research integrity team to safeguard the quality of each article we publish.
Find out more
ORIGINAL RESEARCH article
Front. Energy Res. , 08 June 2023
Sec. Process and Energy Systems Engineering
Volume 11 - 2023 | https://doi.org/10.3389/fenrg.2023.1147701
Solid–liquid mixing has been a common industrial process operation. The measurement of solid–liquid mixing quality can help improve the efficiency of related industrial processes, but there is still a lack of an intuitive, accurate, and simple measurement method. As an important indicator to evaluate the solid–liquid mixing quality, the degree of solid suspension and the uniformity of solid distribution are directly related to mass transfer and reaction efficiency. Therefore, it is necessary to study the solid suspension and distribution in a solid–liquid system. In this work, the solid suspension and distribution of a solid–liquid system composed of glass beads–water stirred by the impeller are studied experimentally via digital image processing combined with statistical analysis. Specifically, images of solid–liquid mixing are first obtained using a camera and digitally processed. The area ratio of the solid in the image is proposed to reflect the degree of solid suspension, and the modified L2-star discrepancy (MD) is then used to quantify the uniformity of the solid distribution. Then, the solid–liquid mixing quality can be characterized by combining the area ratio and solid distribution. The feasibility of this method was proved by qualitative analysis of the solid–liquid mixing state and comparison with known studies. In addition, the effects of various stirring factors on the solid distribution were studied and discussed by using the proposed method. The results show that the method proposed in this paper can measure the quality of the solid–liquid mixing state more directly and is effective and accurate. Furthermore, it was used to find the best experimental parameters in this work. This method is also simpler and cheaper than many other methods. It is of great significance to improve the efficiency of chemical and metallurgical and other industrial processes.
Mixing is one of the most common operations in process engineering that is used to combine materials and promote heat and mass transfer (Blower et al., 2020; Wang et al., 2023; Yang et al., 2023b). Solid–liquid mixing is one of the operations that are general and extensive (Delacroix et al., 2021) and commonly seen in chemical and metallurgical industries. In addition, its efficiency depends on the quality of solid phase suspension and the degree of solid–liquid two-phase contact (Delacroix et al., 2021), so the measurement of solid–liquid two-phase mixing quality is very important in the whole operation process. The mixing quality is generally judged by visual observation of solid particles suspended at the bottom, which is the oldest and most commonly used method (Gu et al., 2019). However, its subjective dependence is strong, which is easy to cause large errors and lacks more rigorous criteria. Therefore, more specific standards and accurate methods are needed for measurement.
For solid–liquid mixing, it is very important to provide enough stirring energy to make the solid phase fully suspended in the liquid phase (Teoman et al., 2021). Hence, it is necessary to achieve uniform and effective solid–liquid phase contact (Harrison et al., 2012). At the same time, the uniformity of solid phase distribution will also affect its contact time with the liquid phase and even mixing efficiency (Harrison et al., 2020). Therefore, there are generally two criteria for evaluating the quality of the solid–liquid mixing state: one is “just suspended” and the other is “uniform distribution” (Grenville et al., 2015). In research, the “just suspension speed”
Non-invasive methods do not require deep sampling or installation of equipment inside the mixture. For example, laser Doppler velocimetry (LDV) can be used to obtain the mean velocity and root mean square velocity of solid particles in solid–liquid mixing based on the Doppler effect (Nouri and Whitelaw, 1992). Compared with invasive methods, using non-invasive methods avoids the damage to the fluid movement caused by solid particles entering the mixture and is more convenient to operate. Therefore, non-invasive measurement methods are widely used in the field of solid–liquid mixing. The radioactive particle tracking (RPT) method is also a common research method in the field of solid–liquid mixing. Guha et al. (2007) used computer-automated radioactive particle tracking (CARPT) to study the solid flow field in dense solid–liquid suspensions. Jafari et al. (2012b) used the gamma-ray densitometry technique for characterizing Njs. Salierno et al. (2022) also used RPT to study the effect of stirring speed on solid motion in a three-phase stirred reactor. In addition, acoustic methods were also used. Ren et al. (2008) determined the just suspension speed of solids by collecting acoustic emission (AE) signals for multi-scale analysis based on the mechanism of AE signals of different frequencies emitted when solid particles hit the wall. Rossi et al. (2022) developed a sensing method that combined passive acoustic emission (PAE) and supervised machine learning (ML). Acoustic emission data were acquired and processed by piezoelectric acoustic sensors on the outer wall of the vessel to identify solid–liquid suspension states. Liu and Barigou (2015) and Cole et al. (2022) used the positron emission particle tracking (PEPT) method to measure the suspension of glass beads in sodium chloride solution in the lower pump impeller agitator and the solid fluid dynamics in the baffle vessel stirred by the Rushton turbine, respectively. However, PEPT equipment is expensive, and the data processing is complicated. Electrical resistant tomography (ERT) is also a non-invasive measurement technique commonly used in the field of solid–liquid mixing. For example, Yang et al. (2012) used ERT to obtain concentration data during agitation and studied the particle suspension performance of the proposed eccentric shaft agitation and two-half angular blade agitator. Mishra and Ein-Mozaffari (2016) used ERT to obtain solid–liquid mixing plane signals, reconstruct chromatographic images, evaluate the distribution of solid particles, and study the mixing performance of the Maxblend impeller in solid–liquid mixing (Mishra and Ein-Mozaffari, 2016). Kazemzadeh et al. (2019) and Kazemzadeh et al. (2020) used ERT to study the large particle slurry with high solid phase load, measured the plane conductivity data to determine its solid phase volume fraction, and finally calculated the suspension uniformity. For many non-invasive technologies, the measurement effect of solid–liquid mixing quality is often better and the scope of application is broader, but the relevant equipment is generally more expensive, various requirements are higher, and the operation is also complex. As for RPT, there are radiation safety problems. In addition, most of the current non-invasive methods measure some parameters that do not directly show the mixing uniformity during the solid–liquid mixing process. For example, the velocity of solid particles is directly obtained by RPT, and the conductivity of mixtures is directly obtained by ERT. Afterward, the characterization of solid–liquid mixing quality is obtained through the transformation of the relation between parameters. The summary of some solid–liquid mixing measurement techniques is shown in Table 1, and most of them measure some indirect parameters and then extrapolate to get some characteristic quantity of solid–liquid mixing quality. Therefore, in the field of solid–liquid mixing, more simple and effective methods for measuring the mixing quality are still needed. Moreover, the desired method should be able to more intuitively characterize the solid–liquid mixing quality.

TABLE 1. Summary of some solid–liquid mixing measurement techniques.
Optical image analysis is a simple and low-cost technology (Blower et al., 2020; Yang et al., 2023a; Yang et al., 2023c) that can visualize the motion and mixing of objects. Pacek et al. (1994) proposed a method of image acquisition and measurement of droplets in the immiscible liquid dispersible phase by using a stereo microscope connected with a camera, which laid a foundation for the application of the optical image method in polyphase mixing. Direct mixing state information is recorded in the mixing image. Of course, it is difficult to grasp the information effectively, accurately, and comprehensively by direct observation of the image, so the image needs to be processed digitally. Digital processing of images obtained by optical photography can improve the recognition of images and obtain specific information. In the field of solid–liquid mixing, digital image analysis can more effectively grasp the information of the whole field and more accurately help know the state of polyphase mixing. Wang et al. (2008) used a high-speed motion analyzer equipped with a high-speed camera to record images and videos of the motion of solid particles in the hydrocyclone and plot their motion trajectories for research. Xu et al. (2019) recorded the mixed images of glass microbeads and malt syrup solution using a camera and obtained the cloud height of solid phase distribution through the RGB brightness method analysis according to the brightness difference in the clarified liquid phase and solid-rich liquid phase region. Khan et al. (2020) conducted high-speed image analysis of tracer particles in the solid–liquid fluidized bed system and determined their dispersion coefficient in the system by measuring their mean free path and velocity components in three directions. Teoman et al. (2021) took pictures of the bottom of the solid–liquid mixing vessel, analyzed the relationship between the solid phase area in each image and the corresponding stirring speed, and obtained the corresponding just suspension speed of the solid.
The purpose of this paper is to develop a method to measure the quality of solid–liquid mixing by means of image analysis, which can reflect the state of solid–liquid mixing more directly and effectively, with simple operation and low cost. In this work, mechanical agitation is used to carry out solid–liquid mixing, and optical images of the mixing state are obtained for processing and analysis. It is difficult to realize solid suspension completely off the bottom in the solid–liquid mixture due to various restrictions in the actual operation. Therefore, this paper no longer studies the critical rotational speed of solid suspension off the bottom to explore the “critical suspension,” but reflects the degree of suspension by studying the amount of solid suspension at a certain position, and studies the quantification of solid distribution in solid–liquid mixing to characterize the “uniform distribution.” In order to effectively and accurately quantify the uniformity of solid distribution, this paper introduces discrepancy for calculation and analysis because discrepancy can be used to measure the uniformity as a geometric concept. In this paper, the modified L2-star discrepancy (MD) is used as a metric. The more evenly the points are distributed over the region, the smaller the value of the star discrepancy. Here, the image of the local solid–liquid mixing region is selected, the star deviation of its solid phase distribution is calculated by processing, and its uniformity is quantified so as to characterize its overall mixing quality. This method can be used to measure the solid–liquid mixing quality not only intuitively and accurately but also in a simple and fast manner.
The remainder of this paper is organized as follows: in Section 2, the solid–liquid mixing experiment and method are described. In Section 3, the mixing quality of solid–liquid in the stirred tank is explained. In Section 4, the conclusion is drawn finally.
The schematic diagram of the device for solid–liquid mixing image processing and mixing quality measurement is shown in Figure 1. The plexiglass tank is used as the stirring vessel, and the motor, frequency converter, and stirring impeller are fixed on the iron frame for stirring. The solid–liquid mixing image is obtained using the camera. The inner plexiglass stirred tank is round, with an outer diameter of 30 cm, a wall thickness of 0.5 cm, and a height of 31 cm, so the inner diameter D = 29 cm. The outer tank is square, with a side length of 32 cm, a wall thickness of 1 cm, and a height of 31 cm. Both tanks are flat-bottomed. Adding water to the outer tank can reduce the influence of refraction when observing the mixing of the inner tank. The GRC 3IK15A-S motor with the rated power of 15 W is used. The XSD350-0.4G1 frequency converter produced by Xuzhou Xinshengda Automation Equipment Co., Ltd is used. The lighting used is an LED guide lamp, which belongs to fixed lamps, and the model is D-ST202-024C, produced by Guangdong Delixi Lighting Co., LTD. An iron frame is used to fix the motor connected to the frequency converter so that the connected stirring impeller is located in the middle of the stirred tank. A filter paper is arranged behind the stirred tank, and the light source is used to irradiate the stirred tank directly through the filter paper. The acA2040-120 μm camera produced by Basler is used. The camera position was adjusted, and the lens was fixed 20 cm away from the outer wall of the outer tank, and the lens was set to directly face the tank so that the center of the image was the stirring impeller. In addition, the height of the bottom of the camera was 30 mm higher than the bottom surface of the inner tank. In this study, the continuous shooting mode was selected, and the frame rate was 60 s-1. The exposure time was 3 m. The obtained images were grayscale images with a resolution of 1,536 × 2048. The images taken were uploaded to the computer for processing and analysis. The impellers used are made of stainless steel, and the specific data are shown in Table 2. Six sets of impellers were used in this work: a 120-mm-diameter Rushton impeller and five two-inclined blade impellers with diameters of 90 mm, 105 mm, 120 mm, 135 mm, and 150 mm. Among them, blade height refers to the vertical distance between the highest point and the lowest point of the blade when the impeller shaft is vertical. The blade width is the maximum horizontal distance between the two ends of the symmetry axis on the blade plane. These impellers were custom-made, and their dimensions were further verified by Vernier caliper measurements before the experiment.
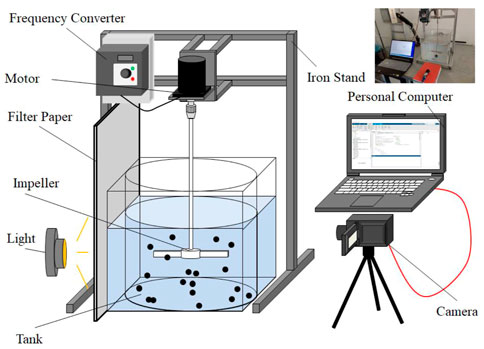
FIGURE 1. Schematic diagram of a device of solid–liquid mixing image processing and mixing quality measurement.
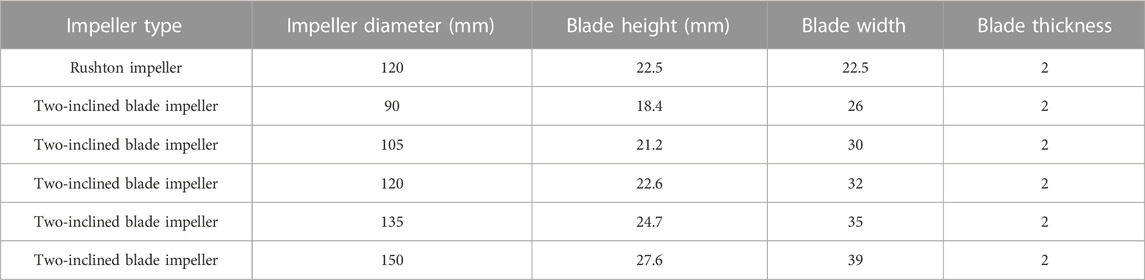
TABLE 2. Impellers used in this work.
The materials used are shown in Table 3. In the solid–liquid two-phase system, water is chosen as the liquid phase, with density
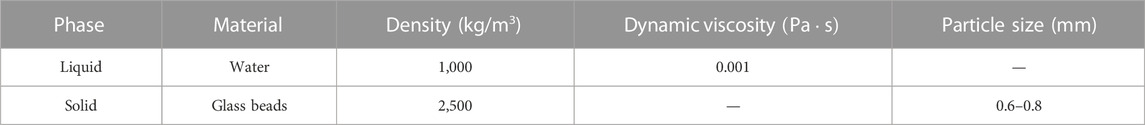
TABLE 3. Mixing materials used in this work.
In all cases, the impeller used was mounted on an 8-mm shaft connected to the fixed frequency converter and motor. The specific conditions of the different systems studied in this work are provided in Table 4. The stirring speed v of each group was increased from 200 r/min to 270 r/min by 10 r/min each time. The reason for choosing this speed range is that it is difficult to suspend the solid when the speed is lower than 200 r/min, while the mixing system becomes unstable when the speed is higher than 270 r/min, and a large number of bubbles are generated in the mixing, which affects the image processing. The main factors to be studied were impeller type, impeller diameter d, and the height of the impeller from the bottom h. Among them, the height of the impeller from the bottom h refers to the vertical distance between the bottom of the impeller blade and the bottom. In this study, the impeller diameter and its height from the bottom were described by the ratio between them and the inner diameter of the stirred tank. The first letter in the system name stands for impeller type, where R stands for Rushton impeller and T for two-inclined impeller. The number after R or T represents the impeller diameter in mm. h represents the height of the impeller from the bottom, and the following number is its value in mm.
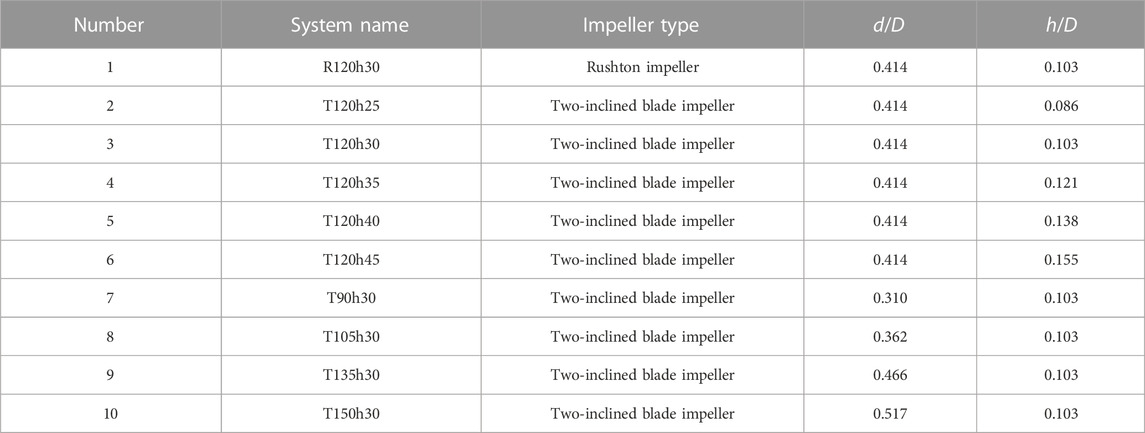
TABLE 4. Summary of the systems studied in this work.
For the 3D region of solid–liquid mixing, the volume solid holdup can be obtained by the ratio of solid volume to the total volume of the region, which can characterize the solid suspension amount in the region. Therefore, for obtaining the 2D image of solid–liquid mixing, the ratio of the solid phase area to the total area can also be used to characterize it to a certain extent. In this regard, the area ratio of the solid phase in the solid–liquid mixing image is defined as the ratio of the solid phase area to the entire image area in the obtained solid–liquid mixing image, which is represented by symbol r in this study. In this study, the solid–liquid mixing image is finally processed into a binary image, where the white part of the gray value 255 represents the solid phase, so r can be calculated using Eq. 1.
where
The Lp-star discrepancy is the most commonly used discrepancy in the number theory method, which is defined as the Lp norm of the difference between the uniform distribution and the empirical distribution function, given by Eq. 2.
where the test region is set at
Lp-star discrepancy is an average of the local discrepancy function on the test area or the maximum value of the absolute value of the local discrepancy function. When p = 2, the simple expression for calculating the L2-star discrepancy is given by Eq. 3.
where
where
where
After preparing the required experimental devices and materials, and writing the required mathematical software program, the following steps are employed:
Step.1. The experimental devices were installed according to the requirement. Next, the corresponding mass of glass beads was added to the glass reactor in turn, and then water was added to the specified height. After the glass beads had completely stood, the frequency converter was started and adjusted until the speed of the connected motor met the requirement. Then, the mixing began. As the stirring speed increased, the particles at the bottom of the tank gradually floated up and distributed in the liquid phase.
Step.2. When the glass beads were stably suspended under this stirring condition, that is, they could maintain their suspension motion state, the distribution of the solid particles in the liquid phase was continuously recorded by the camera, and 15 solid–liquid mixing images of resolution 1,536 mm × 2,048 mm were obtained under this condition. After the completion of one set of experiments, the experimental conditions were changed according to the requirements to continue the next set of experiments.
Step.3. The recorded solid–liquid mixing images were uploaded to a personal computer. Due to the restriction of mixing conditions, uniform suspension was difficult to achieve. Moreover, there were also problems, such as uneven brightness and interference from impurities, and the whole image obtained cannot be processed and analyzed in this study. The solid particles used in this study sank to the bottom when allowed to stand, and it is necessary to try to make them suspended upward during the mixing process. Therefore, a position with the sufficient height was selected for the study, and the impeller and vortex generated by agitation should be avoided. The process of solid–liquid mixing image processing is shown in Figure 2. First, the image of resolution 300 mm × 450 mm was captured at the top left of the impeller in the original image. Then, the low cap transform and filter transform were carried out to highlight the solid phase and reduce noise. Next, the image was binarized and opened, and the black and white images were output, where black represents the liquid phase and the white bubble represents solid phase particles.
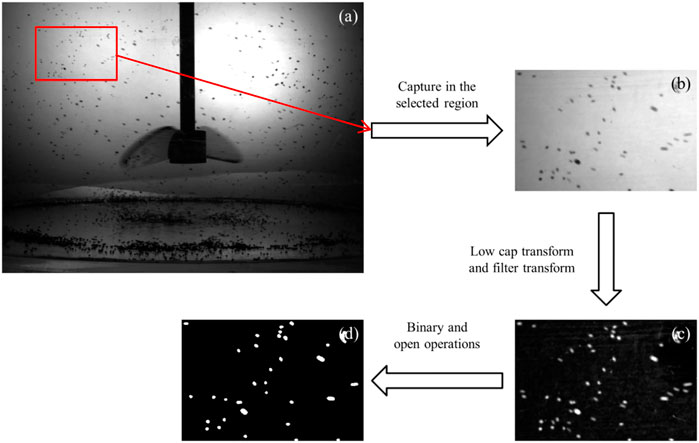
FIGURE 2. Process of solid–liquid mixing image processing. (A) Original image; (B) captured image; (C) image after low cap transform and filter transform; and (D) image after binarization and open operation.
Step.4. The image was then analyzed in mathematical software. The area ratio of the solid phase in the image was calculated by the number of image pixels. The white bubble was labeled, and its centroid coordinates were obtained. The coordinates were stored and substituted into the MD program to calculate the homogeneity of solid–liquid mixing of the image, that is, the HMD of the image. In each case, the images that were not processed successfully were first excluded, and 15 qualified images were randomly selected for further calculation and analysis, and the average value of 15 results was taken as the final result of the calculation in this case.
The images of solid–liquid mixing of the selected region are shown in Figure 3. This mixing used a 120-mm two-inclined blade impeller with a height of 30 mm from the bottom. It can be seen that as the stirring speed increases, the number of solid particles in this region also increases. In addition, the images of solid–liquid mixing at the bottom of the stirred tank are shown in Figure 4. It can be found that a large number of solid particles are still deposited at the bottom of the stirred tank under the low stirring speed. They are mainly suspended at a low height in the center of the bottom or move along the wall, and there is a clear boundary between the two regions. However, when the stirring speed increases, the boundary of solid aggregation at the bottom begins to break. There is a decrease in the solid particles moving in or close to the bottom, and more solid is suspended at the top. The selected region shown in Figure 4 is above the stirring impeller, so it means that more solid particles are suspended from the bottom. As a result, solid suspension performance has been fully improved.
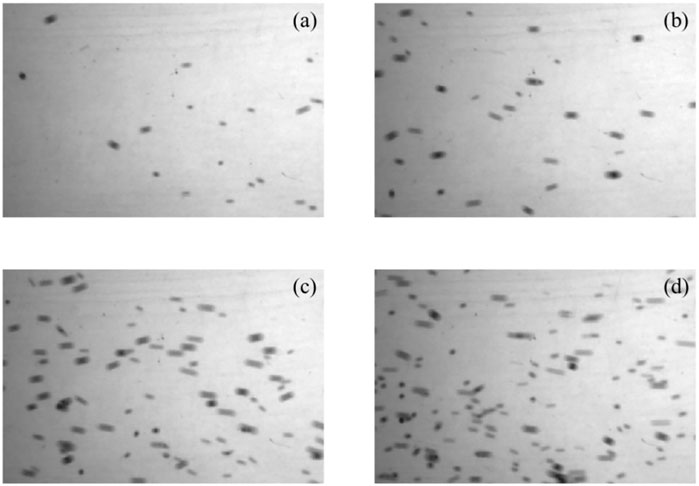
FIGURE 3. Images of solid–liquid mixing of the selected region while using the two-inclined blade impeller for stirring (D = 120 mm, h = 30 mm). (A) v = 200 r/min; (B) v = 220 r/min; (C) v = 250 r/min; and (D) v = 270 r/min.
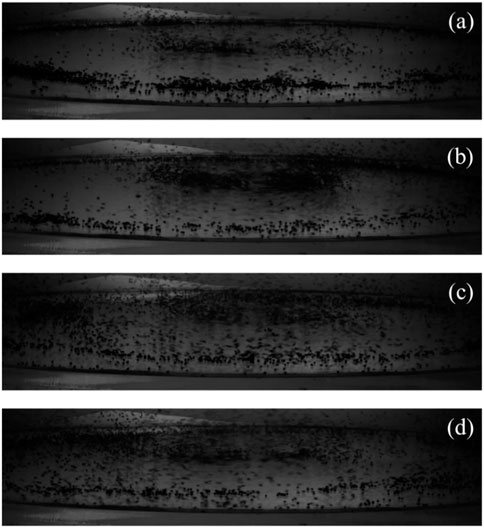
FIGURE 4. Images of solid–liquid mixing at the bottom of the stirred tank while using the two-inclined blade impeller for stirring (D = 120 mm, h = 30 mm). (A) v = 200 r/min; (B) v = 220 r/min; (C) v = 250 r/min; and (D) v = 270 r/min.
The variation in r with stirring speed is shown in Figure 5. Obviously, with the increase in stirring speed, the area ratio of the solid phase in the image of all experimental groups is improved, indicating that the solid suspension quantity at higher positions is increased.
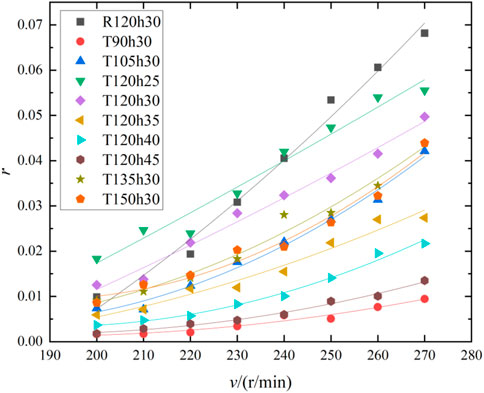
FIGURE 5. Variation in r with stirring speed v.
The variation in HMD with stirring speed is shown in Figure 6. With the increase in stirring speed, the HMD in all experimental groups shows a decreasing trend generally. In addition, when the stirring speed is higher (v > 250 r/min), the HMD of all experimental systems is closer. That is to say, in all cases of the experiments, before the stirring speed reaches the just suspension speed of the solid, with the increase in stirring speed, besides the increase in the solid suspension rate, the uniformity of solid distribution of the solid–liquid mixing system is also improved. It means that the solid suspension gradually approaches to uniform suspension, and the solid–liquid mixing quality is improved. It can be understood that in the solid–liquid mixing system where solid particles sink to the bottom at static time, the higher the axial height, the lower the solid holdup in the non-uniform mixing. The increase in stirring speed means the increase in input energy to the solid–liquid mixing system, which is conducive to more solid particles to obtain suspended energy. With the increase in the solid suspension rate, the upper solid holdup increased and the bottom solid holdup decreased, so the overall mixing tended to be uniform.
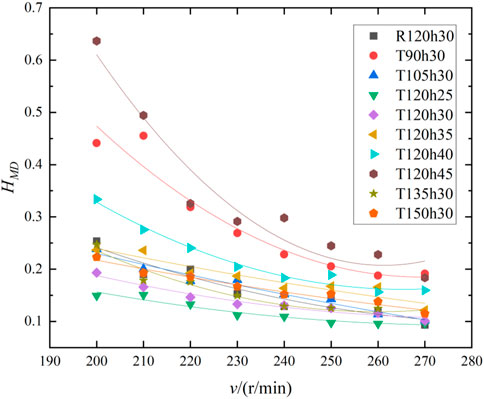
FIGURE 6. Variation in HMD with stirring speed v.
Harrison et al. 2012 performed solid–liquid mixing experiments with coarse particles ranging from 600 to 850
In order to make the image analysis using this method more convincing, the reproducibility and different location tests of the solid–liquid mixing image were carried out. Group T120h30 was selected and randomly sampled three times for analysis. Then, the image capture location was moved down to 250 pixels, and the image capture was taken in the new location. Also, three random samples were taken for analysis. The variation in r and HMD in two locations with stirring speed is shown in Figure 7 and Figure 8, respectively, where A1∼A3 represents the analysis results of the captured images in the original location and B1∼B3 represents the analysis results of the captured images in the new location. It can be seen that r still increases with the increase in stirring speed, and HMD also decreases with the increase in stirring speed. In addition, the variation curve of each group did not deviate greatly. This shows that repetitive image analysis under the same conditions can obtain good precision. However, r values in the new location are slightly higher than those in the original location, indicating that the degree of solid suspension in the new location is slightly higher. This may be due to the fact that the new location is lower in height and requires less energy for solid suspension, so the amount of solid suspension can be increased. However, HMD values in the new location are slightly larger than those in the original location at high stirring speed, indicating that the solid–liquid mixing homogeneity in the new location is slightly lower. This may be related to the fact that the new location is closer to the impeller and is more affected by the intense flow field.
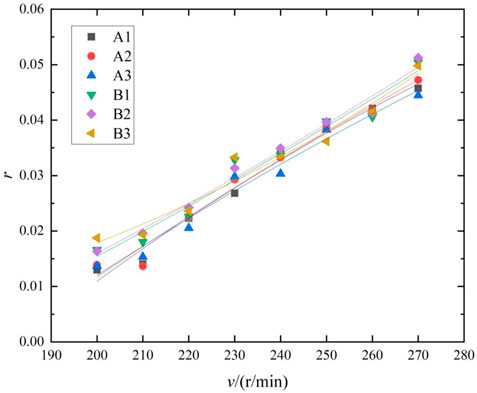
FIGURE 7. Variation in r in two locations with stirring speed v.
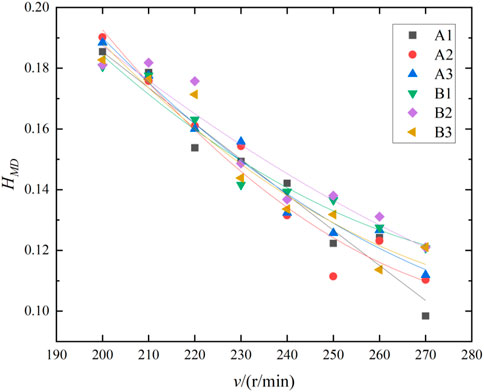
FIGURE 8. Variation in HMD in two locations with stirring speed v.
The effect of impeller type on r is shown in Figure 9. At low stirring speed, there is little difference in r between the two impellers. In addition, r increases with the increase in stirring speed. However, at a high stirring speed, r increases more rapidly while using the Rushton impeller than the two-inclined blade impeller. At the highest speed of 270 r/min in this study, r of the two-inclined blade impeller is 0.0497, while that of the Rushton impeller is 0.0682, indicating that it is easier to promote the solid suspension when the Rushton impeller is used.
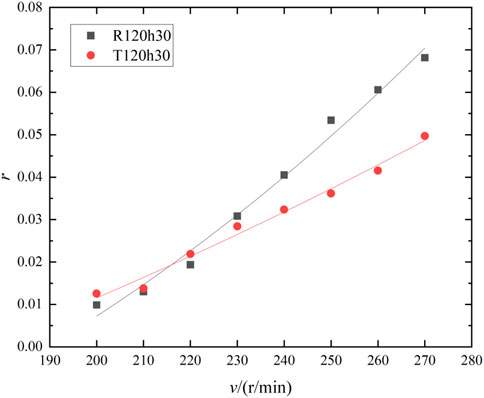
FIGURE 9. Effect of impeller type on r.
The effect of impeller type on HMD is shown in Figure 10. Under the same other conditions, when the stirring speed is less than approximately 260 r/min, HMD of solid distribution while using the two-inclined blade impeller is significantly lower than that while using the Rushton impeller, meaning that the two-inclined blade impeller can better promote the uniform distribution of the solid than the Rushton impeller at this time. However, when the stirring speed is greater than or equal to approximately 260 r/min, there is no significant difference in HMD between the two systems of experiments. For example, at the stirring speed of 270 r/min, HMD values of the two-inclined blade impeller and Rushton impeller are 0.1012 and 0.0931, respectively, showing little difference. In this way, the influence of impeller type on solid–liquid mixing quality is relatively complex. The uniformity of solid distribution may not be improved obviously when the solid suspension amount is improved obviously. The main consideration is that the two-inclined blade impeller is an axial flow impeller, and the Rushton impeller is a radial flow impeller. When the axial flow impeller is used, the fluid in the stirred tank can generate axial flow from the bottom surface to the liquid surface, circulating throughout the mixing region, perhaps thus promoting a more uniform distribution of the solid in the overall range at low rotational speed. When the radial flow impeller is used, the radial flow generated by the impeller rotation divides the mixture into the upper and lower regions, which may make the solid phase suspended to the upper layer not easy to sink, thus improving the solid phase quantity of higher suspension.
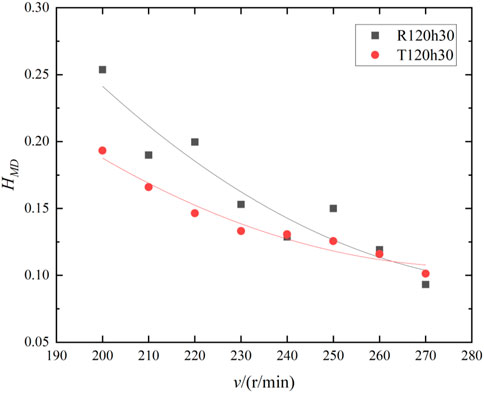
FIGURE 10. Effect of impeller type on HMD.
Therefore, in order to improve the quality of solid–liquid mixing, it is necessary to choose the impeller flexibly according to the specific situation.
The relationship between r and h/D is shown in Figure 11. At each stirring speed, r decreases with the increase in h/D, indicating that increasing the impeller bottom height will reduce the solid suspension amount at higher height. At the highest speed of 270 r/min in this study, r at h/D of 0.086 and 0.155 is 0.0555 and 0.0135, respectively, and at the lowest speed of 200 r/min, they are 0.0183 and 0.0018, respectively, showing obvious differences.
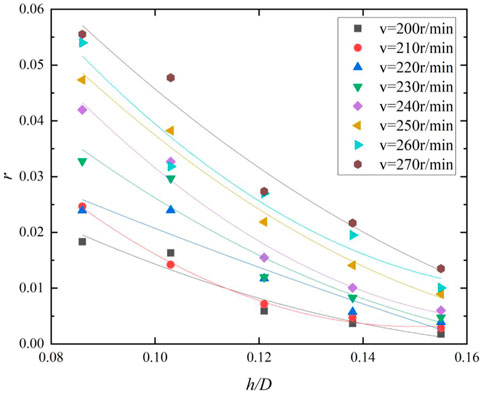
FIGURE 11. Relationship between r and h/D.
The relationship between HMD and h/D is shown in Figure 12. It can be seen that HMD increases with the increase in h/D. It means that the uniformity of solid distribution can be improved by reducing the height of the impeller from the bottom when other factors remain unchanged in the experiment. It can be understood that when the height of the impeller from the bottom is lower, the liquid flow discharged by the impeller rotation has a stronger effect on the bottom of the stirred tank, and the utilization efficiency of the output energy is higher. The axial flow caused by the impeller is more obvious, which promotes the upward suspension and uniform distribution of solid particles.
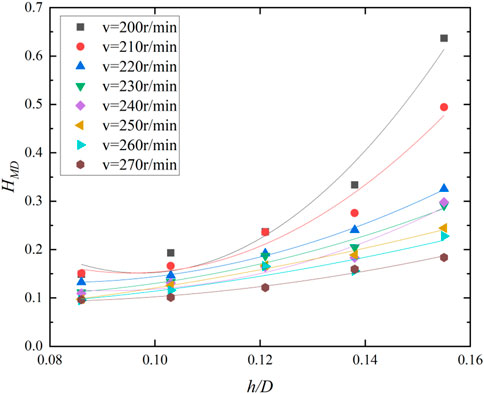
FIGURE 12. Relationship between HMD and h/D.
However, for the two groups with h/D = 0.086 and h/D = 0.155, the corresponding r and HMD and their variation trend with the stirring speed have been very close. Therefore, when the height of the impeller from the bottom is relatively large (when h/D > 0.103), the influence of the change in h/D on the solid–liquid mixing quality is more obvious. When the height is reduced enough (when h/D ≤ 0.103), the influence of the change in h/D will also be weakened. It can be understood that when the height is too low, the axial flow cycle is broken, and the liquid flow discharged by the agitation consumes the output energy with the violent collision between the bottom of the stirred tank and even the bottom wall. The energy received by the bottom of the stirred tank increases, while its loss rate also increases, so the efficiency of energy utilization decreases, making it difficult to significantly improve the effect of solid suspension. Therefore, keeping the other conditions same, reducing the height of the impeller from the bottom to a certain extent can improve the utilization of stirring energy, thus improving the solid–liquid mixing quality.
The relationship between HMD and d/D is shown in Figure 13. Obviously, with the increase in d/D, r increases significantly at the beginning. When d/D increases from 0.31 to 0.36, r increases significantly and reaches an extreme value when d/D = 0.41. Afterward, r begins to decrease with the increase in d/D. The curve trend of the relationship between r and d/D at each stirring speed is basically the same. At the highest speed of 270 r/min in this study, r at d/D = 0.41 reaches the maximum of 0.0477. Therefore, within the stirring speed range in this study, there is an optimal impeller diameter ratio for solid–liquid mixing, making the degree of solid suspension at higher positions optimal.
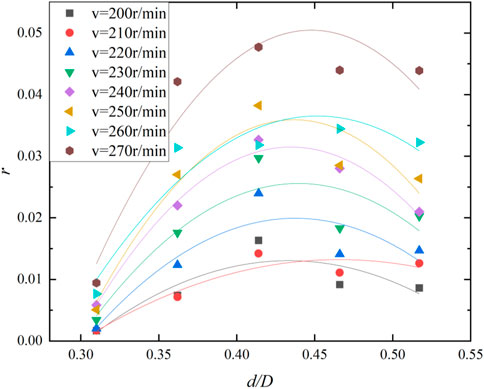
FIGURE 13. Relationship between r and d/D.
The relationship between HMD and d/D is shown in Figure 14. It can be seen that the basic trend of HMD–d/D relationship curve is almost opposite to that of the r–d/D curve. Initially, HMD decreases significantly with the increase in d/D and reaches an extreme value when d/D = 0.41. After that, HMD rises as d/D increases. Similarly, within the stirring speed range in this study, there is an optimal impeller diameter ratio, resulting in the optimal uniformity of solid distribution at higher positions. In addition, under the same optimum d/D, the degree of solid suspension and uniformity of solid distribution can reach the best.
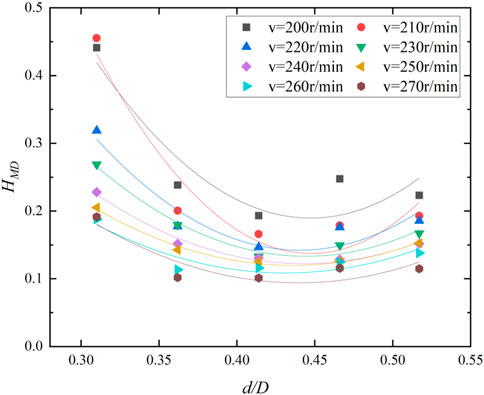
FIGURE 14. Relationship between HMD and d/D.
That is to say, in the process of solid–liquid mixing, increasing the impeller diameter within a certain range can improve the solid–liquid mixing quality. However, when an optimal impeller diameter is reached, continuing to increase the diameter will decrease the mixing effect. It can be considered that when the impeller diameter is small, the output kinetic energy of the impeller rotation to the mixture is also small, so the solid–liquid mixing quality is poor. With the increase in impeller diameter, the impeller can cause a larger amount of liquid motion, which means that the energy input to the solid–liquid mixing system increases. Therefore, the solid–liquid mixing quality is also improved. However, when the impeller diameter continues to increase, the collision between the liquid flow driven by the impeller and the bottom and wall of the stirred tank also intensifies, resulting in increased energy loss. The energy lost is gradually greater than the output energy increased by stirring, so the quality of solid–liquid mixing has a small degree of decline. Therefore, the solid–liquid mixing quality can be improved by choosing the stirring impeller with the right diameter.
The aforementioned results show that the proposed method is an effective method to measure the quality of solid–liquid mixture. This method is a non-invasive method, so it avoids the error caused by the destruction of mixing. In addition, it mainly relies on capturing dynamic images of the solid–liquid mixing process and then through image processing analysis and calculation, finally quantifies the quality of solid–liquid mixing effectively.
The solid–liquid mixing image contains the most intuitive information of the solid–liquid mixing state. This method is only needed to process the obtained solid–liquid mixing image, and the data required are the direct solid size and position information in the image. After one-step calculation, r can be obtained to reflect the degree of solid suspension, and HMD can be obtained to characterize the uniformity of solid distribution. Therefore, this method has simple steps, with no complicated operation, and reduces the influence of error accumulation in multiple operation processes. In addition, it is simpler and inexpensive, and the results are more intuitive, thus achieving higher efficiency.
However, this method also has its limitations. The first is the need to be able to see the mixture clearly inside the tank. In the laboratory, experiments can be carried out by using clear glass or organic glass tank, and it is required to use transparent liquid materials and solid materials that can be clearly seen while mixing, but this is not quite possible in industrial metal mixing tanks. Second, the solid–liquid mixing process is a three-dimensional dynamic process, but the solid–liquid mixing image obtained by this method is a two-dimensional image. The direct processing of three-dimensional information into a two-dimensional plane will still cause some errors, and it is difficult to fully describe the mixing process. Moreover, there are still some errors in image processing due to the problems such as recognition.
In this work, a method is proposed to obtain the solid–liquid mixing image, which is then processed, and the area ratio of the solid (r) is calculated, and the homogeneity of solid–liquid mixing is characterized by the modified L2-star discrepancy (HMD) to characterize the solid–liquid mixing quality. The reliability and simplicity of the proposed method are verified by solid–liquid mixing experiment and image analysis.
(1) In the experiment, when the stirring speed of the solid–liquid mixing system increases, r increases and HMD decreases, indicating that the solid suspension quantity increases and the uniformity of solid distribution improves, which is consistent with the qualitative analysis of the solid–liquid mixing image and the known research results. Therefore, this method can realize the quantification of the solid–liquid two-phase mixing quality.
(2) Using this method, it is found that in most cases, with the increase in the degree of solid suspension, the uniformity of solid distribution is also improved, especially in the experiment of the axial flow impeller. However, only a qualitative relationship can be seen. Under different conditions, the increase in the two shows little difference.
(3) When the axial flow impeller is used, the influence of factors other than the stirring speed on the quality of solid–liquid mixing is considered. In a certain range, the height of the impeller from the bottom is reduced, and the appropriate impeller diameter is selected, which can promote the solid suspension and uniform distribution, thus improving the mixing quality. In this study, when the axial flow double-inclined impeller is used, the best solid–liquid mixing quality can be obtained at d/D = 0.414 and h/D = 0.086.
In the process of industrial production, it is necessary to measure the mixing quality of solid–liquid mixing operation so as to judge the mixing degree and improve the working efficiency. The method proposed in this paper quantifies solid distribution through the position information of the solid in the optical image, which can reflect the quality of solid–liquid mixing more directly. Compared with the sampling method, probe method, and ERT method, the operation steps are reduced, thus reducing the accumulation of errors. Therefore, the resource consumption of the measurement process is reduced, and the precision is guaranteed. It provides a new way to improve the efficiency of chemical and metallurgical processes.
The raw data supporting the conclusion of this article will be made available by the authors, without undue reservation.
JW: visualization, data curation, methodology, software, and writing—original draft preparation. KY: resources. HW: supervision. HW: writing—reviewing. QX: writing—reviewing and editing. All authors contributed to the article and approved the submitted version.
The authors acknowledge the financial support from the Yunnan Fundamental Research Project, China (No. 202201BE070001-026), Natural Science Foundation of Yunnan Province, China (No. 202101AU070031), Interdisciplinary Research Project of Kunming University of Science and Technology (No. KUST-xk2022001), Open Foundation of State Environmental Protection Key Laboratory of Mineral Metallurgical Resources Utilization and Pollution Control (HB202204), and Young Elite Scientist Sponsorship Program by China Association for Science and Technology, China (No. YESS20210106).
The authors wish to especially thank the referees for numerous detailed questions and comments that greatly improved the presentation.
The authors declare that the research was conducted in the absence of any commercial or financial relationships that could be construed as a potential conflict of interest.
All claims expressed in this article are solely those of the authors and do not necessarily represent those of their affiliated organizations, or those of the publisher, the editors, and the reviewers. Any product that may be evaluated in this article, or claim that may be made by its manufacturer, is not guaranteed or endorsed by the publisher.
D, inside diameter of the stirred tank, mm; d, impeller diameter, mm;
Blower, A. L., Bakalis, S., and Watson, N. J. (2020). A review of in-line and on-line measurement techniques to monitor industrial mixing processes. Chem. Eng. Res. Des. 153, 463–495. doi:10.1016/j.cherd.2019.10.045
Bohnet, M., and Niesmak, G. (1980). Distribution of solids in stirred suspension. Ger. Chem. Eng. 3, 57–65.
Cole, K., Brito-Parada, P. R., Hadler, K., Mesa, D., Neethling, S. J., Norori-McCormac, A. M., et al. (2022). Characterisation of solid hydrodynamics in a three-phase stirred tank reactor with positron emission particle tracking (PEPT). Chem. Eng. J. 433 (3), 133819. doi:10.1016/j.cej.2021.133819
Delacroix, B., Rastoueix, J., Fredette, L., Bertrand, F., and Blais, B. (2021). CFD-DEM simulations of solid-liquid flow in stirred tanks using a non-inertial frame of reference. Chem. Eng. Sci. 230, 116137. doi:10.1016/j.ces.2020.116137
Grenville, R. K., Mak, A. T. C., and Brown, D. A. R. (2015). Suspension of solid particles in vessels agitated by axial flow impellers. Chem. Eng. Res. Des. 100, 282–291. doi:10.1016/j.cherd.2015.05.026
Gu, D., Cheng, C., Liu, Z., and Wang, Y. (2019). Numerical simulation of solid-liquid mixing characteristics in a stirred tank with fractal impellers. Adv. Powder Technol. 30, 2126–2138. doi:10.1016/j.apt.2019.06.028
Guha, D., Ramachandran, P. A., and Dudukovic, M. P. (2007). Flow field of suspended solids in a stirred tank reactor by Lagrangian tracking. Chem. Eng. Sci. 62 (22), 6143–6154. doi:10.1016/j.ces.2007.06.033
Harrison, S. T. L., Kotsiopoulos, A., Stevenson, R., and Cilliers, J. J. (2020). Mixing indices allow scale-up of stirred tank slurry reactor conditions for equivalent homogeneity. Chem. Eng. Res. Des. 153, 865–874. doi:10.1016/j.cherd.2019.10.049
Harrison, S. T. L., Stevenson, R., and Cilliers, J. J. (2012). Assessing solids concentration homogeneity in Rushton-agitated slurry reactors using electrical resistance tomography (ERT). Chem. Eng. Sci. 71, 392–399. doi:10.1016/j.ces.2011.10.053
Jafari, R., Tanguy, P. A., and Chaouki, J. (2012). Characterization of minimum impeller speed for suspension of solids in liquid at high solid concentration, using gamma-ray densitometry. Int. J. Chem. Eng. 2012, 1–15. 945314. doi:10.1155/2012/945314
Jafari, R., Tanguy, P. A., and Chaouki, J. (2012). Experimental investigation on solid dispersion, power consumption and scale-up in moderate to dense solid–liquid suspensions. Chem. Eng. Res. Des. 90, 201–212. doi:10.1016/j.cherd.2011.07.009
Katakcu, B., and Ayranci, I. (2019). Application of pressure gauge measurement method beyond its limits. Chem. Eng. Res. Des. 141, 170–180. doi:10.1016/j.cherd.2018.10.032
Kazemzadeh, A., Ein-Mozaffari, F., and Lohi, A. (2020). Hydrodynamics of solid and liquid phases in a mixing tank containing high solid loading slurry of large particles via tomography and computational fluid dynamics. Powder Technol. 360, 635–648. doi:10.1016/j.powtec.2019.10.040
Kazemzadeh, A., Ein-Mozaffari, F., and Lohi, A. (2019). Mixing of highly concentrated slurries of large particles: Applications of electrical resistance tomography (ERT) and response surface methodology (RSM). Chem. Eng. Res. Des. 143, 226–240. doi:10.1016/j.cherd.2019.01.018
Khan, M. D. S., Karim, I., Evans, G. M., Doroodchi, E., Joshi, J. B., and Mitra, S. (2020). Estimation of dispersion coefficient in a solid-liquid fluidised bed system. Powder Technol. 374, 560–576. doi:10.1016/j.powtec.2020.07.064
Lassaigne, M., Blais, B., Fradette, L., and Bertrand, F. (2016). Experimental investigation of the mixing of viscous liquids and non-dilute concentrations of particles in a stirred tank. Chem. Eng. Res. Des. 108, 55–68. doi:10.1016/j.cherd.2016.01.005
Liu, L., and Barigou, M. (2015). Lagrangian particle tracking in mechanically agitated polydisperse suspensions: Multi-component hydrodynamics and spatial distribution. Int. J. Multiph. Flow 73, 80–89. doi:10.1016/j.ijmultiphaseflow.2015.03.008
Mishra, P., and Ein-Mozaffari, F. (2016). Using tomograms to assess the local solid concentrations in a slurry reactor equipped with a Maxblend impeller. Powder Technol. 301, 701–712. doi:10.1016/j.powtec.2016.07.007
Nouri, J., and Whitelaw, J. H. (1992). Particle velocity characteristics of dilute to moderately dense suspension flows in stirred reactors. Int. J. Multiph. Flow 18 (1), 21–33. doi:10.1016/0301-9322(92)90003-y
Pacek, A. W., Moore, I. P. T., Nienow, A. W., and Calabrese, R. V. (1994). Video technique for measuring dynamics of liquid-liquid dispersion during phase inversion. AIChE J. 40 (12), 1940–1949. doi:10.1002/aic.690401203
Ren, C., Jiang, X., Wang, J., Yang, Y., and Zhang, X. (2008). Determination of critical speed for complete solid suspension using acoustic emission method based on multiscale analysis in stirred tank. Industrial Eng. Chem. Res. 47, 5323–5327. doi:10.1021/ie0714347
Rossi, A., Alberini, F., and Brunazzi, E. (2022). Identification of suspension state using passive acoustic emission and machine learning in a solid–liquid mixing system. Chem. Eng. Res. Des. 177, 273–282. doi:10.1016/j.cherd.2021.10.037
Salierno, G., Maestri, M., Fraguío, M. S., Picabea, J., Cassanello, M., Blasio, C. D., et al. (2022). Study on the aggregate motion for gas–liquid–solid agitated tank reactors design using radioactive particle tracking. Meas. Sci. Technol. 33 (9), 094004. doi:10.1088/1361-6501/ac73dd
Teoman, B., Shastry, S., Abdelhamid, S., and Armenante, P. M. (2021). Imaging method for the determination of the minimum agitation speed, Njs, for solids suspension in stirred vessels and reactors. Chem. Eng. Sci. 231, 116263. doi:10.1016/j.ces.2020.116263
Wang, Z., Chu, L., Chen, W., and Wang, S. (2008). Experimental investigation of the motion trajectory of solid particles inside the hydrocyclone by a Lagrange method. Chem. Eng. J. 138 (1-3), 1–9. doi:10.1016/j.cej.2007.05.037
Xu, Z., Jin, Z., Liu, B., and Bengt, S. (2019). Experimental investigation on solid suspension performance of coaxial mixer in viscous and high solid loading systems. Chem. Eng. Sci. 208, 115144. doi:10.1016/j.ces.2019.08.002
Yang, F., Zhang, C., Sun, H., and Liu, W. (2012). Solid-liquid suspension in a stirred tank driven by an eccentric-shaft: Electrical resistance tomography measurement. Powder Technol. 411, 117943. doi:10.1016/j.powtec.2022.117943
Wang, H., Yang, K., Wang, H., Wu, J., and Xiao, Q. (2023). Statistical image analysis on liquid-liquid mixing uniformity of micro-scale pipeline with chaotic structure. Energies 16(4), 2045. doi:10.3390/en16042045
Yang, K., Wang, H., Li, M., and Xiao, Q. (2023a). Topological approach for the measurement of mixing state quality in a vertical rectangular channel. Int. J. Multiph. Flow. 163, 104431. doi:10.1016/j.ijmultiphaseflow.2023.104431
Yang, K., Liu, J., Wang, M., Wang, H., and Xiao, Q. (2023b). Identifying flow patterns in a narrow channel via feature extraction of conductivity measurements with a support vector machine. Sensors. 23(4), 1907. doi:10.3390/s23041907
Yang, K., Wang, Y., Li, M., Li, X., Wang, H., and Xiao, Q. (2023c). Modeling topological nature of gas–liquid mixing process inside rectangular channel using RBF-NN combined with CEEMDAN-VMD. Chem. Eng. Sci. 267, 118353. doi:10.1016/j.ces.2022.118353
Keywords: image analysis, measurement, solid–liquid, discrepancy, mixing uniformity
Citation: Wu J, Yang K, Wang H, Wang H and Xiao Q (2023) Measurement of solid–liquid mixing quality by using a uniform design method based on image analysis. Front. Energy Res. 11:1147701. doi: 10.3389/fenrg.2023.1147701
Received: 19 January 2023; Accepted: 15 May 2023;
Published: 08 June 2023.
Edited by:
Jianzhong Lin, Zhejiang University, ChinaReviewed by:
Miryan Celeste Cassanello, University of Buenos Aires, ArgentinaCopyright © 2023 Wu, Yang, Wang, Wang and Xiao. This is an open-access article distributed under the terms of the Creative Commons Attribution License (CC BY). The use, distribution or reproduction in other forums is permitted, provided the original author(s) and the copyright owner(s) are credited and that the original publication in this journal is cited, in accordance with accepted academic practice. No use, distribution or reproduction is permitted which does not comply with these terms.
*Correspondence: Haotian Wang, Mzc0Njk1MzI0QHFxLmNvbQ==; Qingtai Xiao, cWluZ3RhaS54aWFvQGt1c3QuZWR1LmNu
Disclaimer: All claims expressed in this article are solely those of the authors and do not necessarily represent those of their affiliated organizations, or those of the publisher, the editors and the reviewers. Any product that may be evaluated in this article or claim that may be made by its manufacturer is not guaranteed or endorsed by the publisher.
Research integrity at Frontiers
Learn more about the work of our research integrity team to safeguard the quality of each article we publish.