 Junxiong Ge
 Guowei Cai2
 Mao Yang
95% of researchers rate our articles as excellent or good
Learn more about the work of our research integrity team to safeguard the quality of each article we publish.
Find out more
ORIGINAL RESEARCH article
Front. Energy Res. , 12 April 2023
Sec. Solar Energy
Volume 11 - 2023 | https://doi.org/10.3389/fenrg.2023.1145448
This article is part of the Research Topic Solar Radiation and Photovoltaic System Forecasting View all 5 articles
In this paper, according to the power output characteristics of distributed photovoltaic users, the SSA-ELM (Sparrow Search Algorithm - Extreme Learning Machine) model based on weather type division is proposed for photovoltaic power day ahead prediction. Because the solar panel power generation sequence of photovoltaic users contains high frequency fluctuations, in this paper we use the power sequence convergence effect to make cluster prediction on all photovoltaic panels to reduce the randomness of distributed photovoltaic. The prediction accuracy is further improved by dividing weather types. The historical data of distributed PV users in a region of Gansu province is used for modeling verification, and the results show that the prediction error of the proposed method is lower. In bad weather, the root mean square error is at least 0.02 less than the comparison model, and the average annual accuracy rate is 93.2%, which proves the applicability of the proposed method in different output types.
The competitiveness of photovoltaic system compared with other new energy generation technologies not only increases the installed capacity of photovoltaic systems in photovoltaic power stations in recent years, but also increases the number of solar panels installed by distributed photovoltaic users (Arghvadeep et al., 2019). Due to the geographical location, installation conditions and other issues, distributed photovoltaic has strong randomness, intermittency and uncertainty (Ji-dong et al., 2020). After the photovoltaic user power generation system is connected to the grid, it may affect the power system dispatching generation plan, and unit maintenance and other tasks in a certain region (Ming-hong et al., 2012; Peiman and Navid, 2020). The power day-ahead prediction for distributed photovoltaic users is of great significance to the power dispatching department and future photovoltaic power generation planning (Si-fan et al., 2018; Shafqat et al., 2021). High-precision photovoltaic power prediction can provide accurate short-term power prediction, so as to help the production planners of photovoltaic power stations to reasonably arrange the operation mode of the photovoltaic power station, such as the overhaul and maintenance of solar energy equipment in the no-light period (Sandeep K. et al., 2020), reduce the abandonment of light, and improve the economic benefits of the photovoltaic power station.
Aiming at the defects of distributed photovoltaic power stations (Han-fang et al., 2019), literature (Wei et al., 2022) analyzed and studied the mechanism of solar power generation, established physical models to obtain numerical weather prediction (NWP) data of power stations to be predicted as the basis for power prediction. However, the paper did not consider distributed power stations with small installed capacity and different installation methods (Shi-wei et al., 2023). Literature (Ming et al., 2022) concluded that wind power clusters can reduce the fluctuation frequency (Mao et al., 2021) and the difference of daily maximum power values through step-by-step cumulative analysis of power values at various historical points of a large number of active wind farms. Based on this study, this paper migrates the method and conclusion to photovoltaic power and verifies that they have similar characteristics. In literature (Ze-xian et al., 2021), the clustering method was used to decompose the power sequence into trend and random sequence and model prediction respectively. However, the clustering algorithm was too simple to consider the difference of PV output duration (Shu-xia et al., 2023), so it could not effectively divide the power series after the time delay problem occurs. By analyzing the characteristics of photovoltaic power curve data, literature (Mao and Kai-xuan, 2021) modeled and predicted different frequency components of power series respectively according to their own characteristics, but this method did not combine the actual physical significance corresponding to each frequency. In literature (Kazutoshi et al., 2018), dimensionality reduction method was used to extract effective features of NWP meteorological data as model input to improve the prediction accuracy (Peng et al., 2021; António and Ana, 2022), but it was not verified in other aspects. On the basis of clustering, the literature (Mao et al., 2022) used the deep learning network as the prediction model to greatly reduce the error. However, the model was too complex, and overfitting may occur in the face of data of different geographical locations and different characteristics (Rui et al., 2022; Zanetti et al., 2022). Literature (Mao et al., 2020) analyzed the characteristics of wind power, excavated the change trend of power data to improve the prediction effect. On this basis, this paper optimized the prediction model for the characteristics of distributed photovoltaic user data in the study of photovoltaic power prediction to reduce the prediction error.
To sum up, different installed angles and capacities of photovoltaic panels for distributed photovoltaic users lead to poor data quality and so on (Han et al., 2022), which makes it difficult for the prediction model to explore its data series features. Therefore, we aggregated all users within the fixed area to be predicted to prediction, which reduce data fluctuations and the adverse impact of poor data quality on subsequent prediction. The characteristics of PV power output curve are different due to seasons or different weather types. In order to further improve the accuracy of power prediction, weather types need to be divided, meteorological data with high correlation should be screened and feature extraction should be carried out, and dimension reduction results should be used as the classification basis to improve the accuracy of type classification and improve the accuracy of PV power prediction. Improve the capacity of power grid to absorb photovoltaic energy and reduce the phenomenon of light abandonment.
The main contributions of this paper are as follows.
1) Firstly, by analyzing the common problem of distributed photovoltaic power generation system, this paper proposed to sum up the photovoltaic solar panels with limited installed capacity to forecast to reduce the error. Due to the small installed capacity and different installation angles of distributed PV users, PV power output has stronger randomness and intermittency, and the daily power curve of a single PV panel has a sudden increase or drop. According to the convergence effect of power sequence, cluster prediction was carried out for distributed PV users to reduce the influence of data fluctuations on prediction.
2) Secondly, in view of the problem that the solar panels of distributed photovoltaic users are not configured with NWP data system, this paper divided historical power data into different output types by clustering to reduce the dependence of the subsequent prediction model on NWP data.
3) Finally, through the correlation analysis of the distributed photovoltaic historical data from 2021 to 2022 in a county in Gansu Province, this paper selected NWP data with high correlation with power sequence as the prediction basis, and used feature extraction method to reduce the dimension of the selected NWP data. Effective prediction data were extracted to verify the universality of the proposed method under different output types.
The chapters of this paper are arranged as follows: Section 1 will analyze the output characteristics of distributed PV users and the pretreatment before prediction. Section 2 introduces the specific weather type and the classification method of photovoltaic output type. Section 3 is the prediction method chosen in this paper and the overall forecast framework. In Section 4, the method proposed in this paper is verified by modeling and forecasting the actual operating data of photovoltaic power generation. Finally, the conclusion is given in Section 5.
The effective grid connection of distributed photovoltaic power generation can further promote the development of new energy industry, and the prediction of daily power output curve becomes an important link. Compared with centralized photovoltaic power stations, the lack of meteorological spatio-temporal information data of distributed photovoltaic power stations increases the prediction difficulty (Aike et al., 2021). Considering the prediction cost, it is impossible to achieve accurate meteorological services for all distributed users. According to the existing problems and referring to the prediction method of centralized photovoltaic power station, the distributed photovoltaic users who are close to each other in a fixed area share the public NWP data in this area to make up for the missing meteorological data.
Due to the different installation methods, photovoltaic panel angles, user geographical locations and other conditions of photovoltaic users, each photovoltaic panel of photovoltaic users is predicted separately in a single field. The prediction effect based on public NWP data cannot fully meet the requirements. The daily power output curve of distributed photovoltaic users has poor regularity, which is more random and intermittent except for the daily periodicity of photovoltaic power output. To solve this problem, cluster prediction is carried out for distributed photovoltaic users whose geographical locations are close to each other and within the same NWP prediction area. According to the convergence effect of wind power series, summing the output power of different distributed photovoltaic solar panels for prediction can reduce the drastic fluctuation of photovoltaic power curve, indirectly weaken the impact on prediction, and improve the prediction effect. The frequency distribution of the first order difference value of the power sequence is used to reflect the convergence effect of photovoltaic power. As shown in Figure 1, with the increase of the number of photovoltaic users, the absolute difference of the original power sequence gradually approaches the range with smaller absolute values, which proves that the photovoltaic power sequence also has the convergence effect and can dilute the sharp fluctuations in the sequence.
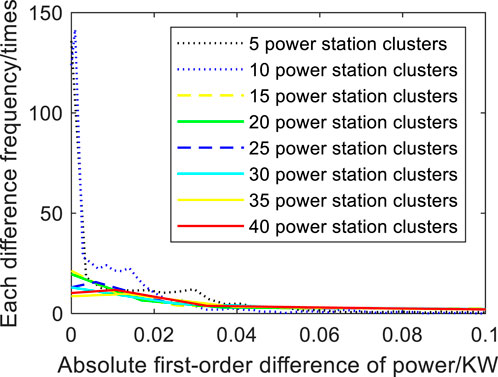
FIGURE 1. Frequency distribution of power difference absolute values of each cluster power station.
In order to further reduce the prediction error of distributed photovoltaic user clusters, the power data are classified into weather types according to the difference of NWP data sequence characteristics. The original data set is divided into sample clusters of multiple power output types through clustering, and corresponding to the output under different weather types at the same time. Then, models are built for different output types. Specific steps are as follows: 1) Calculate pearson correlation coefficient (PCC) of meteorological data series and power series in NWP, and screen out meteorological data with high correlation coefficient. 2) Principal component analysis (PCA) is used to extract the selected NWP data feature sequence and select the principal component sequence meeting the cumulative contribution rate of no less than 90% as the clustering basis. 3) The feature sequences extracted by dimension reduction are used for clustering, and the appropriate clustering method is selected according to the characteristics of the sequence data.
Under different weather conditions, the output of photovoltaic power station is affected by shortwave radiation, temperature, relative humidity and other climatic factors, and the fluctuation of power curve is different from the overall trend. Some statistical characteristics of PV daily power curve are determined by meteorological factors. Accurate classification of weather types can improve the accuracy of power prediction and reduce the prediction error (Xiao-yang et al., 2022). Meteorological factors have different degrees of influence on power sequence, and the changes of various data in NWP have great differences in the results caused by the trend and fluctuation of power curve under different weather types. Without weather classification, it is difficult for each model to distinguish the weight of different meteorological data under different output types in the training process, which will lead to poor prediction effect. The prediction accuracy of power curve fluctuation data is low, and even the prediction of trend sequence has a large deviation.
Meteorological conditions have different impacts on photovoltaic output. Using NWP data with a greater correlation with power series can not only improve the efficiency of similar day screening, but also reduce the calculation cost of the prediction model. Pearson correlation coefficient can eliminate the influence of sample variable dimension (Imane et al., 2021). The correlation between each series can be obtained by calculating the mean value and covariance of each sample data and used as the basis for weather type division. The Pearson correlation coefficient formula is shown in Eq. 1 -(4). Pearson correlation coefficient is used to measure the degree of linear correlation between two sample sequences. The larger the absolute value of PCC of two samples is, and the closer it is to 1, the stronger the correlation is; On the contrary, it is weaker.
Where:
Principal component analysis uses linear projection to map high-dimensional data processing to a low dimensional space. Based on variance, the data information is retained to the maximum extent on the low dimensions of the projection, and the original high-dimensional data features are retained to fewer sequences as much as possible during dimension reduction. PCA reconstructs the original sample sequence with certain correlation into a new set of unrelated comprehensive indicators to remove the redundant information in the original data and reduce the subsequent calculation cost (Diman et al., 2023).
PCA is used to reduce the dimension of multidimensional NWP data and extract effective features. The steps of principal component analysis are as follows: 1) Centralize all high latitude sequence features to be reduced, and each sequence feature is divided by its own mean to obtain a new sample. 2) Calculate the covariance matrix between any two samples of multidimensional data. 3) Get the eigenvalues of the covariance matrix and their corresponding eigenvectors. 4) The eigenvalues are arranged from small to large, and the final dimension reduction sequence dimension is determined according to the contribution rate and cumulative contribution rate of the principal components.
Traditional clustering algorithms mainly include hierarchical clustering, partition clustering, density clustering, grid clustering and model-based clustering. The single clustering method is difficult to ensure the clustering effect and determine the number of clusters. For large-scale photovoltaic data, the clustering accuracy and efficiency cannot be satisfied at the same time. Multi clustering is used to process the original data hierarchically and divide the clusters (Xiao-li et al., 2022). For the problems to be solved for data, specific clustering methods are selected according to the characteristics of each layer of data set, which can improve the clustering accuracy and ensure the clustering efficiency.
Due to the large amount of data, the first level clustering method of the original data set chooses partition clustering for preliminary sample cluster segmentation, and euclidean distance is selected as the distance formula by using K-means algorithm; The second layer of clustering method selects hierarchical clustering. On the basis of the first layer of clustering, the clustering center obtained by dividing clustering is used as the new data set to be clustered, and hierarchical clustering is used to prevent similar feature samples from being classified into different clusters due to the time lag problem of power series.
The optimal number of clusters is determined by the cluster evaluation index. The DBI index represents the ratio of the distance within the cluster to the distance between clusters of each sample cluster. The smaller the DBI index is, the higher the similarity of samples within each cluster and the greater the difference of sample sequences between clusters; The contour coefficient represents the compactness of each sample sequence with the inside and outside of the cluster. The larger the contour coefficient is, the better the clustering effect is; The CH coefficient represents the relationship between the data covariance inside and outside the cluster. The larger the value, the better. The formula involved in each evaluation index is as follows:
Where:
Since photovoltaic power output has annual periodicity, the annual photovoltaic daily power sequence was divided by this method, and each sample cluster corresponds to one output type. Photovoltaic power output in different seasons has different characteristics, and power curves with similar statistical characteristics may appear in different seasons, because the weather type has a higher impact on photovoltaic output. In conclusion, the classification of weather types can improve the prediction accuracy and reduce the upper limit of prediction error to some extent. After the divided sample clusters were obtained, the NWP data characteristics corresponding to the samples in each cluster were used as the basis to determine the weather type of the day to be predicted.
Sparrow search algorithm (SSA) is an intelligent iterative optimization algorithm, which can optimize the input weights and offsets based on the initial weights and thresholds randomly generated by the original prediction model to improve the accuracy of prediction (Mei-gang et al., 2022).
The sparrow search algorithm firstly calculates the fitness value of the initial variables and sorts them in order, and then iteratively updates and calculates the fitness value repeatedly through Eqs 9–11 until the conditions for stopping iteration are met and the final requirements are reached.
Where:
Extreme learning machine (ELM) is a typical single hidden layer
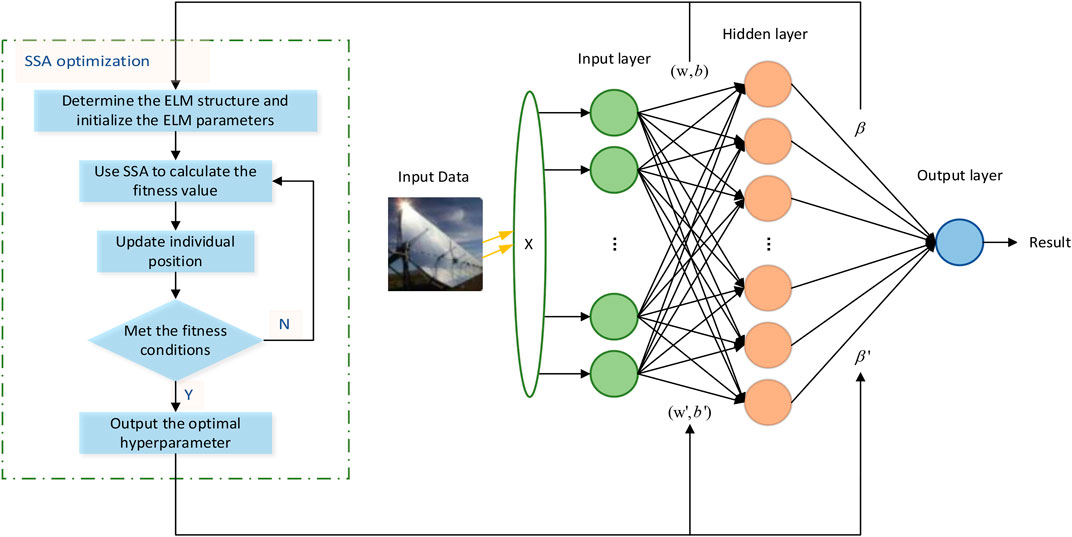
FIGURE 2. SSA-ELM network structure diagram.
The model uses the sparrow search algorithm to optimize the initial weight and threshold, and sets the optimization objective function, namely, fitness function, as the error of the training set. The smaller the error is, the higher the coincidence degree between the prediction results and the original data is. The final optimized output is the best initial weight and threshold, and then the newly obtained initial weight and threshold are input to the ELM model for power prediction.
The sparrow search algorithm optimizes the threshold value and initial connection weight value of the extreme learning machine. The fitness function of the optimization algorithm selects the mean square error (MSE) of the training set. The smaller the error index is, the closer the predicted data is to the original actual data. Finally, the optimal threshold value and initial weight value are output for prediction using the ELM model. The specific prediction process is shown in Figure 3.
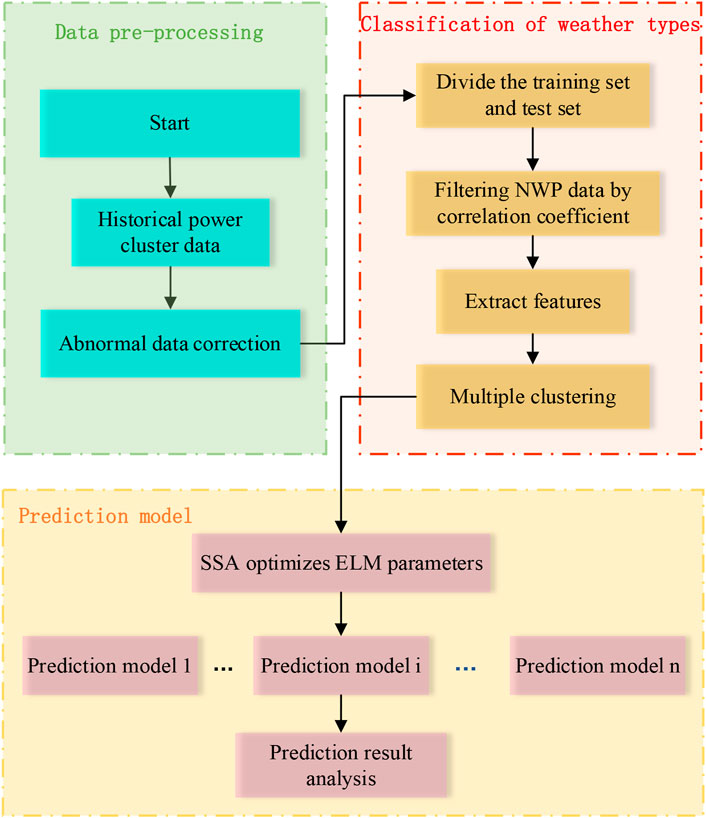
FIGURE 3. Forecast flow chart.
The actual operation data of PV power generation from 2020 to 2021 of distributed PV users in a county-level city in Gansu province were selected as the data in this paper, and the NWP data are the public data of the region where the PV users are located. The geographical location of PV panels concentrated distribution is 103°50′east longitude and 36°12′north latitude. The number of photovoltaic users is 16, with a total of 23 solar photovoltaic panels installed and put into use. The installed capacity of photovoltaic panels has three types, namely, 3 kW, 5 kW and 6kW, and the total installed capacity of 23 solar panel clusters is 90 kW. The time resolution of all data in this paper is 15 min, and the training data set is from January 1 to 31 December 2020. The test data set covers January 3 to 25 December 2021. Extreme learning machine (ELM) model, SSA-ELM model, ELM model based on weather type division, continuous method and Gate Recurrent Unit (GRU) model were selected as comparison models to prove the accuracy of the proposed method mentioned in this paper.
The prediction and evaluation indexes in this paper are root mean square error (RMSE), mean absolute error (MAE), mean error (ME), mean square error (MSE) and mean absolute percentage error (MAPE). The calculation formula is as follows:
Where:
First, the abnormal time points in the power data which are below 0 or above the installed capacity and do not conform to the physical meaning were corrected, and then the Pearson correlation coefficient between NWP data and power sequence was calculated. As shown in Figure 4, the NWP sequence with the absolute value of PCC which is not less than 0.5 was selected for feature extraction. Among them, the meteorological data that meet the requirements are temperature, ultraviolet irradiance, ultraviolet index, direct radiation, scattering and total radiation.
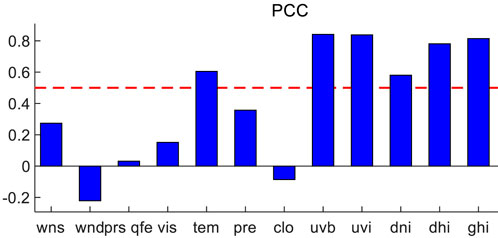
FIGURE 4. Pearson correlation coefficient graph.
The above selected sequences were used as original features for PCA dimension reduction, and the hierarchical number of subsequent clusters was determined according to the cumulative contribution rate of each principal component sequence, with 0.85 as the standard, the number of sequences reaching the requirement was the number of new features. The cumulative contribution rate of the original feature sequence in this paper is shown in Figure 5. When the number of principal component sequence is 2, the cumulative contribution rate exceeds 0.85 for the first time, namely, the number of new features is 2.
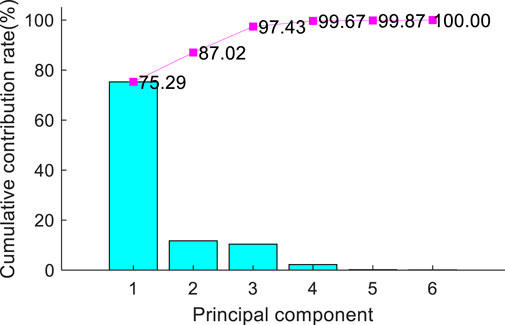
FIGURE 5. Accumulated contribution rate of the feature sequence.
Multiple clustering was performed according to the new feature sequence, so an appropriate clustering method needs to be selected according to the corresponding sequence characteristics of each layer. The daily power curve of PV is a parabola in trend, and some fluctuations are attached on the basis of the parabola affected by environmental and meteorological factors. According to Figure 5, the cumulative contribution rate of the first principal component is the highest, so this feature is used as the clustering basis of the first layer, representing the daily power output amplitude of photovoltaic. In addition, this layer needs to process the original data set with a large amount of data. Using partition clustering not only ensures the clustering efficiency, but also realizes the classification of power output sequence trend by calculating the distance between power curves. The data proportion of each cluster sample cluster is shown in Figure 6.
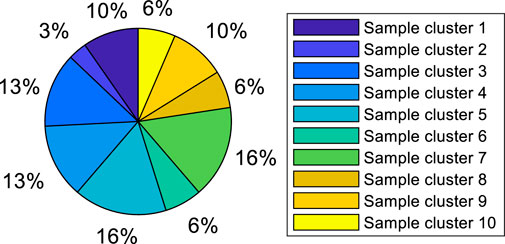
FIGURE 6. Distribution of data in the first layer.
On the basis of the first layer clustering, the feature of second dimension was taken as the clustering basis, aiming at the fluctuation of photovoltaic power curve, the centers of each sample cluster in the first layer were calculated and further divided by hierarchical clustering. Since the first two dimensional principal component feature sequences in this paper meet the cumulative contribution rate standard, only two layers of clustering were carried out. The optimal number of clusters is determined by contour coefficient, DBI index and CH coefficient. The comparison of clustering index results is shown in Figure 7. When the number of clusters is 4, DBI index is the smallest, SC coefficient is the highest, CH coefficient is the largest when the number of clusters is 3, and CH coefficient is close to the maximum when the number of clusters is 4, so the optimal number of clusters is 4.
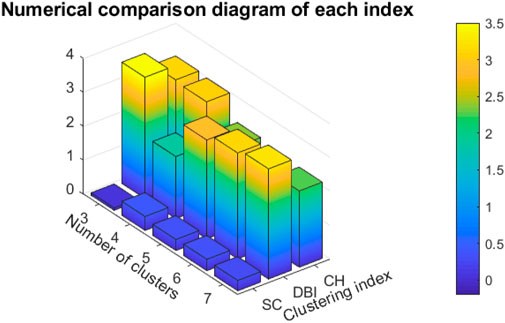
FIGURE 7. Comparison diagram of each cluster index.
According to the data characteristics of the final clustering center sequence of each sample cluster, the original data were divided into four output types, denoted by types A, B, C, and D. Among them, the overall fluctuation frequency of a sample cluster is low and its output value is high, which was defined as type A, representing photovoltaic power generation under cloudy weather. The curve fluctuation frequency is low and the amplitude of the power curve is large. The lowest daily average power value was defined as type B, representing the weather type with the worst photovoltaic output conditions and the lowest amplitude of the curve. The number of fluctuations is the largest and the output condition is not ideal, which is defined as type C, indicating that the weather condition is relatively bad, which has a great impact on the power output, and the frequency of fluctuations in the sequence is large. The cluster with the largest number of samples has a higher curve power value, and the average sunrise force is the highest among the four clusters. It is defined as type D, which represents the sunny-like weather type with ideal power generation conditions and the highest amplitude of output curve.
SSA-ELM models were established for the prediction of the four output types respectively. The training set and test set of each sample cluster data were divided according to the development order of time, and the data later in the time sequence was taken as the day to be predicted. The selection of input data of the model directly affects the prediction accuracy. The comparison of input of different feature sequences is shown in Figure 8. It can be seen that the prediction effect of the new feature sequence obtained after dimensionality reduction is better, and the predicted scatter value is closer to the contour line.
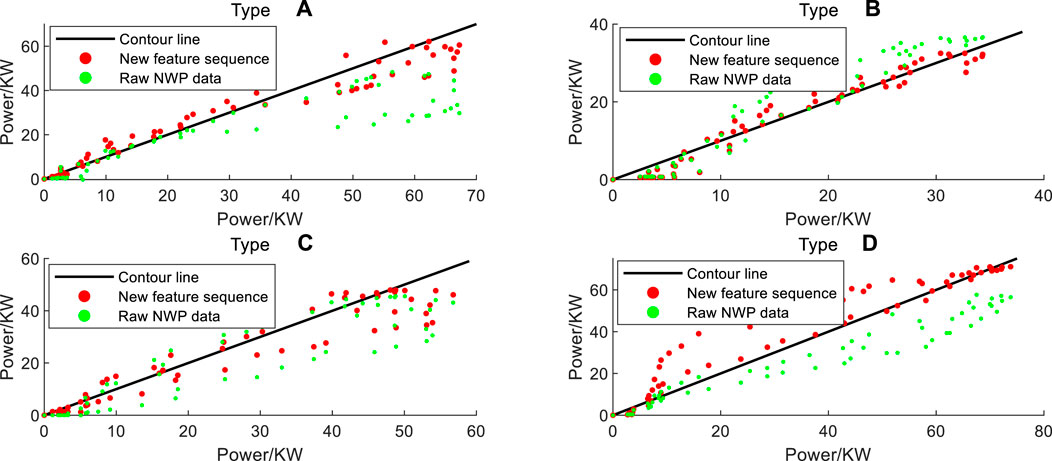
FIGURE 8. Comparison of the prediction results for different inputs.
The comparison of prediction results of various output types is shown in Figures 9–12, where the optimal number of neurons of output type A is 10. Type B, type C and type D are 2, 8 and 3 respectively, and the number of comparison model neurons that need to set the hyperparameter is the same as theirs. As can be seen from the figure, the method proposed in this paper can well predict the overall trend of the daily power curve to be predicted. Compared with other comparison models, the prediction curve of the model in this paper is closer to the actual value in terms of the changes of the fluctuation parts. When the actual power suddenly increases and decreases at adjacent time points, the tracking prediction effect of the model is also good.
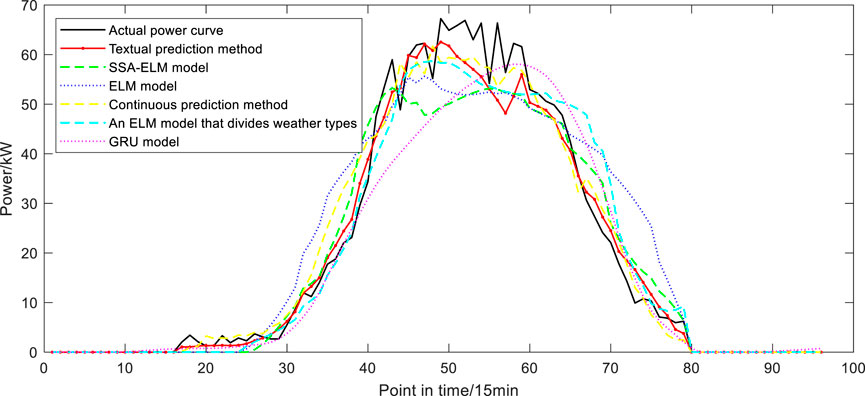
FIGURE 9. Compare the prediction results of type A.
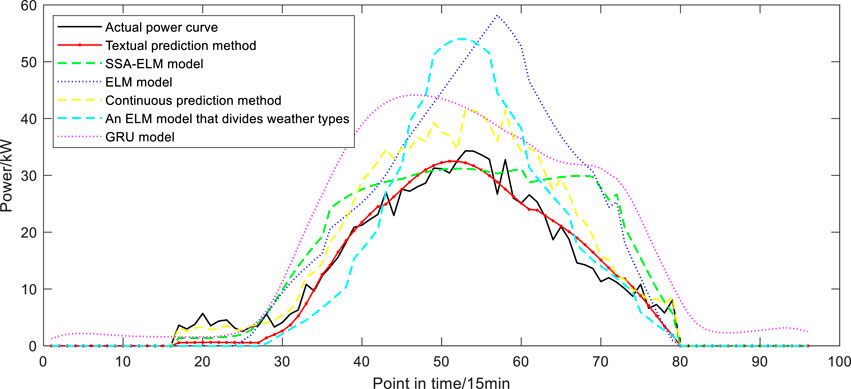
FIGURE 10. Compare the prediction results of type B.
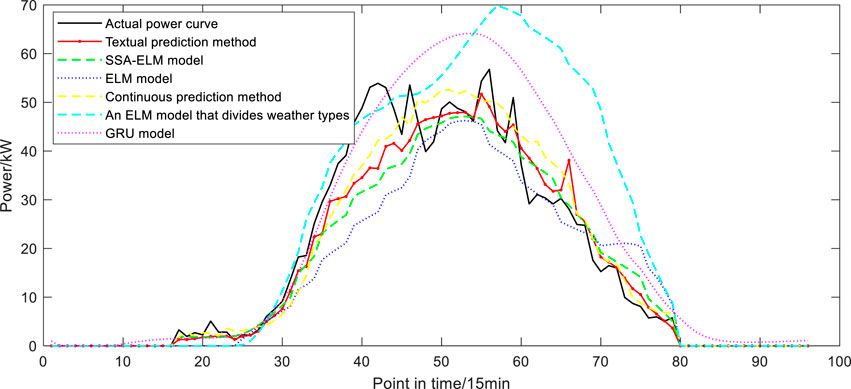
FIGURE 11. Compare the prediction results of type C.
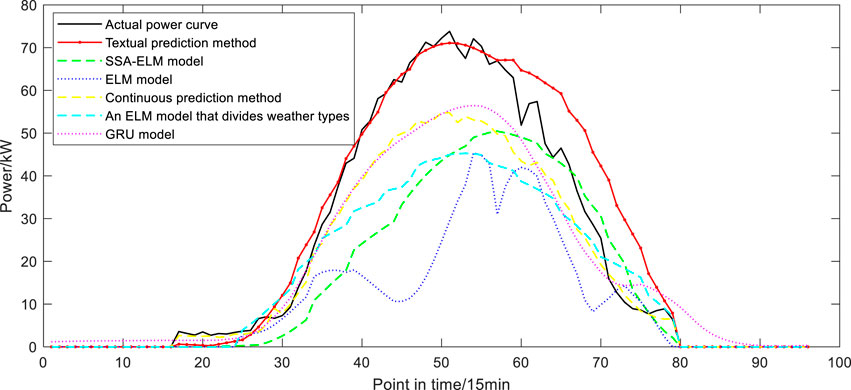
FIGURE 12. Compare the prediction results of type D.
The error evaluation indexes of the four types of prediction results are shown in Figure 13. It can be seen that for type A with good photovoltaic output conditions, the RMSE value of each model does not exceed 0.09 due to the small frequency of curve fluctuation, and the RMSE value of the model in this paper is the lowest, which is 0.039. However, the errors of models C and D with sudden power rise or fall in a small range in time series are larger. The RMSE of the model in this paper is 0.051 and 0.076, slightly higher than that under the condition of flat output. Under severe weather conditions, the error indexes of the proposed method are lower than those of the comparison model, and MAE is up to 0.042. The highest value of ME is 0.0322; The maximum values of MSE and MAPE were 12.182 and 0.116, indicating that the prediction effect of the method proposed in this paper is better than other models under the premise of unfavorable photovoltaic power output. The SSA-ELM model based on the classification of weather types can predict the photovoltaic output in complex climates, while the ELM model can only predict the change trend, and the absolute error is too large. The GRU model overfits because of its structure and training characteristics. The persistence method does not involve the use of NWP data, and the prediction accuracy decreases when the climate of the day to be predicted is abrupt. The prediction model without weather classification has poor anti-interference ability and the prediction result is not ideal.
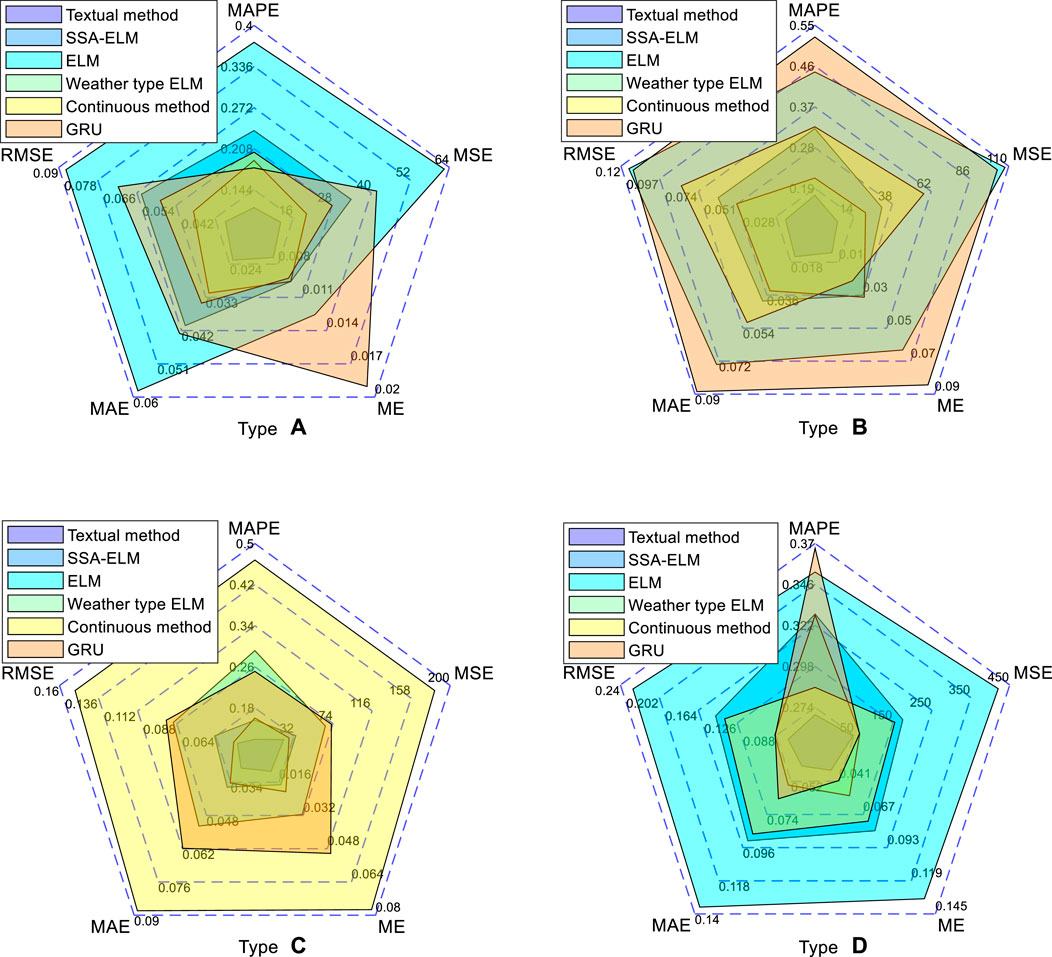
FIGURE 13. Evaluation indexes of various output types.
Compared with the direct prediction of SSA-ELM model, the RMSE of this method is reduced by 0.026, 0.04, 0.014, and 0.071 under different output types, proving that the division of weather types can improve the prediction accuracy. The prediction error of the continuous method in the comparison case is only higher than the prediction method used in this paper, the accuracy of each output type is slightly higher than other contrast model. The results show that the power series with large variation trend difference can be divided into different sample clusters by the clustering of weather types. Meanwhile, the amplitude and fluctuation characteristics of each sample series within the cluster are similar, which achieves the expected purpose. The ELM model based on weather type division has the largest error in severe output conditions, the RMSE is 0.15, higher than 0.1 of the method proposed in this paper; the MAE is 0.06 higher; MSE is increased by 163; MAPE is increased by 0.35, proving that the prediction effect of SSA-ELM model is better than ELM. For some sudden fluctuations, it is difficult to predict accurately, but the daily trend changes and some details to be predicted can be obtained. For the data set with complex fluctuations, the GRU model prediction curve deviates seriously from the actual value, indicating that the proposed method can be adapted to different meteorological conditions.
The annual power of 2021 was predicted and the average value was obtained. The predicted results are shown in Table 1. The accuracy of the method in this paper is the highest, and the errors are all the smallest, which proves that the SSA-ELM model based on the division of weather types is universal.
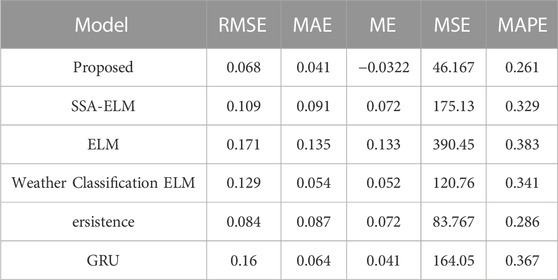
TABLE 1. Average value of each error indicator in 2021.
In order to demonstrate the applicability of this model, the data of photovoltaic users in a cluster in Qinghai Province with large differences in meteorological conditions were selected for prediction. The total installed capacity is 40 kW, and the data used are photovoltaic power output and NWP data from 2018 to 2019, among which January 3 to 28 December 2018 is the training set. From January 3 to 20 December 2019, as the test set, the annual average values of each evaluation index of the model are shown in Table 2. As can be seen from the table, the error of the model in this paper is still lower than that of the comparison model for regions with more complex weather changes, and all the prediction errors are the lowest. Compared with the model without weather classification, the prediction error is small and the anti-interference ability of the model in this paper is strong, which proves that the proposed model has good applicability to different regions and different photovoltaic output types.

TABLE 2. Average value of each error index in Qinghai Province.
In order to solve the problem that distributed photovoltaic users lack NWP forecasting equipment and the power output is difficult to predict due to strong fluctuation, this paper adopts the photovoltaic user cluster prediction method and uses the convergence effect of power series to enhance the regularity of daily power curve. Based on the feature extraction of regional public NWP data, power data with different changing trends are divided by multiple clustering, and different types are modeled and predicted respectively.
Historical data of distributed PV users in a region of Gansu province are used to verify the effectiveness of the proposed method. The annual average accuracy was 0.932, higher than that of other comparison models. The annual average RMSE of the predicted value of the model was reduced by 0.103 compared with other comparison models, and the error values of MAE, ME, MAPE and MSE were the minimum. It is proved that the proposed method is applicable to distributed PV users under different weather types.
The original contributions presented in the study are included in the article/supplementary materials, further inquiries can be directed to the corresponding authors.
All authors contributed to this research. JG conducted the experiments, performed the experiments, and wrote the draft of this paper. GC, LJ, HH, and JZ suggested the study idea and shared in writing and revising the paper.
This work was supported by Shenzhen Guodian Technology & Communication Co., LTD. Science and Technology project “Development Service of Photovoltaic User Power Generation Forecasting System” under Grant SGSCGD00W2XX220935.
HH and JZ were employed by Shenzhen Guodian Technology Communication Co., Ltd.
The remaining authors declare that the research was conducted in the absence of any commercial or financial relationships that could be construed as a potential conflict of interest.
The authors declare that this study received funding from Shenzhen Guodian Technology & Communication Co., LTD. The funder had the following involvement in the study: suggested the study idea and shared in writing and revising the paper.
All claims expressed in this article are solely those of the authors and do not necessarily represent those of their affiliated organizations, or those of the publisher, the editors and the reviewers. Any product that may be evaluated in this article, or claim that may be made by its manufacturer, is not guaranteed or endorsed by the publisher.
Aike, K., Ye-long, Z., Xiang-yu, M., Wang, D., Xina, J., Yang, X., et al. (2021). The linkage between renewable energy potential and sustainable development: Understanding solar energy variability and photovoltaic power potential in Tibet, China. Sustain. Energy Technol. Assessments 48, 101551. doi:10.1016/j.seta.2021.101551
António, C., and Ana, E. (2022). Enhancing wind power forecast accuracy using the weather research and forecasting numerical model-based features and artificial neuronal networks. Renew. Energy 201, 1076–1085. doi:10.1016/j.renene.2022.11.022
Arghvadeep, P., Osama, A., Adeeb, J., and Louzazni, M. (2019). Assessment of artificial neural networks learning algorithms and training datasets for solar photovoltaic power production prediction. Front. Energy Res. 7. doi:10.3389/fenrg.2019.00130
Diman, H., Haval, I. H., and Masoud, M. (2023). Hassan,Heart disease prediction based on pre-trained deep neural networks combined with principal component analysis. Biomed. Signal Process. Control 79, 1.
Han, Chang., Lin, Feng-Jing., Hou, Y. L., Chen, L. Q., Yang, Y. J., Liu, T. Y., et al. (2022). Development of a mathematical model to size the photovoltaic and storage battery based on the energy demand pattern of the house. Front. Energy Res. 10. doi:10.3389/fenrg.2022.945180
Han-fang, L., Hong-yu, L., and Qing-kun, T. (2019). Research on the policy route of China’s distributed photovoltaic power generation. Energy Rep. 6, 254–263.
Imane, J., Fatima-Zahra, B., Mohammed Issam, K., and Amine, T. (2021). Prediction of solar energy guided by pearson correlation using machine learning. Energy 224, 120109. doi:10.1016/j.energy.2021.120109
Ji-dong, L., Shi-jun, C., Yu-qiang, W., Qin-hui, W., Xing, L., Li-jian, Q., et al. (2020). How to make better use of intermittent and variable energy? A review of wind and photovoltaic power consumption in China. Renew. Sustain. Energy Rev. 137.
Kazutoshi, H., Yu, F., and Yasuhiro, H. (2018). Feature extraction of NWP data for wind power forecasting using 3D-convolutional neural networks. Energy Procedia 155, 350–358. doi:10.1016/j.egypro.2018.11.043
Mao, Y., Chao-yu, S., and Hui-yu, L. (2021). Day-ahead wind power forecasting based on the clustering of equivalent power curves. Energy 218, 119515. doi:10.1016/j.energy.2020.119515
Mao, Y., and Kai-xuan, W. (2021). PV output front interval prediction based on CEEMD-DBN model. High. Volt. Eng. 47 (04), 1156–1164.
Mao, Y., Luo-bin, Z., Yang, C., Yi, Z., Yu-lin, C., and Gan-gui, Y. (2020). Investigating the wind power smoothing effect using set pair analysis. IEEE Trans. Sustain. Energy. 11 (3), 1161–1172. doi:10.1109/tste.2019.2920255
Mao, Y., Meng, Z., Da-wei, H., and Su, X. (2022). A composite framework for photovoltaic day-ahead power prediction based on dual clustering of dynamic time warping distance and deep autoencoder. Renew. Energy 194, 659–673. doi:10.1016/j.renene.2022.05.141
Mei-gang, D., Zuo-gang, Y., Ying, Z., Long-jie, F., Hao-yi, Z., Zhen-sheng, L., et al. (2022). Wavefront shaping using improved sparrow search algorithm to control the scattering light field. Opt. Laser Technol. 156, 108529. doi:10.1016/j.optlastec.2022.108529
Ming, P., Lin, Y., Yi-lin, L., Ya-di, L., Song, X., Yu, Y., et al. (2022). Short-term regional wind power forecasting based on spatial–temporal correlation and dynamic clustering model. Energy Rep. 8, 10786–10802. doi:10.1016/j.egyr.2022.08.204
Ming-hong, P., Li-an, L., and Chuan-wen, J. (2012). A review on the economic dispatch and risk management of the large-scale plug-in electric vehicles (PHEVs)-penetrated power systems. Renew. Sustain. Energy Rev. 16 (3), 1508–1515. doi:10.1016/j.rser.2011.12.009
Peiman, M., and Navid, G. (2020). Economic battery sizing and power dispatch in a grid-connected charging station using convex method. J. Energy Storage 31, 101651. doi:10.1016/j.est.2020.101651
Peng, L., Lin, Y., Yong-ning, Z., Bin-hua, D., Ming, P., and Zhuo, L. (2021). Feature extraction of meteorological factors for wind power prediction based on variable weight combined method. Renew. Energy 179, 1925–1939. doi:10.1016/j.renene.2021.08.007
Rui, A., Zi-hao, W., Zhao-min, T., Si-xian, Q., Yi, Z., and Yao-lin, L. (2022). How the built environment promotes public transportation in wuhan: A multiscale geographically weighted regression analysis. Travel Behav. Soc. 29, 186–199. doi:10.1016/j.tbs.2022.06.011
Sandeep, K., Al-Dahidi., S., and Vaidya, B. (2020). A comparison study of extrapolation models and empirical relations in forecasting solar wind. Front. Astronomy Space Sci. 7. doi:10.3389/fspas.2020.572084
Shafqat, M., Yog, S., and Jarial, R. K. (2021). Design and optimization of photovoltaic system with a week ahead power forecast using autoregressive artificial neural networks. Mater. Today Proc. 52 (3), 834–841.
Shi-wei, Y., Rui-lian, H., and Jun-jie, Z. (2023). Reassessment of the potential for centralized and distributed photovoltaic power generation in China: On a prefecture-level city scale. Energy 262, 125436. doi:10.1016/j.energy.2022.125436
Shu-xia, Y., Xiong-fei, W., Yu-gui, Y., and Jia-lin, L. (2023). Bi-level planning model of distributed PV-energy storage system connected to distribution network under the coordinated operation of electricity-carbon market. Sustain. Cities Soc. 89, 104347. doi:10.1016/j.scs.2022.104347
Si-fan, J., Can, W., Chen, C., Cao, E., and Song, Y. (2018). Distributed photovoltaic generation in the electricity market: Status, mode and strategy. CSEE J. Power Energy Syst. 4 (3), 263–272. doi:10.17775/cseejpes.2018.00600
Wei, L., Pengcheng, T., Han, L., and Peizhi, Z. (2022). Intelligent voltage prediction of active distribution network with high proportion of distributed photovoltaics. Energy Rep. 8 (13), 894–903. doi:10.1016/j.egyr.2022.08.142
Xiao-li, T., Wan-qing, L., Ze-shui, X., Gang, K., and Chuming, N. (2022). An endo-confidence-based consensus with hierarchical clustering and automatic feedback in multi-attribute large-scale group decision-making. Inf. Sci. 608, 1702–1730. doi:10.1016/j.ins.2022.07.042
Xiao-yang, W., Yun-lin, S., Duo, L., and Jin-qing, P. (2022). Comparative study of machine learning approaches for predicting short-term photovoltaic power output based on weather type classification. Energy 240, 122733. doi:10.1016/j.energy.2021.122733
Zanetti, M., Allegri, E., Sperotto, A., Torresan, S., and Critto, A. (2022). Spatio-temporal cross-validation to predict pluvial flood events in the Metropolitan City of Venice. J. Hydrology 612, 128150. doi:10.1016/j.jhydrol.2022.128150
Ze-xian, S., Ming-yu, Z., Yan, D., Xin, C., and He-xu, S. (2021). Hybrid model with secondary decomposition, randomforest algorithm, clustering analysis and long short memory network principal computing for short-term wind power forecasting on multiple scales. Energy 221, 119848. doi:10.1016/j.energy.2021.119848
Keywords: distributed photovoltaic users, photovoltaic output type, frequency fluctuations, cluster prediction, dividing weather types
Citation: Ge J, Cai G, Yang M, Jiang L, Hong H and Zhao J (2023) Short-term prediction of PV output based on weather classification and SSA-ELM. Front. Energy Res. 11:1145448. doi: 10.3389/fenrg.2023.1145448
Received: 16 January 2023; Accepted: 27 March 2023;
Published: 12 April 2023.
Edited by:
Mawloud Guermoui, Applied Research Unit for Renewable Energies, AlgeriaReviewed by:
Kenneth E. Okedu, EPEC Group, AustraliaCopyright © 2023 Ge, Cai, Yang, Jiang, Hong and Zhao. This is an open-access article distributed under the terms of the Creative Commons Attribution License (CC BY). The use, distribution or reproduction in other forums is permitted, provided the original author(s) and the copyright owner(s) are credited and that the original publication in this journal is cited, in accordance with accepted academic practice. No use, distribution or reproduction is permitted which does not comply with these terms.
*Correspondence: Mao Yang, eWFuZ21hbzgyMEAxNjMuY29t
Disclaimer: All claims expressed in this article are solely those of the authors and do not necessarily represent those of their affiliated organizations, or those of the publisher, the editors and the reviewers. Any product that may be evaluated in this article or claim that may be made by its manufacturer is not guaranteed or endorsed by the publisher.
Research integrity at Frontiers
Learn more about the work of our research integrity team to safeguard the quality of each article we publish.