 Haibo Li
 Keteng Jiang
 Zongxiang Lu1,2*
- 1Tsinghua Sichuan Energy Internet Research Institute, Chengdu, China
- 2Tsinghua University, Beijing, China
- 3Institute of Economics and Technology State Grid Jiangsu Electric Power Co., Ltd., Nanjing, China
Large-scale offshore wind power generation has become one of the research hotspots in the development of new energy in the world. However, the planning of far-reaching offshore wind power is faced with many technical difficulties, such as the need to consider the optimization of line transmission capacity caused by the truncation effect in combination with the wind power output probability, and solve the problem that traditional algorithms cannot solve the dynamic programming problem, and the greedy algorithm for solving the dynamic programming problem cannot solve the global optimal solution. Therefore, in order to solve the above problems, based on the full life cycle (FLC) investment calculation of the collecting and transmission system, the topology optimization model of the offshore wind power system is established. In addition, in order to solve the grid-connection problem of offshore wind farms, an improved topology optimization algorithm based on greedy idea is proposed. The optimization results show that the critical values of economic transmission distance of HVAC, FFTS and HVDC are usually 50 km and 170 km respectively. Finally, the collection scheme of the wind farm cluster including three far-reaching offshore wind farms are analyzed, and the results show that the total cost of the optimized point-to-point scheme is reduced by 5.6% and 10.2% respectively compared with the star topology and the circular collection topology, with significant economic benefits.
1 Introduction
With the continuous expansion of the demand for power resources and the gradual deterioration of the global ecological environment, countries around the world are further expanding the proportion of green energy in power generation. As one of the renewable energy, offshore wind power stands out among all kinds of new energy generation methods because of its rich resources and large scale. In 2020 alone, despite the impact of global COVID-19, the total installed capacity of global wind power still reached 96 GW (International Energy Agency, 2020). At this stage, the wind power generation system has adopted many innovative technologies and optimized configuration schemes, and wind power and high-voltage transmission technologies are gradually migrating to gigawatt deep-sea large-scale wind farms. However, the limited power transmission technology and high construction investment cost have brought new challenges to the system planning. Therefore, the configuration and the optimization of the wind power collection and transmission structure, and the benefits maximization have become the research focus of large-scale offshore wind farm planning and design, which has important engineering significance.
The topology optimization of the power collection system mainly includes the grouping and clustering of wind turbines and the optimization of the connection mode within the group. The transmission scheme optimization mainly refers to the scheme optimization between the offshore power collection station and the onshore substation. Reasonable planning of power collection system and transmission scheme can reduce investment and operation costs, increase power generation income and transmission efficiency, and thus improve economic benefits. In the research of topology optimization of power collection system, a technology of encoding network topology into binary strings was proposed to obtain specific optimal configuration of wind turbine radial clusters (Dahmani et al., 2015). In addition, there were many algorithms to solve such optimization models, such as N-best algorithm (Tan, 2013), hybrid symbiotic biological search algorithm (Wu, 2020), and classical prim algorithm of minimum spanning tree (Che, 2017). These algorithms took the maximum economic benefit as the objective function and solved the optimal installation position of wind turbine under multiple constraints. However, these optimization methods generally aimed at the topology of the power collection system, and did not coordinate the transmission scheme of the subsequent transmission system.
In terms of power transmission and grid connection, the application of high voltage alternating current (HVAC) technology and high voltage direct current (HVDC) technology in land power grid was relatively mature. Among them, HVDC transmission mode is mainly used for large-scale long-distance transmission system, and HVDC based on voltage source converter (VSC) and modular multilevel converter (MMC) has been developed to improve the transmission and control capacity of transmission line (Sun et al., 2022). In addition to high-voltage transmission technology, the fractional frequency transmission technology (FFTs), also known as low-frequency transmission technology, proposed by Wang Xifan in 1996 (Wang and Wang, 1996), (Wang et al., 2015) provides a new idea for improving the carrying capacity and transmission scale of transmission lines.
The planning of the power collection and transmission system of offshore wind farms can gain experience from the planning of onshore wind power systems, but it is also necessary to consider the power generation efficiency and transmission limitation of offshore wind power, which has economic cost in combination with the characteristics of offshore wind farms. At present, domestic and foreign scholars have established many models and methods to carry out economic analysis of offshore wind farms. A life cycle cost (LCC) cost model was used to calculates the cost of a transmission system of an offshore wind farm with a capacity of 250 MW and a transmission distance of 70 km (Zhang et al., 2017). The relationship between transmission capacity and voltage level of flexible DC transmission was analyzed, and a method is proposed to determine the economic transmission range (Zeng et al., 2011). The economy of AC and DC transmission schemes of offshore wind farms was analyzed in combination with the actual cases of domestic wind farms (Li et al., 2014). However, these schemes and calculations usually calculated the engineering cost of the transmission system according to the specific geographical location and system scale, which ignored the comprehensive (Jia et al., 2014) impact of the topology of the previous power collection system and the grid connection mode on the cost of the transmission system.
To sum up, at present, the power transmission scheme planning of large-scale offshore wind power collection and transmission system mainly considered separately from the collection (Fu et al., 2013) system and the transmission system, ignoring the impact of the transmission mode of the collection system and the limitation of AC submarine cable. On the other hands, large scale offshore wind power planning lacks general economic comparison conclusions and reliable reference data, which increase the difficulty of optimizing the wind cluster topologies. Moreover, it is difficult to solve the topology optimization with more than one transform stations using the traditional prim algorithm (Bahirat et al., 2012) or Kruskal algorithm. Therefore, compared with the traditional optimization strategy, the advantages of the optimization method proposed in this paper are as follows.
(1) By considering the limitation of AC submarine cable and the FLC cost model, the cost of HVAC, HVDC and FFTS with different capacity and distance is calculated based on a real cost database. And the selection interval of each transmission mode is analyzed, so as to find a general economic selection reference for systems of different sizes and locations, and provide strong theoretical support for the implementation of practical projects.
(2) Since the traditional prim algorithm and Kruskal algorithm cannot be applied to the dynamic planning problem, the greedy algorithm is selected to improve the genetic algorithm to obtain the topological structure of the grid connection topology of the offshore wind farm.
The rest of this paper is organized as follows: Section 2 analyzes the technology and economy of typical gathering and transmission modes. In Section 3, considering the technical limitations of submarine cables and the reactive power compensation capability, the topology optimization model of offshore wind power collection and transmission system is proposed based on the FLC cost model. In Section 4, an improved topology optimization algorithm is proposed to solve the optimization model of offshore wind farms based on greedy algorithm. In Section 5, a general conversion proposal is proposed based on the theoretical model and actual case data. The proposed model and algorithm are used to optimize the topology of a wind farm cluster, which also verifies the accuracy and economy of the general reference scheme, which is of great significance for the design and construction of the wind farm. Finally, this paper summarizes in Section 6.
2 Typical collection and transmission system and technology comparison of offshore wind power
The collection and transmission system of offshore wind farms has different power collection structures and transmission modes for different scales and geographical locations. For small-scale offshore wind power systems, the transmission systems between wind turbines and from the wind farm to the land often realize the collection and transmission functions through simple connection. For the offshore large-scale wind power system, it is necessary to design the power collection system and the rear stage transmission system respectively, and carry out hierarchical planning and joint optimization to achieve the optimal transmission efficiency and economy at the system level.
2.1 Typical transmission modes
The transmission system of large-scale offshore wind farms generally refers to the system composed of the intermediate link from the offshore power collection and boosting platform to the onshore power grid. Its large space span and high voltage level are important characteristics of measuring the scale of the wind power system. Similar to the onshore high-voltage transmission technology, the typical transmission modes of offshore wind farms are also divided into HVAC, FFTs and HVDC.
The voltage level of the HVAC transmission system includes 110 and 220 kV (Liu et al., 2022), which is generally the same as the voltage level of boosting station. The voltage of the wind turbine can be boosted to the transmission voltage through direct boosting or secondary boosting at the turbine end or the collection station (Wang et al., 2006). Then the type of submarine cables and supporting equipment of the transmission system can be carried out with a certain voltage level. Although the HVAC system is simple in structure and mature in technology, its AC characteristics also bring certain technical limitations. Affected by the capacitance effect of submarine cables and considering the limited space for offshore construction, there is a technical limit for reactive power control and compensation of HVAC system. Moreover, AC grid connection needs to consider the fault isolation, fault traversal and fault recovery technologies between the field and grid, which has high requirements for the overall safety and stability of the system.
The core idea of the FFTs transmission system is to reduce the transmission frequency so that the entire wind farm can transmit at the frequency of 50/3 Hz (Wang et al., 2015), and improve the stability limit of the submarine cable. Different from the HVAC system, FFTs transforms the power frequency fan into a frequency dividing fan, and the booster station is correspondingly designed as a frequency dividing substation. Due to the increase of transmission limit, the AC conductor of FFTs with the same transmission capacity can choose a submarine cable with a slightly smaller cross-sectional area to save costs. However, since the frequency conversion mode based on thyristor or MMC is generally adopted in the design of onshore grid connected frequency conversion station (Sun et al., 2019), it is still necessary to consider such issues as harmonic suppression, reactive power compensation, voltage level and power scale application limit.
At present, HVDC transmission system has been widely used for long-distance and large-scale power transmission on land. The voltage level of 80, 200 or 320 kV is mainly used in offshore wind farms (Liu et al., 2022). The line commutated converter HVDC system based on high-power thyristors has been relatively mature and has decades of practical operation and operation experience. The voltage level covers ±500, ±660, ±800 and ±1100. However, due to the aggravation of harmonic pollution (Zhang et al., 2019), the commutation failure is easy to occur in the AC network (Zhu et al., 2022), which increases the cost of reactive power compensation equipment and filters, and the platform occupies a large space. Therefore, it is not applicable to the construction of offshore wind power system. VSC based flexible DC transmission technology is a new type of HVDC transmission technology. It has the advantages of strong controllability, small environmental impact, and suitable for long-distance transmission of medium and small capacity power (Sun et al., 2021). It hardly needs reactive power compensation, which has independent active and reactive bidirectional power flow control capability and is easy to realize power flow reversal. Therefore, it can make full use of the complementary characteristics of various energy resources and existing AC/DC transmission and distribution equipment to realize the reliable access of large-scale new energy power and the optimal allocation in a wide area. However, its disadvantages are large power loss, limited transmission capacity and high cost, which are suitable for the grid connection of medium and large offshore wind farms. For large-capacity wind farms, when large-capacity flexible direct transmission channel is adopted for external transmission, the distance between the farthest wind farm and the converter station may exceed the economic transmission distance of AC submarine cable, and voltage control problems such as overvoltage may easily occur. At this time, multi terminal flexible direct transmission mode can be considered to improve the operation flexibility and scalability. Therefore, in view of the reliability and economy of LLC-HVDC and VSC-HVDC, the modular multilevel converter (MMC) transmission technology based on high-power IGBT and hybrid HVDC transmission technology can realize the black start and flexible power transmission of offshore wind power without auxiliary equipment because of their high long-distance transmission efficiency (Sun et al., 2022). And provides strong technical support for the construction of all DC wind farms in the future.
2.2 Scheme of collecting and transmission system
Combined with three typical transmission modes of HVAC, FFTs and HVDC, and considering the existing engineering technology and the future development trend of large-scale offshore wind power, this paper compares three system transmission ideas from the wind turbine outlet to the onshore power grid, as shown in Table 1. The AC networking transmission mode of scheme I is relatively mature, and has been widely applied in engineering, such as North Hoyle in the UK and Gemini offshore wind farm in the Netherlands (Niu et al., 2019). However, this networking and transmission technology has certain technical limitations and is generally applicable to small-scale offshore wind farms. Scheme III is often adopted for large-scale wind farms. The technicality and economy of these two system schemes have been verified and evaluated by practical engineering. However, for the large-scale offshore wind power system in the far-reaching sea, the transmission distance of these two schemes has certain limitations. Scheme II is reformed based on scheme I, and frequency division transmission is used instead of 50 Hz to improve the limit of transmission distance, which has better economy and reliability than HVAC.
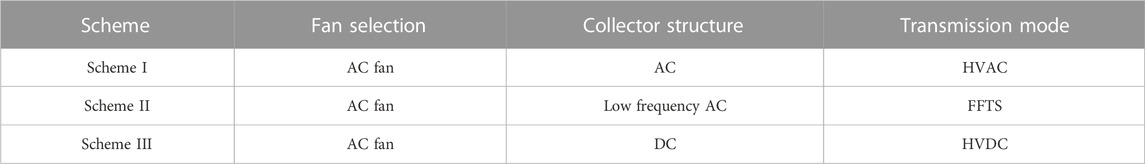
TABLE 1. System scheme.
The power collection system in scheme I adopts the idea of primary boosting and then collecting. The voltage at the outlet of the fan is about 0.69 kV. After the primary boosting, it is connected to the 35 kV internal network and then connected to the AC bus. Figure 1 shows three system schemes connected to the onshore AC power grid. Scheme I adopts relatively mature HVAC transmission mode with high reliability, whose scheme is shown in Supplementary Figure S1A. Scheme II uses frequency division transmission to increase the transmission distance on the basis of scheme I. The required circuit and equipment transformation under the frequency division transmission mode is shown in Supplementary Figure S1B. Scheme III adopts HVDC transmission mode with the scheme shown in Supplementary Figure S1C.
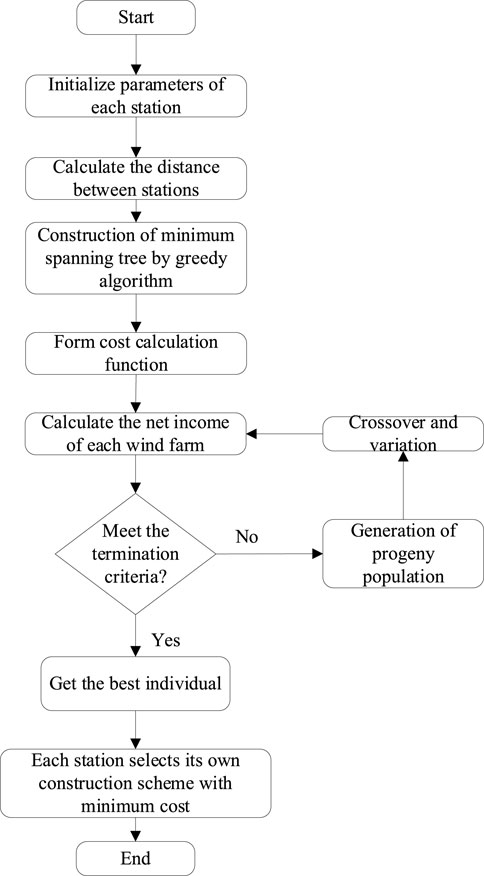
FIGURE 1. Overall flow diagram of wind farm cluster topology optimization model.
2.3 Technical analysis of transmission mode
The capacitance effect of submarine cable will cause the accumulation of charging current and charging power, and restrict the transmission capacity of the line. The technical limitation of transmission mode is mainly reflected in the limit of transmission capacity and transmission distance caused by capacitive effect (Cheng et al., 2014). Among them, the transmission capacity limit can be characterized by the thermal limit constraint of the cable, and the type selection of submarine cable and related electrical equipment can be carried out according to the limit of the conductor current. The allowable continuous conductor ampacity of AC and DC conductors can be calculated according to IEC60287 standard (Joseph et al., 2014).
where I is the conductor ampacity, θmax is the maximum allowable temperature of the conductor, θa is the ambient temperature, generally 25°C; Pd is the dielectric loss per unit length of the conductor insulating material; G1, G2, G3 and G4 are the thermal resistance between the conductor insulation layer and each medium of the armor; n is the number of cable cores, λ1 and λ2 is the loss coefficient of sheath and armor respectively; RAC is the AC resistance of the conductor (Sun, 1994) during operation, and the skin effect shall be considered during calculation.
The capacity transmission limit of the system under this transmission mode can be determined through the limit carrying capacity. In addition, the AC transmission system has a distance transmission limit. As the transmission distance increases, the cable charging power increases, and the available effective transmission capacity decreases. Therefore, the upper limit of the transmission distance of different types of submarine cables under different capacity systems is certain, which can be calculated by the distributed parameter model of the line (Huang et al., 2016). The calculation method is shown in Eq. 2.
where
2.4 Typical grid connection mode
2.4.1 Point to point topology
The point-to-point topology of the offshore wind farm connected to the grid via flexible DC transmission is shown in Supplementary Figure S2, where WF represents the offshore wind farm and VSC represents the voltage source converter. In point to point topology, a single offshore wind farm is directly connected to a single onshore substation. The number of transmission lines required by this topology is small (equal to the number of wind farms or substations), and DC circuit breakers are not required. In case of converter or line fault, the AC circuit breakers on the AC side of the corresponding line converter shall be disconnected to isolate the fault. Its advantages include simple structure, good economy, and high utilization of the line capacity. On the other hand, its disadvantage is the poor flexibility and reliability, where the power of the fault line cannot be transmitted under fault conditions.
2.4.2 Star topology
In the star topology shown in Supplementary Figure S3, each line connected to the offshore wind farm and the onshore substation is converged to the central star node. This topology requires each transmission line to be equipped with a DC circuit breaker at the near center point. In case of converter or line (except for central star node) fault, disconnect the DC circuit breaker on the corresponding line to isolate the fault. However, the overall flexibility is poor, when any line fails, the corresponding wind farm or substation will be lost. And the cost is high due to the construction of offshore platforms. Moreover, the entire network will be paralyzed when the central satellite node fails.
2.4.3 Ring topology
Supplementary Figure S4 shows the ring topology where all offshore wind farms and onshore substations are connected in a ring by lines, so that all power of the system can be transmitted by some lines when the ring is open. The ring topology of flexible DC transmission can install a DC circuit breaker and an isolation switch at both ends of each line. In case of line fault, disconnect the DC circuit breaker on the line and the nearest DC circuit breaker on the adjacent line, and disconnect the isolation switch. When the fault is isolated, reclose the DC circuit breaker on other disconnected lines. This fault isolation mode will cause the wind farms connected to the adjacent lines to exit the operation for a short time. The other way is to directly install a circuit breaker at both ends of the line. When the line fails, disconnect the DC circuit breaker at both ends of the line to make the system in open loop state. The advantages of ring topology are as follows: when a fault occurs somewhere on the ring, the system operates in an open loop by operating the circuit breaker, so that the power flow can be transmitted through other paths without passing through the fault point, which is more flexible and reliable than the other topologies. Its disadvantages include low utilization rate of line capacity, reliability on the circuit breaker, and poor economy.
3 Topology optimization model of offshore wind power collection and transmission system
The economic indicators of large-scale offshore wind power generation system mainly include the static investment cost, dynamic maintenance and loss cost, which mainly related to the transmission distance and system capacity.
3.1 Comprehensive economic evaluation
The total cost of the collection and transmission system of offshore wind farms needs to take into account the static and dynamic costs in the whole life cycle, where the one-time investment cost is converted into the dynamic cost within the total planned operation period by the equal annual value method. The total cost calculation method considering the whole life cycle of the system is shown in Eq. 3.
where Ctotalcost is the total cost of the collection and transmission system, Cinv, static and Cinv, dynamic are the static and dynamic cost in the whole life cycle, i is the discount rate and no is the planned operation period.
The annual comprehensive benefits of the system can be obtained by combining the construction cost and reliability loss of the wind farms as follows.
where Ctotal is the annual comprehensive benefit, E is the total electricity of the wind farms, Csale is the annual price of the wind power. Then the topology optimization model of wind farm cluster is established with the aim of maximizing the annual comprehensive benefit of the wind farm cluster planned by the system.
3.2 Probability distribution of new energy output
Due to the uncertainty of wind power, if the transmission lines of wind farms or wind farm clusters are configured according to the installed capacity, the transmission lines will often be lightly loaded and the asset utilization rate will be low. If the capacity of the transmission line is too low, a large amount of wind will be abandoned. It is necessary to establish an economic comprehensive optimization model to coordinate the construction capacity of the transmission line and the loss of abandoned wind.
The probability distribution of the output of the whole wind farm can be further obtained from the output distribution of a single unit. For the same wind farm, it can be approximated that the types and wind conditions of each unit are the same, while the fault conditions of each unit are relatively independent. It should be noted that poor wind conditions and fan failure will lead to zero output of the fan. Therefore, the output distribution of the whole wind farm should consider the arrangement and combination of wind turbine faults and the output distribution under each fault state.
If there are N wind turbines in one wind farm, and the forced outage rate of each turbine is r, then the probability distribution of k units in the wind farm operating normally follows a binomial distribution, and the probability is
Therefore, the probability distribution of the whole wind farm output is shown in Eq. 6, where the value at the discrete point is the probability value, and the continuous function in the middle is the probability density.
where
3.3 Static cost assessment
The static investment cost mainly includes the purchase and installation cost of the terminal fans, substation, converter station and other infrastructure, as well as the purchase and laying cost of cables in the power transmission system (Wang et al., 2020).
3.3.1 Fans cost
Permanent magnet synchronous generator (PMSG) is generally selected as a typical AC fan to calculate the purchase cost of wind turbine Cinv, wind, and its installation cost is related to the installed capacity. The installation cost includes the purchase, transmission and installation costs of the unit, blade, tower and other structures of the wind turbine. The specific calculation method is shown in Eq. 7.
where Cwind turbine is the annual price of wind turbine, whose unit is 10000 yuan/MW, and P is the installed capacity, whose unit is MW. Since the frequency is redesigned in FFTS, the frequency of the fan needs to be reset. After the transformation, the volume of the fan is increased but the structure is simplified, and the production process is relatively simple. Therefore, the installed cost under the FFTS is calculated as 94% of the cost of the typical power frequency fan (Cheng et al., 2014).
3.3.2 Cost of substation and converter station
The substation and converter station of large-scale offshore wind power system are mainly built on the offshore platform. For the AC system, the main cost of the offshore platform consists of the construction of offshore collecting station, converter station and onshore substation and converter station. The construction cost mainly includes the basic construction cost of step-up platform, substation and converter station, and the cost of transformer and converter.
For the wind farm adopting high voltage AC transmission mode, the engineering experience value calculation formula of the cost Coff,sub,ac (ten thousand yuan) of the offshore collecting station and the cost Cons,sub,ac (ten thousand yuan) of the onshore substation are respectively
where S is the rated capacity of the wind farm; BT is the basic construction cost of offshore substation of wind farm; nT is the number of substation transformers; fT is the cost coefficient with respect to the number of transformers nT; VT is the variable cost coefficient of the substation.
For wind farms adopting high voltage direct current (HVDC) transmission mode, the offshore converter station cost Coff,sub,dc and the onshore converter station cost Cons,sub,dc (ten thousand yuan) are calculated in the same way as the HVAC transmission mode, which are respectively expressed as
where nC is the number of converters. fC is a cost coefficient with respect to the number of transformers nC. VC is the variable cost coefficient of the substation.
Considering the wide variety of converters nowadays, it is considered that the cost of converter of FFTs transmission system is consistent with that of CSC-HVDC. The cost Cinv,VAR of onshore converter station is as follows
3.3.3 Cable cost
Cable cost refers to the cost of purchasing, transporting, laying and installation of cables. Larger capacity has greater demand of cable carrying ability, and even needs two or more circuits are for transmission. For the AC system, the transmission distance is limited by the reactive power limit value to be compensated, and has an upper limit of the transmission distance. Therefore, different AC and DC systems of different scales have different cable models and quantities, and their cable costs vary greatly. The calculation method of cable cost is shown in Eq. 13.
where nc is the number of cables, Ccable is the unit quotation of cables, in 10000 yuan/km, and d is the transmission distance (km).
3.3.4 Static investment cost
The static investment cost mainly includes the purchase and installation cost of the fan, substation, converter station, cable and other infrastructure, and the calculation method is shown in Eq. 14.
where Cinv, static is the total static investment cost of the system.
3.4 Reliability assessment
The dynamic cost mainly refers to the maintenance cost and loss during the fan’s faulty period after the wind power system is officially put into operation. In order to better reflect the actual operation of the wind power system, the concept of full life cycle cost is introduced in this paper, that is, the maintenance, loss, replacement and depreciation costs of the whole wind power plant are calculated within the time range of the initial construction period and the service life (International Electrotechnical Commission, 2014). This paper mainly considers the maintenance cost and loss cost of the fan system within 20 years after it is put into use, and converts the one-time investment cost into the dynamic cost within the total planned operation period by using the equal annual value method.
3.4.1 Maintenance cost
Maintenance cost mainly refers to the labor cost and material cost for maintenance and overhaul of equipment, cables and other infrastructure during the operation of the wind farm. As the infrastructure and offshore platform composition of AC system and DC system are different, the cables selected are also different, so the maintenance costs are also different. Based on the extensive experience of offshore wind power operation overhaul, the maintenance rate m (%) of the system is defined to represent and calculate the maintenance cost.
where the total static investment cost of the system is Cinv, dynamic.
3.4.2 Loss cost
Loss cost refers to the reduction of power sales income due to the efficiency loss of collection station, substation and converter station. The loss cost in the transmission system is also referred to as the operation cost, i.e., the economic loss caused by the loss of the transformer, converter and cable line during the operation and the loss of no power generation during the outage maintenance. Define the transmission loss rate of the system as λ, which is also one of the important indicators to measure the economy of power system. The loss cost of each structure of the system is calculated by
where Top represents the service life of the substation, δop is the empirical coefficient, and E is the average price. When the wind farm adopts HVAC transmission mode, the power generated by the wind farm is first injected into the collection station, and then transmitted to the onshore substation through submarine cable for grid connection. Therefore, the reduction in revenue due to the transmission efficiency loss of the offshore collection station and the onshore substation in this process is respectively expressed as
where F is defined as the power factor of the wind farm; θoffT represents the efficiency of the offshore collection station; θonsT represents the efficiency of the onshore substation; θCHVAC is the transmission efficiency of the AC submarine cable, and its calculation formula is
where
Cable loss is also a loss link that cannot be ignored in the transmission system. The high-voltage AC line of the cable can be calculated by the following formula.
Similarly, the offshore and onshore converter station equipment and DC submarine cable of HVDC transmission system also have efficiency loss, so the loss cost can be expressed as
However, for the loss cost of the FFTs transmission system, the loss cost of the offshore substation is considered to be
Typical values of transmission resistance
3.4.3 Dynamic cost
The dynamic cost mainly refers to the maintenance cost and loss, whose calculation method is shown in Eq. 29
3.5 Constraint condition
When optimizing and modeling the offshore wind power collection system, the maximum load current of the submarine cable, the maximum transmission power of the cable, and the maximum number of fans that can be (Sun et al., 2013) mounted by the cable shall be set up respectively, and the problem that the submarine cable is not allowed to be laid cross shall be considered.
3.5.1 Submarine cable transmission capacity constraint
The electric energy generated by the wind turbine is transmitted through the submarine cable. It shall be ensured that the electric energy transmitted by the submarine cable does not exceed the maximum transmission capacity of the submarine cable. The expression is as follows
where Sij represents the electric energy of the wind turbine j connected to the submarine cable i, ni represents the number of wind turbines connected to the submarine cable i, Simax represents the maximum transmission capacity of the submarine cable i, and N represents the number of submarine cables.
3.5.2 Submarine cable carrying capacity constraint
The current carrying capacity constraint of submarine cable includes two parts: single wind turbine submarine cable and pooled submarine cable. The expression is as follows
where Iij represents the current carrying capacity of the cable i connecting the fan j, Pwj represents the rated output of the fan j, Uij represents the rated voltage of the submarine cable ij, cosφj represents the power factor of the fan j, Ii represents the current carrying capacity of the cable i connected to the fan ni, and Ui represents the rated voltage of the collecting submarine cable i.
3.5.3 The submarine cable bears the number of wind turbines
Since the carrying capacity of submarine cables is limited, it can be seen from the above formula that the number of fans that can be collected by each submarine cable is limited, and the expression is as follows
where Imaxi represents the maximum current carrying capacity of the collecting cable i, cosφi represents the power factor of the collecting submarine cable i, and Pw represents the average rated output of the fan connected to the collecting submarine cable i.
3.5.4 Submarine cable crossing avoidance constraint
In the actual project, the submarine cables are not allowed to cross. Convert the longitude and latitude of the fan position into coordinates, and judge the submarine cable crossing according to the coordinate information of the fan. The expression is
where
3.5.5 Aggregate substation capacity constraints
The grid connected operation of the offshore wind farm group needs to be collected to the offshore booster station before transmission, so the capacity of the offshore booster station is not less than the capacity of each collecting cable, and the expression is as follows
where Si represents the cable capacity, Ni represents the number of cables collected to the booster station, and Sasc represents the capacity of the offshore booster station.
4 An improved topology optimization algorithm for grid connection of offshore wind farms
This section considers the coding mode and genetic operator of the characteristics of the grid topology optimization problem, and proposes an improved genetic algorithm for the topology optimization. Due to the large number of wind farms, they are mainly collected to the onshore substation through cables and collecting power stations. The physical wiring form is similar to a tree structure, which abstracts the wind farms and cables into vertices and edges respectively. Since the onshore substation is the collection point of all electric energy. Therefore, for the genetic algorithm optimization model based on the minimum spanning tree algorithm, setting the land substation as the root node of the spanning tree is conducive to simplifying the solution process and obtaining the optimal solution.
For the grid connected system, the topological structure is mainly determined by the cost of submarine cable and the construction cost of the power station. The cost of submarine cable is related to its model, the capacity of submarine cable and the power station is related to its transmission power, and the transmission power is determined by the topological structure. This forms a dynamic solution of coupling the system cost and the topological structure. Since the traditional prim algorithm and Kruskal algorithm cannot be applied to the dynamic programming problem, Therefore, greedy algorithm is selected to improve the genetic algorithm and get the topology of the grid connected topology of offshore wind farms. The N-1 constraint of minimum spanning tree should be satisfied when using greedy algorithm. However, the greedy algorithm can only obtain the local optimal solution, and the global optimal solution needs to be obtained by using the greedy algorithm under different subproblems. Therefore, the genetic algorithm is first considered to generate populations with different adjacency matrices, and the greedy algorithm is used to obtain the global optimal solution under different individual initial conditions.
In genetic algorithms, crossover and mutation are the key factors affecting genetic algorithm (GA) behavior and performance. The formula of crossover and variation rate used in this paper is as follows
where
In the topology optimization of wind farms, the objective is to minimize the construction cost and meet the corresponding constraints, so it can be considered as a 0-1 knapsack (KP) problem. The improved algorithm proposed in this section mainly aims at the following problems: the local solution ability of hybrid genetic algorithm (GA) is insufficient, and the algorithm tends to converge prematurely. The repair optimization method based on value density overemphasizes the ratio of value to weight, cannot fully cover the high-quality solution and reduces the search speed. In this paper, a hybrid greedy genetic algorithm combining local search and hybrid repair optimization operator is proposed. Firstly, a local search module is added under the standard GA framework, and a hybrid repair optimization operator based on greedy idea is used to fine and update the individual expansion solution space, and organically combine the advantages of collaborative search and local search, so as to improve the overall performance of the algorithm.
5 Case analysis
In this chapter, the economic calculation is carried out for the three schemes of offshore wind farm collection and transmission system proposed in Table 1. Combined with the current engineering practice and technical constraints, the technical economy of these three transmission modes is compared, and the selection range of transmission modes and cables in the system is determined. This chapter first calculates the cost of three system schemes under different system capacities and different distances, analyzes the selection range of each system scheme, and obtains the transmission system scheme suitable for different sizes and locations. Then, the economic distance interval of each transmission mode under the given 300 and 1400 MW systems is obtained by taking the influence of different distances on the economy and technology of the three system schemes. The cost of three system schemes under different system capacities and distances is calculated, and the selection interval of each system scheme is analyzed, so as to find a universal economic selection reference for systems with different sizes and locations. Finally, in order to verify the effectiveness of the proposed optimization model and algorithm, a large-scale offshore wind power systems is select to optimize the grid-connected transmission structure.
5.1 Analysis of output characteristics of an offshore wind farm cluster in Jiangsu
Since there are many times of no output in the actual output data of the wind farm, the probability distribution data will be concentrated around 0 when the actual probability density distribution is counted. Another form of probability distribution that reflects the output characteristics of the wind farm is to assume the probability distribution of the wind farm as a standard normal distribution, which can clearly represent the probability density distribution with the average output value of the wind farm as the central point, but this method has a large error compared with the actual output characteristics. Supplementary Figure S5 is the normal distribution probability density curve of eight wind farms.
The results in Supplementary Table S3 show that, without considering the cable type selection, the wind abandonment rate of each wind farm decreases to varying degrees with the continuous increase of the cumulative probability. At 95% of the time output, the wind farm cluster abandonment rate is 20.09%, while at 99% of the time output, the wind farm cluster abandonment rate is only 4.45%. The results in Supplementary Table S4 show that, considering the cable type selection, the wind farm cluster’s wind abandonment rate has significantly decreased at all time outputs. At 95% of the time outputs, the wind farm cluster’s wind abandonment rate has decreased from 20.09% to 9.04%, and at 99% of the time outputs, the wind farm cluster’s wind abandonment rate has decreased from 4.45% to only 0.53%. Since the losses caused by wind abandonment are far less than the installation and purchase costs of cables and other equipment, the optimization of feeder capacity based on probabilistic output has significant economy.
5.2 Economic verification of collecting and transmission system
Based on the current technical level, this paper first proposes the transmission optimization scheme as schemes I, II and II respectively, calculates the technical economy in different system capacities and transmission distances, and gives a universal offshore wind power transmission scheme optimization diagram. The sale price of the wind electricity is 450 yuan/MWh (Cheng et al., 2014), the annual power generation hours are 2000 h (Zhang et al., 2017), the discount rate I is 6% (Huang et al., 2019), and the operating life is 15 years (Huang et al., 2019).
Relevant system parameters in the calculation of total investment cost can be obtained from Table 2.

TABLE 2. System parameter.
5.2.1 Total investment cost
The calculation method of the total investment cost is to determine the system structure and equipment selection of each scheme, calculate the total static cost, and then convert this cost into the equivalent annual cost. The cost of AC fan under power frequency is 12 million yuan/MW. The voltage level, cross-sectional area, charging capacity, rated current, price and other information of power frequency transmission of each scheme are shown in Supplementary Table S5. Therefore, the selection and price reference of fans and cables of the three schemes are shown in Table 2.
In order to calculate the construction cost of substation and converter station, three system schemes can be obtained by combining the empirical formula of cost calculation in Eqs 7–29, namely, the cost of substation, converter station and frequency conversion station, reactive power compensation cost and cable cost under HVAC, FFTs and HVDC modes. The cost estimate for the transmission distance of 80 km under the capacity of 300 and 1400 MW is shown in Table 3.
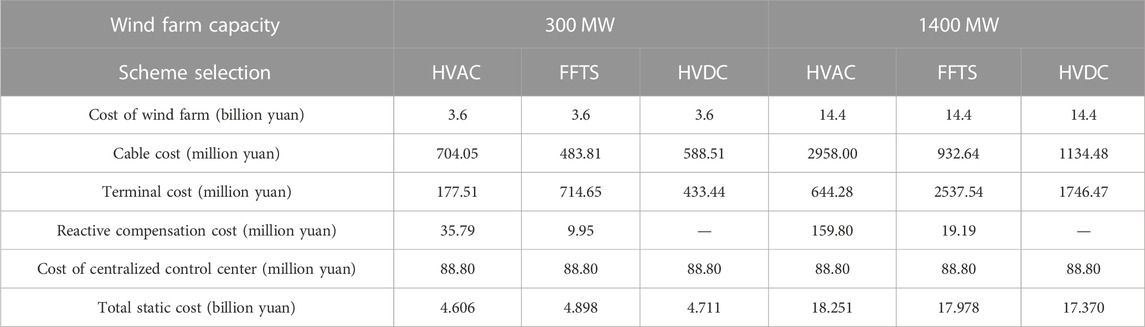
TABLE 3. Static cost analysis at 80 km transmission distance at 300MW and 1400 MW capacity.
In order to verify the correctness and reliability of the economic analysis model, the following is a comparative analysis of the cost of a domestic wind farm project budget and a foreign reference case. The analysis mainly includes cable cost, terminal cost and reactive power compensation cost. First, as shown in Table 4, the domestic 300 and 83 km AC grid connected offshore wind power examples are selected to estimate the static cost and analyze the error reasons. Then, the cost of a 1.4 GW wind farm’s three schemes are calculated to verify the effectiveness of the total cost calculation.
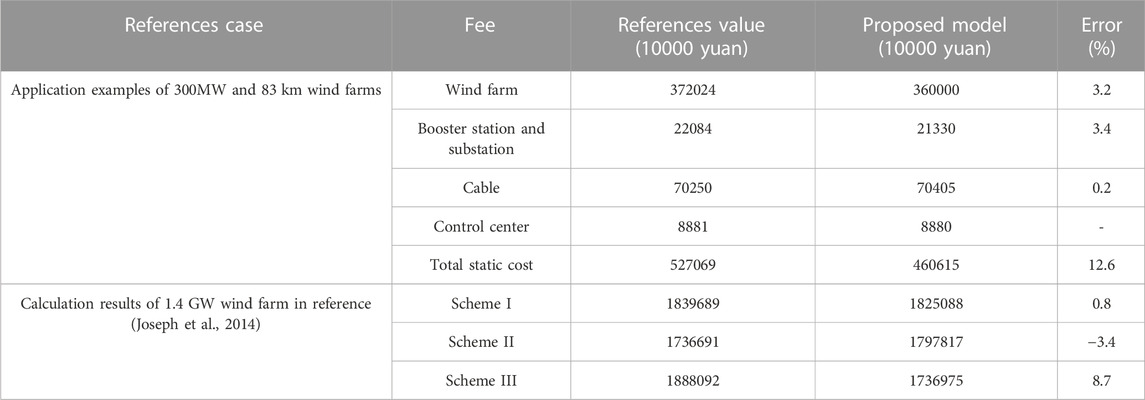
TABLE 4. Cost analysis of transmission distance of 80 km under 300MW and 1400 MW capacity.
It is found that the calculation results of the proposed model are basically consistent with the actual cost of the project. The difference of single cost of wind power plant is about 3.2%; The difference between booster station and substation works is 3.4%, and the difference between cable works is only 0.2%. All of the errors are within the range of 5%, which preliminarily verifies the validity of the calculation model in this paper. In terms of the total cost, the total difference is about 660 million yuan, and the reasons for the error can be classified into three categories. First, the calculation model in this paper does not include the auxiliary construction cost and other management costs, which is about 300 million yuan in the project example; Secondly, the empirical formula coefficient in the calculation model in this paper is affected by many factors such as equipment operation, geographical location and weather; Thirdly, because the calculation model in this paper is fuzzy and does not include detailed cost items, only a general estimation is made. Therefore, it is normal to have errors within a small error range.
According to the case of 1.4 GW wind farm, the comparison shows that the errors of scheme I and scheme II are all within 5%, and the calculation results of scheme I (HVAC system) are almost the same with the reference, which indicates that the model is more accurate when calculating HVAC and HVDC systems. However, there is a large error in the calculation model when calculating the FFTs technology of scheme III, and the difference between the two calculation results is about 370 million yuan. This is because there are no reliable application examples and reference data for FFTs technology, and all calculation methods are based on the reference data of existing HVAC and HVDC transmission systems. Another important reason is that the 400 kV cable selected in FFTs of the reference case is not economically optimal, so the calculation results of this model are slightly lower than those of the reference case. Although the model has a large error in calculating the total cost of scheme III due to objective reasons, the economic calculation model proposed in this paper is accurate in calculating scheme I and scheme II. To sum up, the validity of the calculation model in this paper is preliminarily verified.
5.2.2 Maintenance cost and loss cost
The loss rate of each structure in the offshore wind power system is shown in Table 5. The loss cost of each structure of the system can be calculated according to Eqs 15–28. The annual power generation hours of the wind farm are considered to be 2000 h. The average maintenance rate of the system is set as 1.4%. The dynamic costs of 300 and 1400 MW offshore wind farms, including maintenance costs and loss costs, are shown in Table 6.
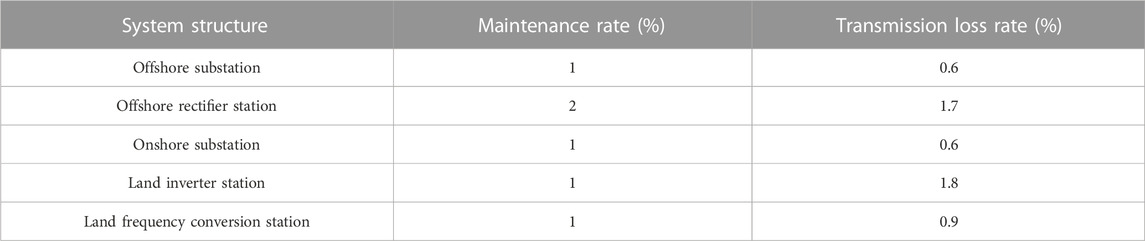
TABLE 5. Transmission loss rate of each part.
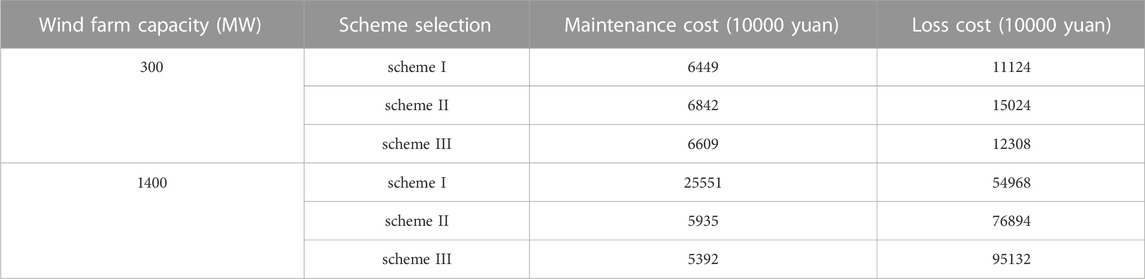
TABLE 6. Dynamic cost analysis at 80 km transmission distance at 300MW and 1400 MW capacity.
5.3 Analysis of typical case collection and transmission system
In order to obtain the costs and preferred schemes of wind farms with different capacities and distances, Figures 2, 3 successively draw the costs of wind farms and their preferred schemes under the three schemes of fixed capacity, variable distance, fixed distance and variable capacity. The cost distance curves of 300 MW wind farms and 1400 MW wind farms are respectively selected for comparison.
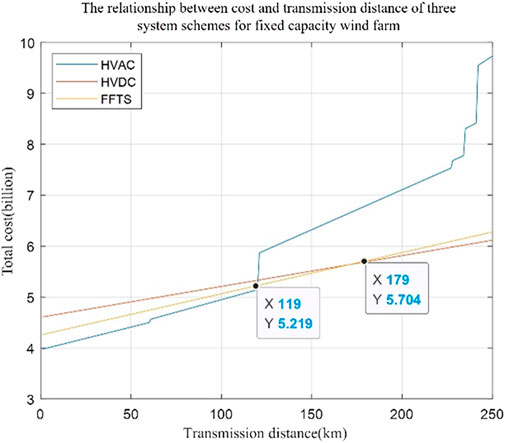
FIGURE 2. Comparison of cost distance curves of three system schemes under AC grid connection of 300 MW wind farm.
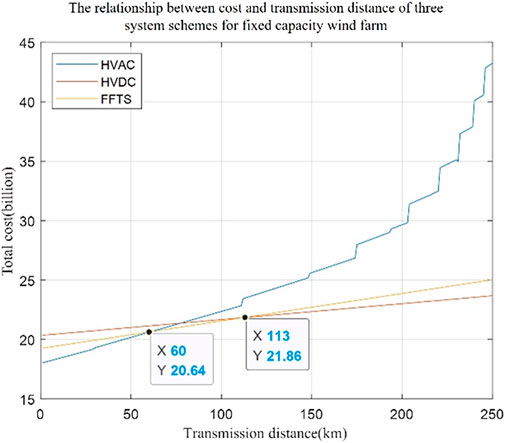
FIGURE 3. Comparison of cost distance curves of three system schemes under AC grid connection of 1400 MW wind farm.
For 300 MW wind farms with an offshore distance of less than 120 km, HVAC transmission mode has great economic advantages. However, due to the transmission distance limitation of HVAC, scheme II and scheme III show better economic advantages in 120 km and longer transmission. Therefore, under the consideration of close range planning, scheme I is used within 120 km, scheme III is used within 120–180 km and scheme II is used beyond 180 km for 300 MW wind farm, which conforms to the existing technical and economic efficiency. At the same time, it can be found that scheme III, namely, FFTs transmission mode, has economic advantages in a large range (120–180 km).
For a 1400 MW wind farm with an offshore distance of less than 60km, scheme I can be selected as the preferred scheme. Scheme III is recommended for the part exceeding 60 km. However, compared with the 300 MW wind farm, the economic advantage of the 1400 MW wind farm in HVAC transmission will be reduced, and the transmission distance advantage will be reduced by about 60 km. On the contrary, for scheme II, HVDC transmission mode has great economic advantages after 113 km.
On the other hand, in order to compare the impact of wind farm capacity on economy under the same transmission distance, the total investment cost changes of 300–1200 MW wind farms are calculated when the transmission distance is 50 and 150 km respectively, as shown in Figures 4, 5.
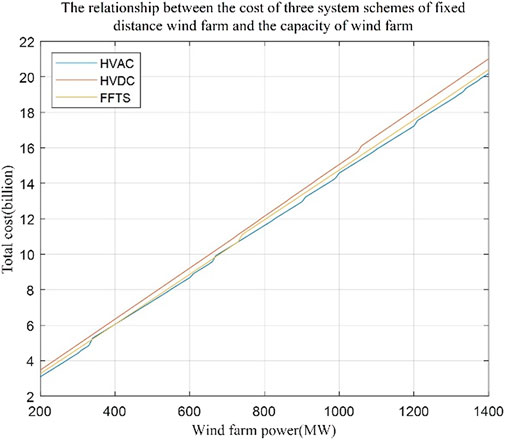
FIGURE 4. Comparison of cost transmission capacity curves of three schemes of 50 km wind farm.
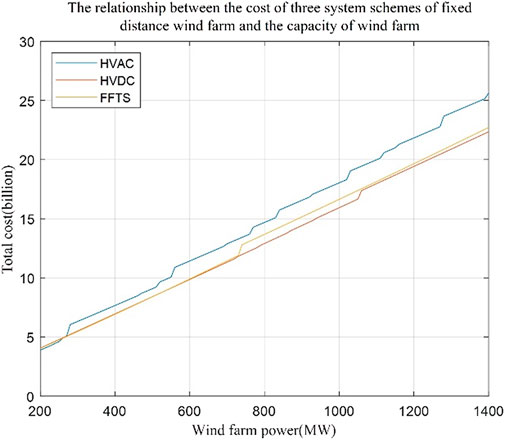
FIGURE 5. Comparison of cost transmission capacity curves of three schemes of 150 km wind farm.
It can be seen from the analysis that when the transmission distance is only 50 km, no matter how the wind farm capacity changes, scheme I has a better economy, because the transmission distance is small, and the cable cost and reactive power compensation capacity affecting the HVAC transmission mode are small. On the contrary, when offshore power transmission with transmission distance greater than 150 km is required, the cost of HVDC transmission mode is much lower than that of HVAC in terms of submarine cable, and HVDC does not need to install reactive power compensation equipment and other equipment, which greatly reduces the investment cost. In addition, due to the current technical limitations, FFTs technology has certain economic advantages only in small and medium-sized wind farms with long-distance. To sum up, HVAC and HVDC are recommended for close offshore and far-reaching sea area respectively.
5.4 A universal connection scheme recommendation
The AC networking and the transmission mode of HVAC in scheme I are relatively mature. At present, there are many practices in engineering, such as North Hoyle offshore wind farm in the UK and Gemini offshore wind farm in the Netherlands. However, this networking and transmission technology has certain technical limitations and is often used in small-scale offshore wind farms. For large-scale offshore wind farms, AC networking and HVDC in scheme II are adopted. The technology and economy of these two system schemes have been verified and evaluated in actual projects. For the large-scale offshore wind power system in the medium-reaching sea, these two schemes have certain limitations in transmission distance and economy. Scheme III is modified from the transmission mode, using frequency division transmission instead of power frequency transmission to improve the upper limit of distance limit of the system, which adapts to longer distance and has better economy and reliability compared with scheme I and scheme II, but still has the upper limit of transmission distance. Considering the technical characteristics of the proposed schemes, a universal reference is given based on the economic performance of the proposed schemes in different capacities and transmission distances.
The system capacity is 0–2000 MW and the transmission distance is 0–300 km. The scheme reference is shown in Figure 6 based on the FLC costs. For small capacity wind farms less than 300MW, the scheme of AC networking and HVAC transmission in scheme I is first adopted in the offshore 50 km area, and the preferred range of scheme II is 170 km and above. The selection of scheme 3 is uneven in the figure, which is caused by different cable types of wind farms with different capacities in the calculation program. Although there are some errors in the theoretical calculation results. However, it can be seen that when the transmission distance of medium and small capacity wind farms is between 80 and 170km, FFTs technology can be considered. The dominant transmission range of large capacity wind farms is about 50–120 km. And with the increase of wind farm capacity, the advantage range of scheme III will decrease with the increase of wind farm capacity. In general, regardless of the capacity of the wind farm, scheme I and scheme II are adopted for the offshore area less than 50 km and the offshore area greater than 170 km respectively. For other cases, the transmission scheme needs to be considered in combination with the specific capacity and distance of the wind farm, which conforms to the basic situation of engineering application. Therefore, Figure 6 has certain reference value in practical application.
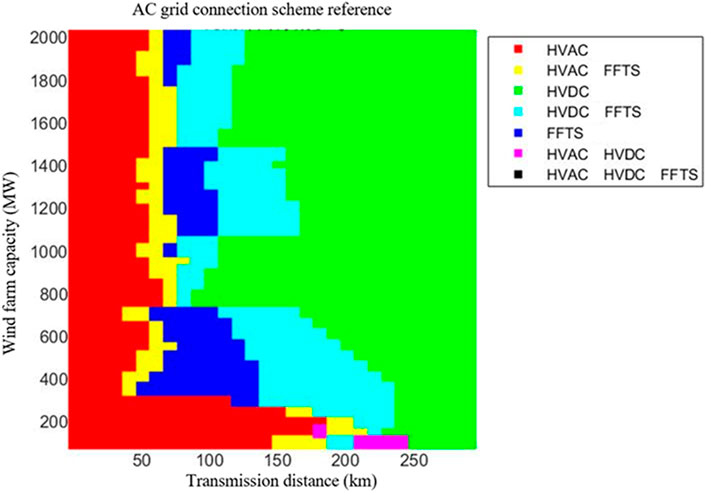
FIGURE 6. AC grid connection scheme reference.
5.5 Optimization of large-scale offshore wind power grid-connected transmission structure
11 wind farms, including W1∼W8 and 3 offshore wind farms PW9∼PW11, are selected as analysis cases. In order to facilitate the estimation of the submarine cable cost of the wind farm, take T1 substation as the origin (0,0) and establish the equivalent coordinates as shown in Supplementary Table S6.
Based on the proposed topology optimization model and improved topology optimization algorithm, the optimized topology is shown in Figure 7A and the corresponding cable plan and total cost are shown in Supplementary Tables S7, S9. In order to compare the cost and reliability of the optimized topology, 2 more schemes are proposed based on the genetic algorithm. The optimized results are separately in the star shape and circular shape with an additional collection station located in (39.5, 13), as shown in Figures 7B, C, whose main difference with the proposed topology is the transmission topology of the wind farms 9–11 in the far and deep seas. Supplementary Tables S8, S9 show the detailed cable information of scheme II and scheme III.
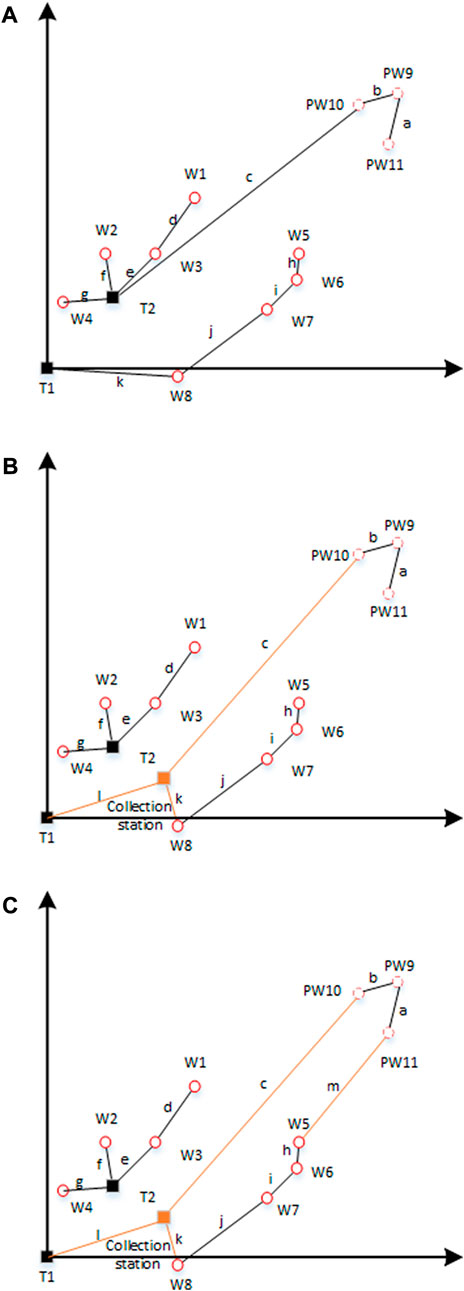
FIGURE 7. Topological diagram. (A) scheme I (point-to-point collection); (B) scheme II (star shaped collection); (C) scheme III (circular gathering topology).
According to the analysis in Table 7, since the capacity of the three schemes is the same, the cost of the fan is the same, which is 23.21 billion yuan. In scheme I, there is no separate collection station, so the cost of substation and converter station is the lowest, only 4.441 billion yuan. From Supplementary Tables S7, S9, it can be seen that the ring grid connection is adopted in scheme III and the redundant capacity of the line is high, resulting in the cost of the line as high as 36.017 billion yuan, which is 3.324 billion yuan higher than that of scheme I. To sum up, in order to ensure the economy of the grid connection scheme, it is recommended to select scheme I.
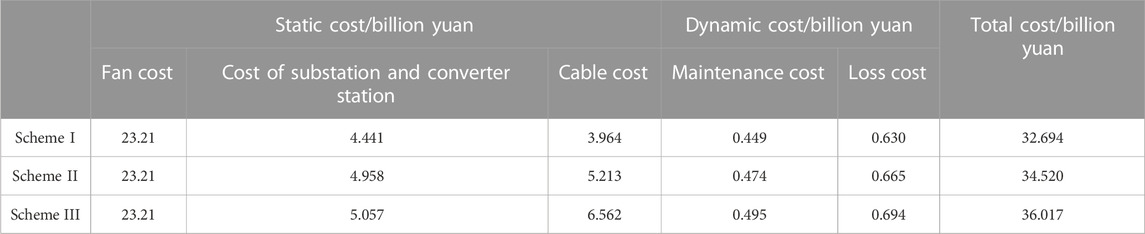
TABLE 7. Cost estimation of planning scheme.
6 Conclusion
In this paper, the technical and economical characteristics of three typical transmission modes, HVAC, HVDC, and FFTs is analyzed based on the FLC cost evaluation. Then a topology optimization is proposed based on the transmission FLC cost. Moreover, an improved topology optimization algorithm based on greedy idea is proposed to calculate the optimized topology. The specific conclusions are listed as follows.
(1) In general, regardless of the capacity of the wind farm, HVAC and HVDC are adopted for the offshore area less than 50 km and the offshore area greater than 170 km respectively.
(2) The total cost of the optimized point-to-point grid connection is reduced by 5.6% and 10.2%, respectively, compared with the star topology and the circular gathering topology, which has significant economic benefits.
The research results of this paper can provide theoretical support and reference data for the planning of large-scale offshore wind power, especially far-reaching offshore wind farms.
Data availability statement
The original contributions presented in the study are included in the article/Supplementary Material, further inquiries can be directed to the corresponding authors.
Author contributions
Investigation, project administration and funding acquisition, HL; methodology, conceptualization and writing—original draft preparation, KJ; visualization and supervision, ZL; data curation, and writing—review and editing, KJ and JH; investigation and proofreading, SX; formal analysis, WQ; software and validation, HC. All authors have read and agreed to the published version of the manuscript.
Funding
This project is supported by the Key Research and Development Project of Sichuan Province, China (22SYSX0102), Young Talent Promotion Project of the Chinese Society of Electrical Engineering (JLB-2022-97) and the State Grid Corporation Headquarters Science and Technology Project “Research on optimization method of power grid planning considering large-scale offshore wind power integration” (5100-202118003A-0-0-00).
Conflict of interest
Authors ZN, SX, WQ, and HC were employed by Institute of Economics and Technology State Grid Jiangsu Electric Power Co., Ltd.
The remaining authors declare that the research was conducted in the absence of any commercial or financial relationships that could be construed as a potential conflict of interest.
Publisher’s note
All claims expressed in this article are solely those of the authors and do not necessarily represent those of their affiliated organizations, or those of the publisher, the editors and the reviewers. Any product that may be evaluated in this article, or claim that may be made by its manufacturer, is not guaranteed or endorsed by the publisher.
Supplementary material
The Supplementary Material for this article can be found online at: https://www.frontiersin.org/articles/10.3389/fenrg.2023.1140711/full#supplementary-material
SUPPLEMENTARY TABLE S1 | The parameters of the cable and its relevant applicated maximum value.
SUPPLEMENTARY TABLE S2 | Typical 220 kV AC and ±220 kV DC submarine cable transmission resistance.
SUPPLEMENTARY TABLE S3 | Wind rejection rate under different probabilities without considering cable selection/%.
SUPPLEMENTARY TABLE S4 | Wind rejection rate under different probabilities considering cable selection/%.
SUPPLEMENTARY TABLE S5 | Cable parameters with technical limits.
SUPPLEMENTARY TABLE S6 | Location information of wind farm and substation.
SUPPLEMENTARY TABLE S7 | Planning scheme I route selection.
SUPPLEMENTARY TABLE S8 | Planning scheme II route selection.
SUPPLEMENTARY TABLE S9 | Planning scheme III route selection.
SUPPLEMENTARY FIGURE S1 | Design of convergence transmission system integrated into AC grid. (A) Scheme I system structure with AC connection (HVAC); (B) Scheme II system structure with AC connection (FFTS); (C) Scheme III system structure with DC connection (HVDC).
SUPPLEMENTARY FIGURE S2 | Point to point topology of offshore wind power grid connected via flexible DC transmission.
SUPPLEMENTARY FIGURE S3 | Star topology of offshore wind power grid connected via flexible DC transmission.
SUPPLEMENTARY FIGURE S4 | Ring topology of offshore wind power grid connected via flexible DC transmission.
SUPPLEMENTARY FIGURE S5 | Normal probability density distribution of output of each wind farm. (A) output of W1 wind farm; (B) output of W2 wind farm; (C) output of W3 wind farm; (D) output of W4 wind farm; (E) output of W5 wind farm; (F) output of W6 wind farm; (G) output of W7 wind farm; (H) output of W8 wind farm.
References
Bahirat, H. J., Mork, B. A., and Hoidalen, H. K. (2012) Comparison of wind farm topologies for offshore applications[C]. Proceedings of the IEEE Power and Energy Society General Meeting, 16-20, July-2023, Orlando, Florida, 1–8.
Che, W. (2017). Study on micro site selection and power collection system optimization of offshore wind farms[D]. Beijing: North China Electric Power University.
Cheng, B., Xu, Z., and Xuan, Y. (2014). Economic comparison of AC/DC power transmission system for submarine cables[J]. Power Constr. 35 (12), 131–136. doi:10.3969/j.issn.1000-7229.2014.12.023
Chuangpishit, S., Tabesh, A., Moradi-sharbabk, Z., and Saeedifard, M. (2014). Topology design for collector systems of offshore wind farms with pure DC power systems. IEEE Trans Industrial Electron. 61 (1), 320–328. doi:10.1109/TIE.2013.2245619
Dahmani, O., Bourguet, S., Machmoum, M., Guerin, P., Rhein, P., and Josse, L. (2015). Optimization of the connection topology of an offshore wind farm network. IEEE Syst. J. 9 (4), 1519–1528. doi:10.1109/jsyst.2014.2330064
Fu, Y., Wu, J., and Wei, S. (2013). Topology optimization and planning of power collection system of large offshore wind farms. J. Power Grid Technol. 37 (9), 2553–2558. doi:10.13335/j.1000-3673.pst.2013.09.033
Huang, L., Cao, J., and Zhang, K. (2016). Status and prospects on operation and maintenance of offshore wind turbines[J]. Proc. CSEE 36 (03), 729–738. doi:10.13334/j.0258-8013.pcsee.2016.03.017
Huang, M., Wang, X., and Liu, S. (2019). Technical and economic analysis on fractional frequency transmission system for integration of long-distance offshore wind farm[J]. Automation Electr. Power Syst. 43 (05), 167–174. doi:10.7500/AEPS20180725005
International Electrotechnical Commission (2014). Electric cables calculation of the current rating-part 1: Current rating equations(100% load factor) and calculation of losses-section 1: IEC 60827-1-1 [S/OL]. Available at: https://webstore.iec.ch/publication/1264#additionalinfo (Accessed July 30, 2021).
Jia, Y., Liu, X., and Li, H. (2014). Analysis on the influence of considering wake effect on wind farm unit layout[J]. Renew. Ener. 32 (04), 429–435. doi:10.13941/j.cnki.21-1469/tk.2014.04.010
Joseph, S. M., Maja, H. T., and Song, C. (2014). Power transfer capability of HVAC cables for subsea transmission and distribution systems[J]. IEEE Trans Industrial Appl. 50 (4), 2382–2391. doi:10.1109/TIA.2020.3003601
Li, F., Wang, L., and Qi, L. (2014). Technical and economic comparison of typical offshore wind power transmission schemes[J]. Power Grid Clean Ener. 30 (11), 140–144.
Liu, Y., Hu, S., and Li, F., 2022, Topology and control strategy analysis of offshore wind power dc-dc converter[J/OL]. Electric measurement and instrumentation: 1-7. Available at: http://kns.cnki.net/kcms/detail/23.1202.TH.20210604.1043.002.html.
Niu, D., Zhao, D., and Yang, S. (2019). Collaborative optimization model of offshore wind power and remote clean energy considering comprehensive cost in power system[J]. J. Hunan Univ. Sci. 46 (12), 16–24. doi:10.16339/j.cnki.hdxbzkb.2019.12.003
Sun, J., Zhu, M., Gao, Q., and Cai, X. (2013). Optimal design of internal topology for high power AC offshore wind farms[J]. Power Syst. Technol. 37 (07), 1978–1982. doi:10.16339/j.cnki.hdxbzkb.2019.12.003
Sun, P., Felipe, A., and Wickramasinghe, R. H., (2019) Benchmark models for HVDC systems and DC-grid studies[C]. 9th International Conference on Power and Energy Systems (ICPES), Tokyo, Japan, 1–6.
Sun, P., Wickramasinghe, R. H., and Konstantinou, G. (2022). Hybrid multiterminal HVDC system based on line-commutated and alternate arm converters. IEEE Trans Power Deliv. 37 (2), 993–1003. doi:10.1109/tpwrd.2021.3075303
Sun, Q. (1994). Power system analysis[M]. Beijing, China: People’s Post and Telecommunications Press. 201212.263
Sun, R., Liang, J., and Wang, K. (2021). Overview of offshore wind power collection system[J]. Electr. Power Constr. 42 (06), 105–115.
Tan, R. (2013). Optimization design of power collection system of offshore wind farm[D]. Guangzhou: South China University of technology.
Wang, X., Cao, C., and Zhou, Z. (2006). Experimental on fractional frequency transmission system[J]. IEEE Trans Power Syst. 21 (1), 372–377. doi:10.1109/TPWRS.2005.860923
Wang, X., Liu, S., and Song, Z. (2015). Technical and economic analysis of frequency division offshore wind power system[J]. Power Syst. autom. 39 (3), 43–50. doi:10.7500/AEPS20140121007
Wang, X., Wang, H., and Wang, W. (2020). Research on power transmission mode of large-scale offshore wind farms[J]. Electr. Meas. Instrum. 57 (22), 55–62. doi:10.19753/j.issn1001-1390.2020.22.008
Wang, X., and Wang, X. (1996). Feasibility study of fractional frequency transmission system[J]. IEEE Trans Power Syst. 11 (2), 962–967.
Wu, Y. (2020). Research on the optimization method of power collection lines of offshore wind farms based on hybrid Ecological Symbiosis algorithm[D]. Beijing: North China Electric Power University.
Zeng, D., Yao, J., and Yang, S. (2011). Economic comparison of different voltage levels of flexible DC transmission[J]. Power Syst. Autom. 35 (20), 98–102. (in Chinese).
Zhang, K., Zhang, Z., and Wang, J. (2019). Selection of power transmission system for offshore. wind farms 2019, 56–60+55. (in Chinese).
Zhang, Z., Guo, J., and Zhu, H. (2017). Optimization analysis of offshore wind power grid connection scheme based on full life cycle cost[J]. Power Syst. Prot. control 45 (21), 51–57. doi:10.7667/PSPC161819
Keywords: offshore wind power, DC topology, collecting and conveying system, full life cycle investment calculation, improved topology optimization algorithm
Citation: Li H, Jiang K, Lu Z, Hou J, Xu S, Qi W and Cai H (2023) Optimization of the offshore wind power grid-connected structure based on an improved genetic algorithm. Front. Energy Res. 11:1140711. doi: 10.3389/fenrg.2023.1140711
Received: 09 January 2023; Accepted: 06 March 2023;
Published: 22 March 2023.
Edited by:
Radu Saulescu, Transilvania University of Brașov, RomaniaReviewed by:
Rui Wang, Northeastern University, ChinaMingfei Ban, Northeast Forestry University, China
Copyright © 2023 Li, Jiang, Lu, Hou, Xu, Qi and Cai. This is an open-access article distributed under the terms of the Creative Commons Attribution License (CC BY). The use, distribution or reproduction in other forums is permitted, provided the original author(s) and the copyright owner(s) are credited and that the original publication in this journal is cited, in accordance with accepted academic practice. No use, distribution or reproduction is permitted which does not comply with these terms.
*Correspondence: Keteng Jiang, amlhbmdrZXRlbmdAdHNpbmdodWEtZWlyaS5vcmc=; Zongxiang Lu, bHV6b25neGlhbmc5OEB0c2luZ2h1YS5lZHUuY24=