- 1Key Laboratory of Electronic Equipment Structure Design, Ministry of Education, Xidian University, Xi’an, China
- 2Academy of Advanced Interdisciplinary Research, Xidian University, Xi’an, China
In this article, the power generation of a concentrated space solar power station (SSPS) is enhanced by current-injected total-cross-tied (TCT-CI) photovoltaic (PV) array. First, a mathematical model of the TCT-CI–connected PV array is established. Second, PV arrays with several common topologies and TCT-CI topology are simulated and analyzed using MATLAB/Simulink. At last, comparative experiments are conducted for TCT and TCT-CI–connected PV arrays under the condition of non-uniform light intensity distribution. The results of the above indicate the following: 1) TCT-CI–connected PV arrays reduce the difficulty of MPPT in concentrated SSPS, 2) TCT-CI–connected PV arrays increase the power generated in concentrated SSPS, and 3) TCT-CI–connected PV arrays are applicable for concentrated SSPS.
1 Introduction
Energy resources in the world are becoming increasingly scarce with the development of world economy and increase in population. In this scenario, new energy has received extensive attention. Solar energy has a broader application prospect because it is pollution free, is inexhaustible, and has inexhaustible characteristics. Photovoltaic (PV) arrays at the ground are affected by climatic changes, day and night, geographical environment, and other factors, resulting in reduced power generation. In order to solve the disadvantages of PV power generation at ground level, researchers are beginning to focus on power generation from space—the space solar power station (SSPS) (Xja et al., 2021).
At present, researchers have proposed a variety of conceptual schemes of SSPS. These schemes can be divided into two types according to the form of sunlight collection by SSPS. The first type is the non-concentrated type, that is, sunlight directly shines on the photovoltaic array. This type includes the 1979 SPS Reference Concept, the “SunTower” SPS system (Mankins, 2002), Tethered-SPS (Sasaki et al., 2007), and such others. The second type is the concentrated type (Jin et al., 2016); due to the high cost of PV cells, researchers have proposed the concentrated type to reduce the area of the PV arrays. In the concentrated-type SSPS, sunlight shines on the photovoltaic array after the concentrator. This type includes SPS-ALPHA (MANKINS, 2013), integrated symmetrical concentrated architecture (ISC) (Jin and Huang, 2018), and SSPS-OMEGA (Fan et al., 2020).
Due to the structural characteristics and manufacturing errors of the concentrated SSPS, the light intensity distribution on the solar receiver is not uniform. The non-uniform light intensity distribution can cause mismatch losses, reduce power generation, cause hot spot problems, and even cause damage to the PV array (Alanazi et al., 2022). Uneven light intensity distribution reduces the performance of PV arrays, which affects the power generation of SSPS. Now, we have to find a method suitable for SSPS to improve the performance of photovoltaic arrays under non-uniform light intensity distribution.
To reduce the impact of non-uniform light intensity distribution on PV arrays, many methods have been proposed.
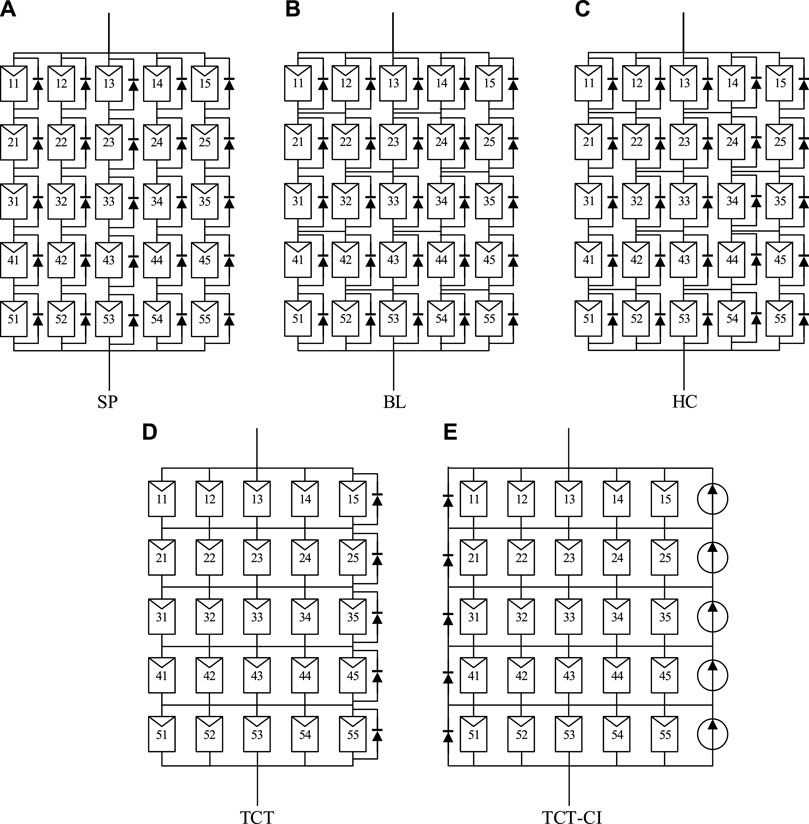
The first method uses a different PV array topology. Instead of the traditional series–parallel (SP) configuration, new structures such as BL, HC, and TCT are adopted. In Jazayeri et al. (2014), under the SP, BL, and TCT configurations, PSCs were simulated using MATLAB/Simulink. In ElyaqoutiIzbaimBouhouch (2021), the electrical behavior of S, parallel (P), SP, TCT, BL, and HC connected PV arrays under different PSCs. The aforementioned literature shows that TCT PV array performs the best among several common configurations under non-uniform irradiation.
The second method is PV array reconfiguration (PVAR), which is based on the TCT topology (Qi, 2022). This method can be divided into two types, namely, static PVAR (SPVAR) and dynamic PVAR (DPVAR) (Krishna and Moger, 2018; Storey et al., 2014). DPVAR changes the electrical connection between PV modules to adapt to non-uniform light intensity distribution (Bularka and Gontean, 2017; Wang et al., 2012; Matam and Barry, 2018), whereas SPVAR changes the physical position of PV panels to create a uniform light intensity distribution (RaniIlango and Nagamani, 2013; Sahu and Nayak, 2016).
SPVAR requires rearranging the positions of the PV panels, which consumes a large number of transmission wires. DPVAR does not change the physical positions of the PV panels but relies on the switch matrix to change the electrical connection relationship until the optimal connection mode is found (NahidanNiroomand and Dehkordi, 2021).
In the concentrated SSPS, the physical position of the PV modules is fixed. Therefore, SPVAR cannot be applied here. Because DPVAR makes the system more expensive and complex (Belhachat and Larbes, 2021), this method is also unsuitable for concentrated SSPS.
In order to maximize the power generated, the maximum power point tracking (MPPT) method is required. The non-uniform light intensity distribution causes multiple peaks in the power–voltage (PV) curve of the PV array (Ahmad et al., 2017; Awan et al., 2022). Conventional MPPT algorithms, such as P&O (Salameh and Taylor, 1990; SantosAntunes et al., 2006) and conductance increment method (INC) (ElgendyZahawi and Atkinson, 2013; Liu et al., 2008), can usually only find the first peak close to the starting point of the PV curve. When light intensity distribution is non-uniform, it is possible that the first peak is the local MPP but not global MPP (GMPP) (Titri et al., 2017). To make the MPPT algorithm more accurate, smarter but complex MPPT control algorithms have been proposed, such as the gray wolf algorithm improved by the Levy flight (WangCai and Zeng, 2021), ant colony algorithm (ACO) (Chao and Rizal, 2021), hybrid global MPPT searching method (Rizzo and Giacomo, 2021), and genetic algorithm (GA) (Mohammad et al., 2015). Although the GMPP can be tracked using the aforementioned algorithm, this increases the difficulty and time of MPPT.
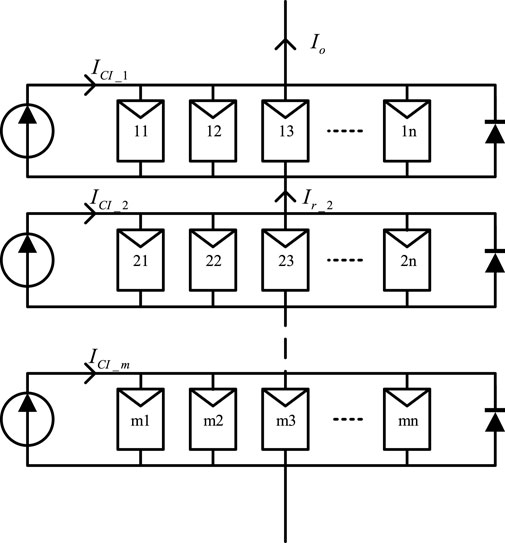
To increase the output power of PV arrays in concentrated SSPS and reduce the difficulty of MPPT, the current injection TCT (TCT-CI) topology has been applied in this study. In the TCT-CI–connected PV array, each row is parallel with a controllable current source. Without considering the effect of light intensity from the PV module output voltage, each PV module can be operated at its GMPP.
In this article, Section 2 performs mathematical modeling on the PV cell and TCT-CI–connected PV array. Section 3 describes the evaluation method of PV array performance. Section 4 discusses and compares simulation results of the TCT-CI–connected PV array and other PV array configurations. In Section 5, comparative experiments are conducted for TCT and TCT-CI–connected PV arrays. Finally, Section 6 summarizes this whole article.
2 Mathematical modeling
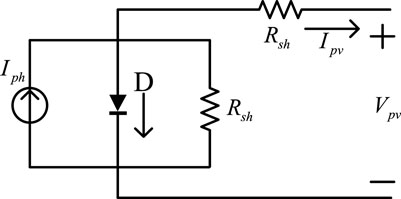
PV arrays are connected by many PV cells. Commonly used PV cell models are single-diode models (Hasan and Parida, 2016).
As shown in Figure 1, the relationship between
where Iph is the light generated current;
where
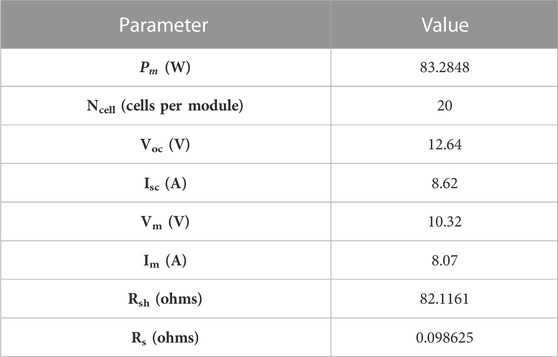
Parameters of the PV model used in Section 3/Simulink are shown in Table 1 and the PV curves are shown in Figure 2.
According to the
When the temperature is constant,
In the TCT-CI topology, the output current in row
and the output voltage in row
When the photoelectric effect of the PV modules in row
Under the action of controllable current sources, the output current of the array (
and the output voltage (
The output current of the controllable current source in row
The total output power of
The output power of the array is
In practical applications,
According to Eqs 8–10, when the PV array has a TCT-CI topology, the working current of each row is the current at the GMPP, and there is no mismatch loss.
3 Evaluation of the PV array
When the irradiation is not uniform, the performance of the PV array can be evaluated from GMPP, mismatch power loss (MPL), power loss (PL), filling factor (FF), and efficiency (
3.1 Mismatch power loss
MPL refers to the difference between the sum of the maximum power of all PV modules in the PV array and the maximum power of the PV array under non-uniform light intensity. MPL can be determined as
The larger the MPL, the greater is the influence of the output power of the PV array with non-uniform irradiation.
3.2 Power loss
PL represents the difference between the global maximum power of the PV array under STC (1,000 W/m2, AM1.5, 25°C) and that under non-uniform light intensity distribution. PL can be determined as
Because the irradiation on the PV array in concentrated SSPS is not uniform, MPL is used in this study to measure the effectiveness of various configurations.
3.3 Filling factor
The product of
The larger the FF, the higher is the output power and efficiency of the photovoltaic module. FF affects the output efficiency of the PV module.
3.4 Photoelectric conversion efficiency (
When the photovoltaic module is exposed to light, the ratio of the output electric power to incident optical power is the photovoltaic conversion efficiency (
where
4 Simulation and analysis using MATLAB/Simulink
To prove the advantage of the TCT-CI–connected PV array in concentrated SSPS, this section simulates PV arrays with several common topologies and the TCT-CI topology (Figure 4). The PV array consists of 5 × 5 PV cells. The characteristic curves of the PV modules are shown in Figure 2.
The flux density distribution of the hemisphere receiver when the concentrator is a rotating paraboloid is shown in Figure 5. When the PV array is uniformly attached to the surface of the receiver, the light intensity distribution on the same row is approximately equal but different between the rows.
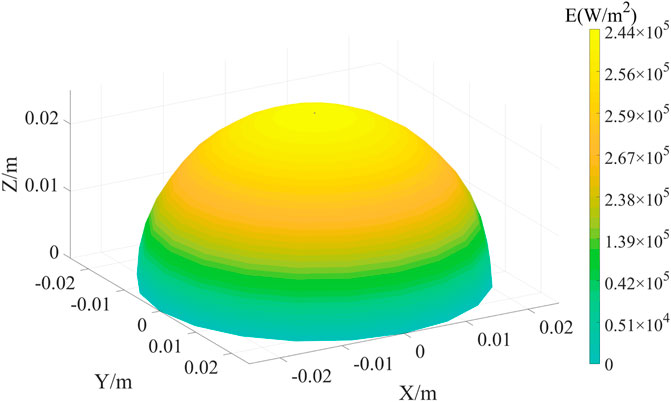
FIGURE 5. Flux density distribution of the hemisphere receiver with rotating parabolic concentrators (Liu et al., 2007).
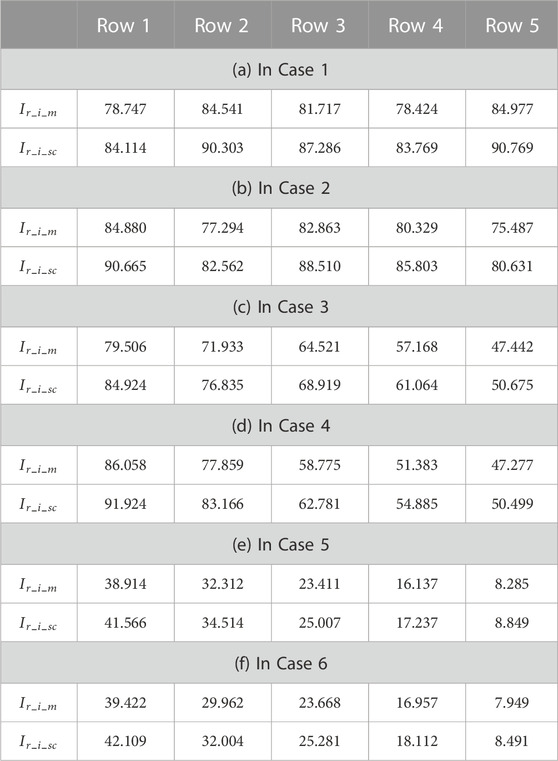
The six light intensity distributions used in the simulation are shown in Table 2, which are based on the light concentration characteristics of the abovementioned rotating parabolic concentrator. Cases 1, 2, and 3 had errors of 10%, and some others had errors of 20%. The PV array was evaluated in three ways: global maximum power (GMP), mismatch loss (MPL), and filling factor (FF).
4.1 Estimation of power generation form TCT and TCT-CI–connected PV arrays
4.1 1TCT-connected PV arrays
In the PV array, if the output current of the array (
According to Eqs 1, 2 and Figure 2, when the temperature is at the standard test condition (STC), the output current at the GMPP is almost proportional to the light intensity, and the output voltage almost does not change with the change in light intensity.
Same as the above, get row currents in the other cases, and substitute the values in Table 1 into Eqs 15, 16 to obtain
If
In Case 1 and Case 2, the difference between the
In Case 1,
In Case 2,
In Case 3,
a) If
b) If
c) If
d) If
e) If
From a) to e), the value that makes
Same as the above,
When
4.1.2TCT-CI–connected PV arrays
Because of the controlled current source of the TCT-CI–connected PV array, each PV module can operate at the GMPP.
According to Table 4, in Case 1, the global maximum power of TCT-CI–connected PV array is defined as
Same as the above,
4.2 PV arrays’ performance
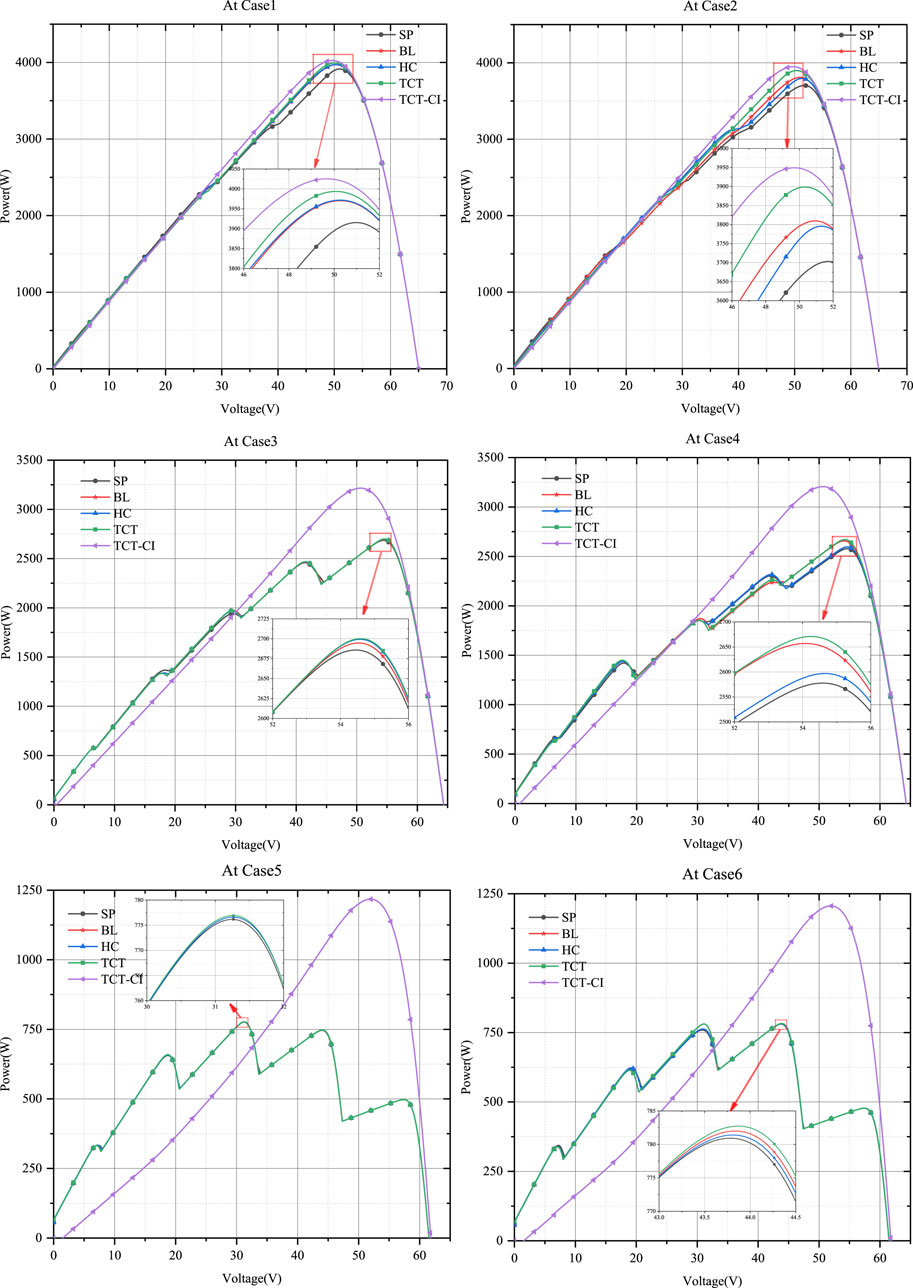
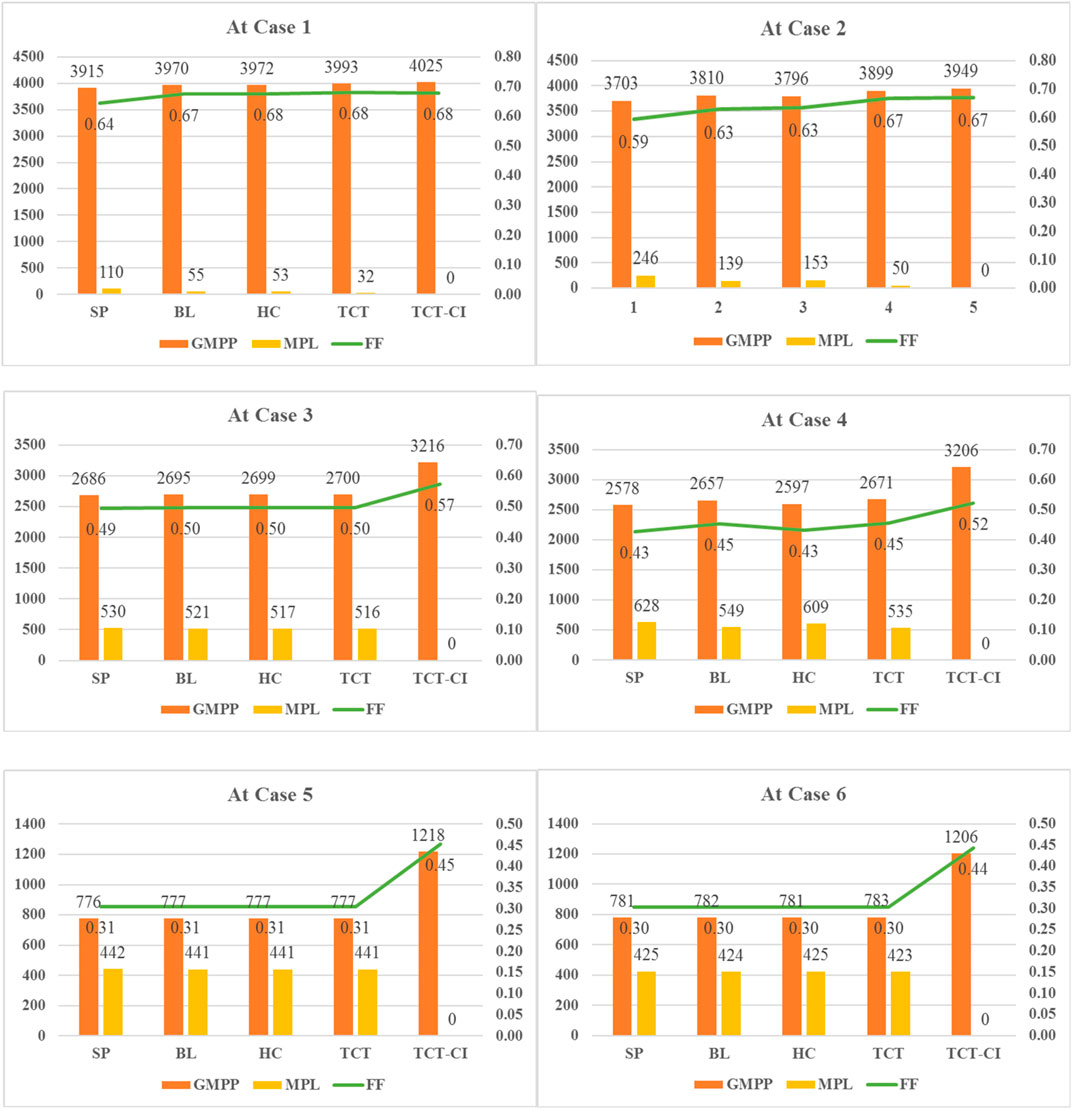
The models were simulated using MATLAB/Simulink. The PV curves under the light intensity distribution are shown in Figure 6, and the MPL and filling factor are shown in Figure 7.
In Case 5 and Case 6, the output voltage at GMPP of the TCT-CI PV array is significantly greater than that of the others, indicating that some modules of the others are short-circuited by the bypass diode. This is consistent with the estimate in Section 4.1.
As shown in Figure 6, simulation results show that TCT-CI connected PV arrays have higher output power compared to other PV arrays. PV curves of TCT-CI connected PV arrays show a single peak. So conventional MPPT algorithms can be used here. PV curves of others PV arrays show multiple peaks. Conventional MPPT algorithms cannot track to GMPP, so more complex algorithm is required. Therefore, TCT-CI connected PV arrays reduce the difficulty of MPPT under non-uniform light intensity distribution. As shown by the polyline in Figure 7, the FF of TCT-CI connected PV arrays are slightly larger than that of others, and the MPL of TCT-CI connected PV arrays is 0.
In conclusion, TCT-CI–connected PV arrays have the following advantages under non-uniform illumination intensities:
i. no mismatch loss,
ii. maximum GMPP,
iii. maximum photoelectric conversion efficiency,
iv. maximum filling factor and best performance, and
v. PV curve showing a single peak value, which reduces the difficulty of MPPT.
5 Experiment and analysis
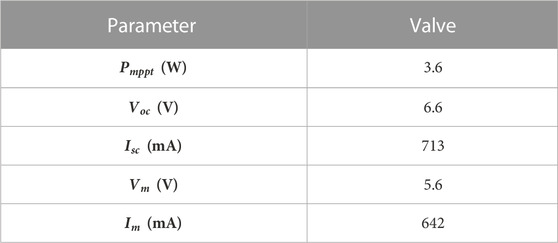
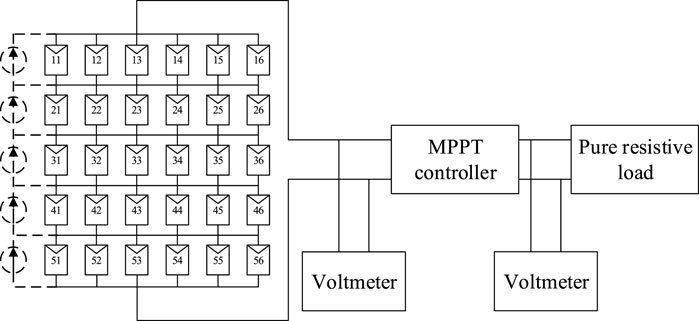
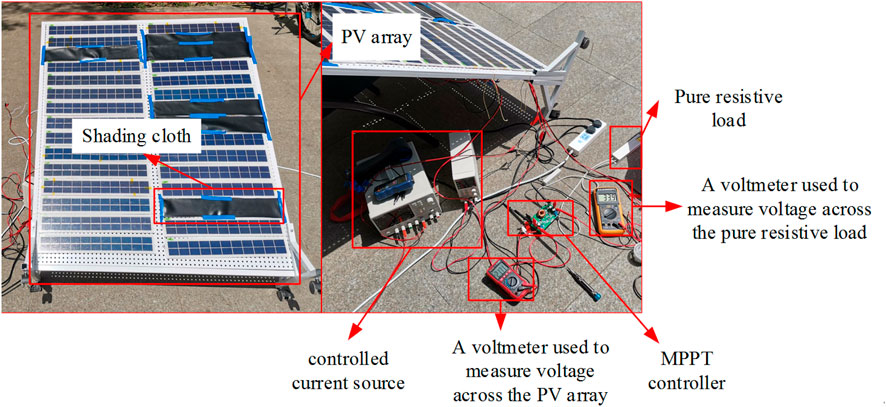
To further verify that the TCT-CI–connected PV arrays are more suitable for concentrated SSPS, a comparative experiment between the TCT-CI and TCT-CI topologies was carried out. The experimental schematic is shown in Figure 8. The real shooting is shown in Figure 9. In the experiment, 30 photovoltaic models constituting 5*6 photovoltaic arrays were analyzed. Parameters of the PV module for this experiment at STC are shown in Table 6.
In Figure 8, the dashed line represents parallel controlled current sources. When the PV array is in the TCT topology, the controllable current source is not connected to the PV module. When the PV array is in the TCT-CI topology, the controllable current source is connected to the PV module as shown in Figure 8. During the experiment, the PV array was oriented toward the sun in such a way that sunlight was perpendicular to the PV module.
A pure resistive load was used in the experiment. In the TCT topology experiment, when the line loss was not considered, with the MPPT controller, the power consumed by the load (
In the TCT-CI topology experiment, the external power supply was used as a controllable current source. Because the energy of the external power supply is an external input, to obtain the global maximum power (
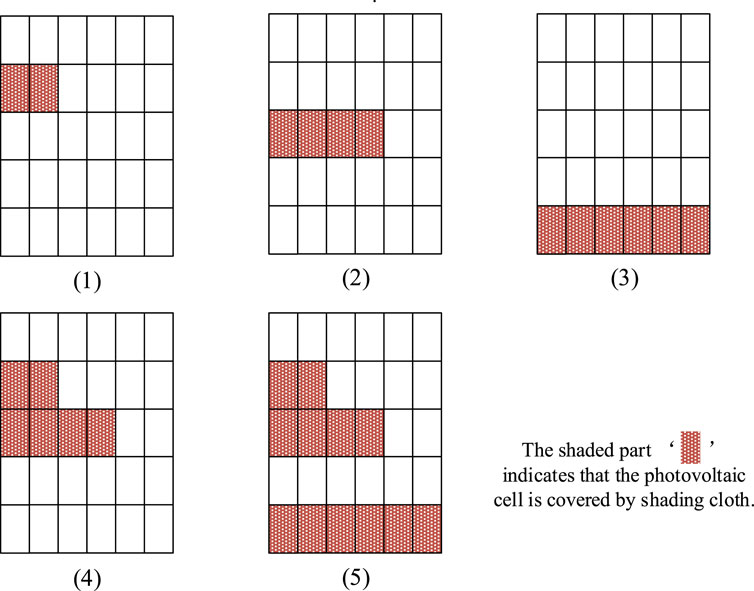
In the experiment, some photovoltaic modules were covered with a shading cloth to create a non-uniform light intensity distribution. Five groups of experiments were conducted, and the numbers and positions of the shading cloths are shown in Figure 10.
Because the basic light intensity did not change significantly during the experiment, the experimental results were not normalized;
6 Conclusion
This study shows that the TCT-CI–connected PV array is suitable for concentrated SSPS. In the future, the following research has to be carried out: the existing TCT-CI–connected PV array uses a large number of controllable current sources, therefore the number of controllable current sources can be reduced in the next step.
This study analyzes and compares the performance of SP, BL, HC, TCT, and TCT-CI–connected PV arrays under non-uniform light intensity. Several PV arrays with different topologies were simulated by considering light intensity distribution in concentrated SSPS with rotating paraboloids as an example. Finally, comparative experiments on PV arrays with TCT and TCT-CI topologies were carried out. Both simulation and experimental results show that the PV array with TCT-CI topology has the best performance, and the difficulty of MPPT is reduced in non-uniform light intensity distribution.
In other words, PV arrays with TCT-CI topology are more suitable for concentrated SSPS, which can reduce the influence of non-uniform light intensity distribution on the performance of PV arrays.
Data availability statement
The original contributions presented in the study are included in the article/Supplementary Material; further inquiries can be directed to the corresponding author.
Author contributions
Drafting the manuscript: XL, JM, and YZ; critical revision of manuscript for important intellectual content: GC, GF, DW, and YD.
Funding
This work was supported by the Civil Aerospace Technology Research Project (D010103), the National Natural Science Foundation of China (Grant No. 52022075, Grant No. U1937202), and the National Key R&D Program of China (Grant No. 2021YFB3900300).
Conflict of interest
The authors declare that the research was conducted in the absence of any commercial or financial relationships that could be construed as a potential conflict of interest.
Publisher’s note
All claims expressed in this article are solely those of the authors and do not necessarily represent those of their affiliated organizations, or those of the publisher, editors, and reviewers. Any product that may be evaluated in this article, or claim that may be made by its manufacturer, is not guaranteed or endorsed by the publisher.
References
Ahmad, R., Ali, F. M., Hadeed, A. S., Shami, U. T., and Saheed, O. (2017). An analytical approach to study partial shading effects on pv array supported by literature. Renew. Sustain. Energy Rev. 74, 721–732. doi:10.1016/j.rser.2017.02.078
Alanazi, M., Ahmed, F., Yousri, D., and Rezk, H. (2022). Optimal reconfiguration of shaded PV based system using African vultures optimization approach. Alexandria Eng. J. 61 (12), 12159–12185. doi:10.1016/j.aej.2022.06.009
Awan, M. M. A., Muhammad Yaqoob, J., Asghar, A. B., and Ejsmont, K. (2022). Performance optimization of a ten check MPPT algorithm for an off-grid solar photovoltaic system. Energies 15 (6), 2104. doi:10.3390/en15062104
Belhachat, F., and Larbes, C. (2021). Pv array reconfiguration techniques for maximum power optimization under partial shading conditions: A review. Sol. Energy 230, 558–582. doi:10.1016/j.solener.2021.09.089
Bularka, S., and Gontean, A. (2017). “Dynamic PV array reconfiguration under suboptimal conditions in hybrid solar energy harvesting systems,” in IEEE 23rd international symposium for design and Technology in electronic packaging (SIITME) (IEEE).
Chao, K. H., and Rizal, M. N. (2021). A hybrid mppt controller based on the genetic algorithm and ant colony optimization for photovoltaic systems under partially shaded conditions. Energies 14, 2902. doi:10.3390/en14102902
ElgendyZahawi, M. A. B., and Atkinson, D. J. (2013). Assessment of the incremental conductance maximum power point tracking algorithm. IEEE Trans. Sustain. Energy 4 (1), 108–117. doi:10.1109/tste.2012.2202698
ElyaqoutiIzbaimBouhouch, M. D. L. (2021). Study of the energy performance of different PV arrays configurations under partial shading. E3S Web Conf. 229 (2), 01044. doi:10.1051/e3sconf/202122901044
Fan, G., Duan, B., Zhang, Y., Ji, X., and Qian, S. (2020). Thermal control strategy of OMEGA SSPS based simultaneous shape and topology optimization of butterfly wing radiator. Int. Commun. Heat Mass Transf. 119, 104912. doi:10.1016/j.icheatmasstransfer.2020.104912
Hasan, M. A., and Parida, S. K. (2016). An overview of solar PV panel modeling based on analytical and experimental viewpoint. Renew. Sustain. Energy Rev. 60, 75–83. doi:10.1016/j.rser.2016.01.087
Jazayeri, M., Uysal, S., and Jazayeri, K. (2014). A comparative study on different photovoltaic array configurations under partial shading conditions in 2014 IEEE PES T&D Conference and Exposition (Chicago, IL, USA: IEEE), 1–5.
Jin, H., Chu, X. M., Fan, J. Y., Jin, Q. B., and Duan, Z. Z. (2016). A novel concentrator with zero-index metamaterial for space solar power station. Adv. Space Res. 59 (6), 1460–1472.
Jin, Q. B., and Huang, J. (2018). The solar-tracking optimal trajectory planning research based on minimum energy consumption in SSPS. Aerosp. Sci. Technol. 76, 272–279. doi:10.1016/j.ast.2018.01.038
Krishna, G. S., and Moger, T. (2018). “SuDoKu and optimal SuDoKu reconfiguration for TCT PV array under non-uniform irradiance condition,” in 2018 IEEE 8th Power India International Conference (PIICON) (IEEE).
Liu, F., Duan, S., Liu, B., Kang, Y., and Li, F. (2008). A variable step size inc mppt method for pv systems. IEEE Trans. Industrial Electron. 55 (7), 2622–2628. doi:10.1109/tie.2008.920550
Liu, Y., Dai, J., Lang, Z., and Xin, C. (2007). Finite-element analysis for flux distribution on focal plane of rotating parabolic concentrators. Acta Opt. Sin. 27 (10), 1775–1778.
Mankins, J. C. (2002). A technical overview of the “suntower” solar power satellite concept. Acta Astronaut. 50 (6), 369–377. doi:10.1016/s0094-5765(01)00167-9
Mankins, J. C. (2013). Sps-alpha: A novel approach to practical space solar power. Ad Astra 25 (1), 38–41.
Matam, M., and Barry, V. R. (2018). Variable size dynamic pv array for small and various dc loads. Sol. Energy 163, 581–590.
Mehta, H. K., Warke, H., Kukadiya, K., and Panchal, A. K. (2019). Accurate expressions for single-diode-model solar cell parameterization. IEEE J. PVs 9 (3), 803–810. doi:10.1109/jphotov.2019.2896264
Mohammad, S., Ahmadi, S., and Shirzad, A. (2015). A pso-based maximum power point tracking for photovoltaic systems under environmental and partially shaded conditions. Prog. Photovoltaics 23, 214. doi:10.1002/pip.2416
NahidanNiroomand, M. H. M., and Dehkordi, B. M. (2021). Power enhancement under partial shading condition using a two-step optimal pv array reconfiguration. Int. J. Photoenergy 2021, 1–19. doi:10.1155/2021/8811149
Qi, J. (2022). PV array reconfiguration according to shaded cells' number of every PV module. CSEE J. Power Energy Syst. doi:10.17775/CSEEJPES.2020.06140
RaniIlango, B. I. G. S., and Nagamani, C. (2013). Enhanced power generation from pv array under partial shading conditions by shade dispersion using su do ku configuration. IEEE Trans. Sustain. Energy 4 (3), 594–601. doi:10.1109/tste.2012.2230033
Rizzo, S. A., and Giacomo, S. (2021). A hybrid global MPPT searching method for fast variableshading conditions. J. Clean. Prod. 298. doi:10.1016/j.jclepro.2021.126775
Sahu, H. S., and Nayak, S. K. (2016). Extraction of maximum power from a pv array under nonuniform irradiation conditions. IEEE Trans. Electron Devices 63 (12), 4825–4831. doi:10.1109/ted.2016.2616580
Sai Krishna, G., and Moger, T. (2019). Improved SuDoKu reconfiguration technique for total-cross-tied PV array to enhance maximum power under partial shading conditions. Renew. Sustain. Energy Rev. 109, 333–348. doi:10.1016/j.rser.2019.04.037
Salameh, Z., and Taylor, D. (1990). Step-up maximum power point tracker for photovoltaic arrays. Sol. Energy 44 (1), 57–61. doi:10.1016/0038-092x(90)90027-a
SantosAntunes, J. L. F., Anis Chehab, C. C., and Cruz, C. (2006). A maximum power point tracker for pv systems using a high performance boost converter. Sol. Energy 80 (7), 772–778. doi:10.1016/j.solener.2005.06.014
Sasaki, S., Tanaka, K., Higuchi, K., Okuizumi, N., Kawasaki, S., Shinohara, N., et al. (2007). A new concept of solar power satellite: Tethered-SPS. Acta Astronaut. 60 (3), 153–165. doi:10.1016/j.actaastro.2006.07.010
Storey, J., Wilson Peter, R., and Bagnall, D. (2014). The optimized-string dynamic photovoltaic array. IEEE Trans. Power Electron. 29, 1768–1776. doi:10.1109/tpel.2013.2265497
Titri, S., Larbes, C., Toumi, K., and Benatchba, K. (2017). A new mppt controller based on the ant colony optimization algorithm for photovoltaic systems under partial shading conditions. Appl. Soft Comput. 58, 465–479. S1568494617302703. doi:10.1016/j.asoc.2017.05.017
Wang, Y., Xue, L., Chang, N., and Pedram, M. (2012). “Dynamic reconfiguration of photovoltaic energy harvesting system in hybrid electric vehicles,” in Proceedings of the 2012 ACM/IEEE international symposium on Low power electronics and design, 109–114. ACM. doi:10.1145/2333660.2333688
WangCai, S. W., and Zeng, L. (2021). Research on mppt based on gray wolf algorithm improved by levy flight. J. Phys. Conf. Ser. 1865 (4), 042089. doi:10.1088/1742-6596/1865/4/042089
Keywords: PV array, space solar power station, current inject, non-uniform light intensity distribution, total-cross-tied
Citation: Li X, Mi J, Zhang Y, Chen G, Fan G, Wang D and Du Y (2023) Current-injected photovoltaic array for concentrated space solar power station. Front. Energy Res. 11:1140537. doi: 10.3389/fenrg.2023.1140537
Received: 09 January 2023; Accepted: 13 February 2023;
Published: 01 March 2023.
Edited by:
Amrit Mukherjee, University of South Bohemia in České Budějovice, CzechiaReviewed by:
Daomin Min, Xi’an Jiaotong University, ChinaChen Yang, Beijing Institute of Technology, China
Copyright © 2023 Li, Mi, Zhang, Chen, Fan, Wang and Du. This is an open-access article distributed under the terms of the Creative Commons Attribution License (CC BY). The use, distribution or reproduction in other forums is permitted, provided the original author(s) and the copyright owner(s) are credited and that the original publication in this journal is cited, in accordance with accepted academic practice. No use, distribution or reproduction is permitted which does not comply with these terms.
*Correspondence: Jianwei Mi, andtaUB4aWRpYW4uZWR1LmNu
 Xintong Li
 Jianwei Mi
 Yiqun Zhang1