 Waqar Ahmed Qureshi
 Zhengdian Xu
94% of researchers rate our articles as excellent or good
Learn more about the work of our research integrity team to safeguard the quality of each article we publish.
Find out more
ORIGINAL RESEARCH article
Front. Energy Res. , 17 March 2023
Sec. Process and Energy Systems Engineering
Volume 11 - 2023 | https://doi.org/10.3389/fenrg.2023.1135543
This article is part of the Research Topic Optimal Design and Efficiency Improvement of Fluid Machinery and Systems View all 18 articles
The distribution of water deteriorates when the operating pressure of an impact sprinkler (IS) decreases to some level. The aeration jet method is utilized to form an aeration impact sprinkler (AIS), aiming to improve the uniformity of water distribution under low pressure. Based on the structures of a 20PY2 impact sprinkler, an IS and AIS with the same sprinkler discharge were studied under operating pressures range between 150 and 250 kPa. A square test zone was formed by the four sprinklers, and the combined irrigation experiment was conducted under windless conditions. The results showed that the water loss ranged from 3% to 9.5% in all 18 test schemes. The coefficient of uniformity (CU) and distribution uniformity (DU) were used to quantify the degree of uniformity. The AIS had an approximately 3%–7% greater CU than the IS, which resulted in the CU reaching the specified value in the IS standard when the sprinkler functioned under low operating pressure. A linear relationship was found between the CU and DUlq. The uniformity of water distribution clearly changed with the operating pressure (150 kPa, 200 kPa, and 250 kPa) but decreased slightly with the increase in combination spacing (1 R, 1.1 R, and 1.2 R). In addition, the results of field experiment were compared with those of the simulation developed from a single sprinkler indoor experiment based on the water distribution radial curve. The simulated coefficient of uniformity was highly consistent with the experimental data and had an error of <7%. A sprinkler water jet with the aeration method was proven to be a feasible solution to reduce the operating pressure.
Irrigation techniques have been used to increase agricultural productivity in dry regions, as well as where rainfall is the leading source for growing crops. Moreover, irrigation engineering can control the amount of irrigation applied and render a more convenient schedule (Montazar and Sadeghi, 2008). Owing to the convenience of operational function, sprinkling irrigation systems are used as part of the applications of irrigation systems throughout the world. In addition, this type of irrigation offers the precise combination of water distribution, precision control in the depth of irrigation, and high applied irrigation efficiency for various types of soil and topographical conditions (Cai et al., 2020). There are many types of rotating sprinklers used in irrigation systems based on driving principles, such as reacting force, impact, impeller and fluidic element sprinklers (Zhu et al., 2018). Irrigation sprinklers are ranked as high pressure, medium pressure, and micro-sprinklers based on their working pressure. An impact sprinkler (IS) is a type of irrigation sprinkler that is commonly and widely used for field crops, such as orchards, tea gardens, and lawns. This type of sprinkler has an advantage of ensuring a circular wetted area or sector under stable working performance over an extensive range of working pressures. The original horizontal action impact-driven sprinkler was invented by a citrus grower in Glendora, California, United States, and Orton Englehardt first introduced its patent in 1933 (Tarjuelo et al., 1999).
To date, the performance of impact sprinklers is continuously improving to address different requirements, such as precise irrigation, energy and water-saving irrigation, uniform irrigation, and sloped or hilly land sprinkler irrigation among others (Xu et al., 2018). Many researchers have improved the performance of impact sprinklers by modifying its structures, such as the secondary nozzle (Liu et al., 2011), water split needle (Zakaria et al., 2018), non-circular nozzle (Li et al., 1994; Li and Kawano, 1995) and the other auxiliary structures (Wang et al., 2019). Some research has shown that the decrease in working pressure leads to savings in energy for sprinkler irrigation (Schneider, 2000). However, decreasing the operating pressure produces two problems. The first is that the irrigation time increases under the same conditions of crop water requirement because the flow discharge of sprinkler decreases with respect to working pressure. The other problem is that the distribution of water is severely uneven when the pressure is reduced to below normal pressure (Huffman et al., 2013, 407 pp.). Less water scatters near the area of the nozzle of a stationary rotating single impact sprinkler and at the middle range, whereas too much water concentrates at the end of the jet. This means that the jet dispersal effect is not effective when the working pressure decreases to some degree. We considered a new method of jet to solve this problem. Swirl, oscillation, and pulsed jets are usually used in the industry. In this study, we focused on an aeration jet proposed by Lefebvre and Wang, 1988, who conducted the research on firefighting sprinklers. The phenomena were observed that the jet would break near the outlet of the nozzle even with a small amount of gas-induced in, and excellent water distribution would be obtained. The aeration jet was also studied in the research area of hydraulic structure discharge jet. For example, the jet atomization characteristics were changed, and the scour prevention ability was enhanced for the spillway (Deng et al., 2002). Based on the structure of impact sprinkler, an aeration impact sprinkler (AIS) was invented. It has self-suction ability, and the second fluid (air, chemical gas or liquid fertilizer) can be mixed with the main jet. The droplet diameter and suction capability of the AIS were measured by Xiang et al. (2016) and Xiang et al. (2021) who found that the peak value of water distribution radial curve and the d50 droplet diameter were reduced at the end of the jet when the sprinkler was functioning under lower pressure.
Sprinkler irrigation uniformity is an essential indicator in the design of sprinkler irrigation systems (Louie and Selker, 2000). In this study, the low-pressure irrigation of the AIS was studied and compared with the IS in terms of intensity of irrigation and distribution of water. The research objective is energy saving. Moreover, the water distribution of a combination sprinkler irrigation was simulated and compared with the experimental data. Based on a sprinkler experiment under open-air conditions conducted by Sanchez et al. (2011), a wind velocity threshold value of 0.6 ms−1 was adopted to reliably determine the radial water distribution curves. Thus, the water distribution experiment was conducted under windless conditions to ensure that the results are comparable. A normal operating pressure of 20PY2 IS specified from 250 kPa to 450 kPa for standard usages, but the range from 150 kPa to 250 kPa was utilized in this study.
Generally, an IS consists of the main nozzle and a smaller auxiliary nozzle that is used to improve the water distribution near the sprinkler. An aeration structure was designed based on a type of 20PY2 impact sprinkler. The schematics of the IS and AIS structures are shown in Figure 1. A gas suction pipe was coaxially inserted in the sprinkler spray tube, with one end of the gas suction pipe connected to a plastic hose to intake air or gas, and the other end was near the outlet of the main nozzle. The reference 20PY2 IS had a sprinkler inlet diameter of 20 mm, an auxiliary nozzle diameter of 3.5 mm, a main nozzle diameter of 7 mm, and a spray tube angle of 28°. The inlet diameter, auxiliary nozzle diameter, and angle of spray tube should maintain the same sizes for the design of AIS. The size of the gas suction pipe was selected based on the existing brass pipe, with a wall thickness of 1 mm and an inner diameter of 2 mm. The performance of the AIS and IS should be compared with the same discharge under each testing pressure. Therefore, the main nozzle diameter of the AIS was designed to be slightly larger than that of the IS because the flow passage was partially blocked by the gas suction pipe. However, it is difficult to know the precise size because the exact hydraulic loss in flow passage is unknown. The main nozzle diameter of the AIS was 8.06 mm according to the equivalent area of the IS outlet (7 mm diameter). A flow rate measurement experiment was conducted with manufactured nozzles whose diameter ranged from 8.1 mm to 8.5 mm with an increment of 0.1 mm. However, the operating pressure increased from 150 kPa to 400 kPa under the pressure increment of 50 kPa. Finally, the main nozzle diameter of the AIS was determined to be 8.3 mm at which the sprinkler flow rate met this requirement, that is to say, the annulus cross section of AIS main nozzle has the same flow rate as the IS does. The end of the gas suction pipe was set to 2 mm outside of the main nozzle since the AIS is better able to suck (Xiang et al., 2016). The sketch of the main nozzle is shown in Figure 1C, the nozzle has a contract contour line with an angle in which θ is of 45°.
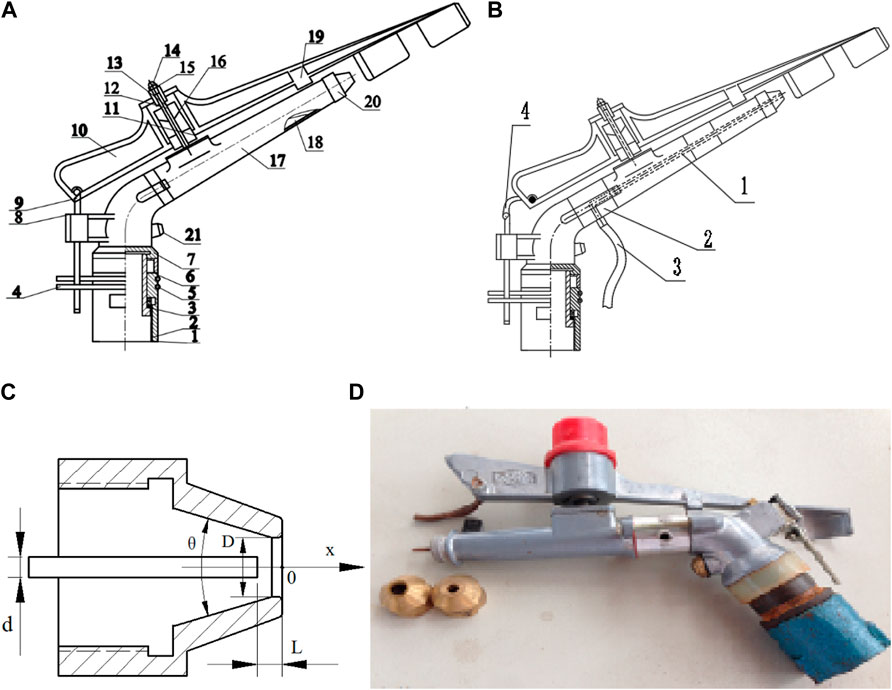
FIGURE 1. The schematics of the IS and AIS structures. (A) Schematic diagram of the IS (1 Hollow bushing, 2 hollow shaft, 3 Antifriction seal, 4 Limit ring, 5 Sand-proof spring, 6 Spring cover, 7 Base, 8 Commutator, 9 Reverse hook, 10 Rocker arm, 11 Rocker arm Bushing, 12 Spring seat, 13 Rocker shaft bushing, 14 Position screw, 15 Rocker Shaft, 16 Rocker arm Spring, 17 Spray tube, 18 stabilizer, 19. Strike block, 20 Main nozzle, and 21 Auxiliary nozzle), (B) Schematic diagram of the AIS (1 Gas suction pipe; 2 Joint; 3 Plastic hose; 4 Extension rod), and (C) Schematic diagram of the main nozzle (D, diameter of the primary nozzle; d, Diameter of the suction pipe; L, The adjusting length of the suction pipe, Ɵ Degree of nozzle curve). (D) A prototype of the Aeration sprinkler.
The driving mechanism for the rotation of AIS was the same as that of the IS. The driving force originates from the water jet impinging on the spoon of rocker arm, and the rotation effect was small when the sprinkler functioned under low pressure. Thus, the spring of the rocker arm needs to be tightened to prevent a rotating speed that is too slow. The principle of the AIS gas suction is that the pressure difference between two ends of the suction tube formed when an annular water jet passed through the main nozzle. Furthermore, the gas was taken away because of the effect of fluid viscosity. The spray of the AIS is the gas-liquid two-phase jet flow.
All experiments were performed based on the following standards: GB/T2299, 2008 and ISO 7749-2, 1990. The hydraulic performance test of the single sprinklers was performed at the Jiangsu University Sprinkler Irrigation Experiment Hall, Zhenjiang, China. The test site was an indoor facility, which avoided wind resistance for the rotation (Sourell et al., 2003). The irrigation depth was measured by the 152 catch cans that were 20 cm in diameter and 60 cm high and placed in a cylindrical shape. However, the arrangement of the catch cans was placed in eight radial lines around the sprinkler as shown in Figure 2, and each catch can was spaced 1 m along the line. In a single sprinkler test, the discharges under different operating pressures, the jet ranges (wetted radius of throw), and the sprinkler rotating speeds were measured. It took each sprinkler about 99–104 s to turn a circle when the operating pressure is 150 kPa, 86–92 s as the pressure is 200 kPa, 75–79 s when the pressure increase to 250 kPa. Four IS and four AIS prepared for outdoor experimentation were tested.
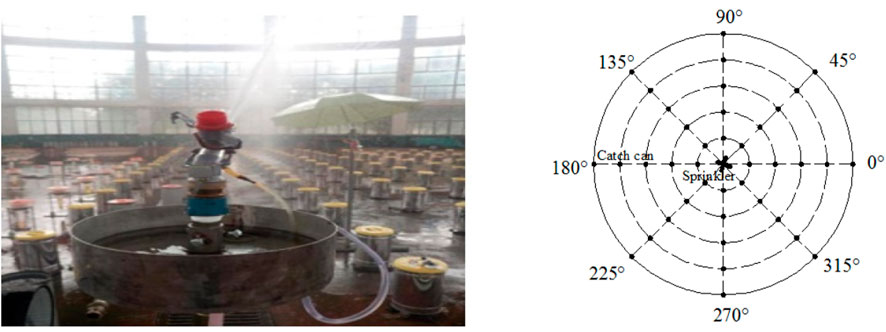
FIGURE 2. Schematic and pictorial view of sprinkler test.
The schematic diagram of the square combined irrigation simulation is shown in Figure 3. The steps to calculate the distributions of water are as follows.
(1) The test data of application rate on the eight radial lines of a single sprinkler were averaged into one water distribution radial curve by the arithmetic average method.
(2) The side length of the square was determined by multiplying the sprinkler jet range R with the combination spacing coefficient k. The grid points for each catch can had the same spacing Δx when the outdoor experiment was conducted. Where the parameter k and Δx was selected according to the scheme of research and the standards respectively.
(3) The irrigation depth of each grid point was calculated based on to the sprinkler rotating speed ωi, rpm, the distance from the corner of square Li, m, and the interpolation value on the radial water distribution curve hi, mm/h. The subscript i (1, 2, 3, 4) represents the combined sprinklers. For the grid point A, the irrigation depth ha was calculated by the following equation:
Where is the average rotating speed of four IS or AIS. Different rotating speeds are caused by an effect of the impact arm through the different twisting force of spring and different friction forces at the hollow shaft under the same values of working pressure (Figure 1A).
(4) The amount of water that fell into the square test zone must have been calculated. The water in the cell zone can be regarded as ha·(Δx)2·t, where t is the irrigation time.
(5) The average value of irrigation depth and the uniformity coefficient of water distribution must have been calculated.
(6) The grid data must be saved and can be used to show the contour map.
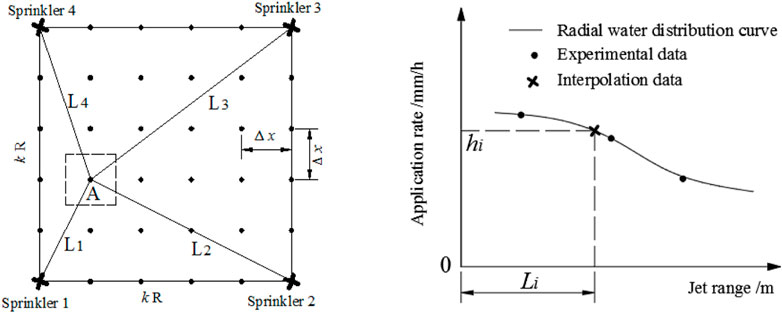
FIGURE 3. Schematic diagram of combined irrigation simulation.
The experimental test site for field sprinkler irrigation was selected at Jintan City, Jiangsu Province (31°33′ N, 119°17’ E, 15 m altitude), as shown in Figure 4. Plastic buckets with 20 cm in diameter were used as catch cans. The layout arrangement of catch cans was in the square with an area of 1.5 × 1.5 m. Four impact sprinklers, or aeration impact sprinklers, were established at the corner of the test square. During the experiment, the following parameters were recorded, including the total flow rate, operating pressure of every sprinkler, wind velocity, air temperature and humidity, and irrigation depth among others. The combined uniformity coefficient was affected by various factors, including primary sprinkler type, lateral arrangement, environmental conditions, and pressure (Branscheid and Hart, 1986; Vories et al., 1987; Playán et al., 2006). The operating pressure was controlled by the valve opening, which was installed near the inlet of the system. The side length of the square test zone was changed from 1 R, 1.1 R and 1.2 R to meet the test requirement, in which R represents the jet range of sprinkler.
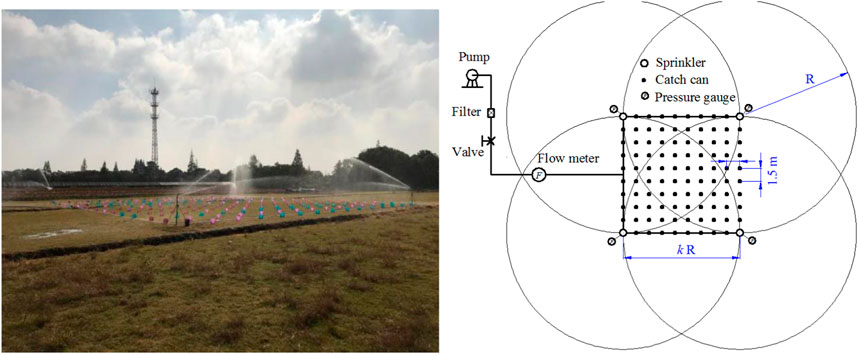
FIGURE 4. Schematic and pictorial view of sprinkler area.
At the sampling point where the catch can was placed, the collected irrigation depth was calculated using Eq. 2. The mean sprinkler irrigation depth can be defined as the average value of all the irrigation depths collected over the duration of the test.
Where
Where ThID is the water depth in the wetted square test zone, mm/h; Q is the total discharge measured by an electromagnetic flow meter, m3/h, and it was installed near the inlet of the sprinkler irrigation system. t is the experiment irrigation time, h;
The evaporation and drift losses (water loss) for the combined sprinkler irrigation were calculated using the following formula.
Where η is the water loss, including evaporation and wind drift. There are two problems in Eq. 5 that merit attention.
(1) Four solid set sprinklers tested had almost the same speed of rotation, which was confirmed by the indoor experiment.
(2) Four sprinklers had little pressure difference (hydraulic loss) caused by the pipe system. The pressure difference increased with the operating pressure. The outdoor experimental result showed that the pressure difference was no more than 12 kPa, which indicates that the discharge of four test sprinklers was almost the same. If the pressure difference was greater, the following equation was adopted to calculate the discharge of a single sprinkler (Tarjuelo et al., 1999; Stambouli et al., 2014).
Where Qs is the single sprinkler discharge, m3/h, and CD is the discharge coefficient. A is the area of the nozzle’s openings, mm2; g is the gravitational acceleration, m/s2, and p is the operating pressure of sprinkler, kPa. It can be observed from Eq. 6 that the coefficient CD can be obtained by an indoor flow rate measurement experiment, and p can be obtained by the field test.
The water distribution uniformity coefficient of the sprinkler irrigation system was calculated by the widely used Christiansen’s Uniformity coefficient (CU) (Christiansen, 1942), which are the important parameters used to determine whether an irrigation system is acceptable or not.
Where Δh =
Where DUlq and DUhq are water distribution uniformity coefficients in respect to the 25% lowest and highest parts of the data; Nlq and Nhq are a quarter of the total number catch can, and xlq and xhq are the collected irrigation depth that represents the highest part and lowest part, respectively. Similarly, Beale (1964) defined the water distribution uniformity coefficient DU by dividing the collected irrigation depth into two parts.
Where DUlh, DUhh is 50% low and the high water distribution uniformity coefficient, and Nlh, Nhh is half of the total number of the catch can.
The water distribution radial curves of the AIS and the IS were compared in Figure 5. It is apparent that when the operating pressure was increased, the jet range (wetted radius of throw) also increased. These two types of sprinklers have approximately the same jet range under the same operating pressure. The jet range is defined by the wetted boundary where the application rate is <0.25 mm/h (GB/T2299, 2008). The curves in Figure 5 were more uneven when the operating pressure was lower than the normal pressure, particularly at 150 kPa. There were three peaks on each curve that occurred near the sprinkler, at the middle jet range, and near the end of the jet range, respectively. Along with the radial direction, the three peak values were primarily caused by the strike movement of the impact sprinkler rocker arm, the auxiliary nozzle, and the main nozzle, respectively. The radial water distribution improved as the operating pressure increased, which was the reason why the range of normal operating pressure was specified in the IS standard. It can be observed from Figure 5 that the application rate of the AIS was a little lower than that of the IS near the end of jet range (the third peak value). This result showed that the jet breakup from the main nozzle differed when the aeration method was adopted. The auxiliary nozzle was designed for the original 20PY2 impact sprinkler that works under the specified pressure. With the increase in operating pressure, the peak value at the middle range tended to be reduced, as can be deduced from the 200 kPa −250 kPa in Figure 5. Moreover, some exceptional improvement is merited to render the auxiliary nozzle suitable for the AIS when the operating pressure is decreased.
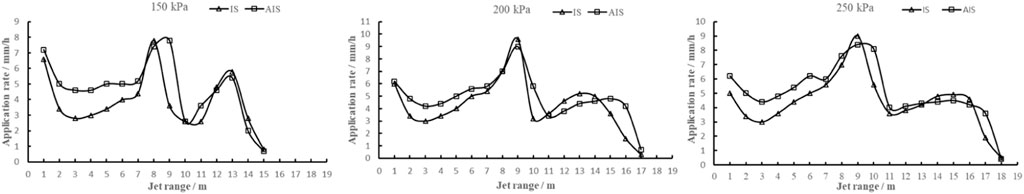
FIGURE 5. Radial water distribution curve between the AIS and the IS with different pressure. AIS, aeration impact sprinkler; IS, impact sprinkler.
The radial water distribution curve was used to simulate the sprinkler combined irrigation. It was convenient to change the parameters, such as the sprinkler interval distance or the layout forms (square, rectangular, and triangular among others) of the sprinkler in simulation method. The calculations were analyzed using a workstation that was programmed with FORTRAN, and the calculations of the water distribution were shown using TECPLOT software (Tecplot, Inc., Bellevue, WA, United States). The basic idea of simulation was to convert the discrete experiment points in Figure 5 into a continuous curve using the interpolation method, and then add the irrigation depth together at the location where the data overlapped. The researchers used simulation methods that had been previously described by Montero et al. (2001), Playán et al. (2006) and Li et al. (2015). The simulated results were compared with those of the outdoor experiment in this study.
Combined sprinkler irrigation tests were conducted in a grassy field, which had a low wind velocity. The solid set sprinkler combination effect of technical, meteorological and agronomical factors were utilized as described Sanchez et al. (2010a), Sanchez et al. (2010b). The results of water losses are presented in Table 1.
TABLE 1. Outdoor operational and metrological parameters of the solid set experiment with different pressures and lateral spacing.
As shown in Table 1, four AIS and four IS had nearly the same total flow rate under the same operating pressure, which is consistent with their experimental design. Based on Eq. 5, the water loss changed from 3% to 9.5% (Table 1). When the combination spacing coefficients became more significant, the ThID value decreased, and the TsID value also decreased, while the relationship between the CSC and the water loss was unclear. When the arithmetic means of water loss were compared, the AIS was found to have a smaller average value than that of the IS. Therefore, it can be concluded that the two types of sprinklers performed differently. Environmental parameters, such as humidity and air temperature, do not contribute much to water losses since they primarily affect water evaporation. The sprinkler water losses affected by weather factors primarily refer to the wind speed and slight differences in the speed of rotating sprinklers, which causes slightly different rainfall in the studied test zone. In the outdoor test conditions, a hand-held anemometer was used to average three measurements every 15 min. The maximum value was 1.97 m/s, and the average value was 0.9 m/s, which was owing to the breeze. Thus, the drift loss was minor. Another reason for the small loss is that the test was conducted at a lower pressure, indicating that the droplets generated by low-pressure jet breakup are vulnerable to wind resistance. The results of water loss also indicated that the open-air test data of the AIS and IS were comparable.
The spacing was set to 1R to compare the water uniformity under different pressures. The experimental data of water distribution were plotted in Figure 6, in which the x- and y-coordinates represented the side lengths of the square test zone. The difference in operating pressure led to differences in the sprinkler jet range, as well as the edge length of the test zone. The legend H represents the intensity of sprinkler irrigation. When the operating pressure increased from 150 kPa to 250 kPa, the total flow rate of the irrigation system increased, as indicated by the maximal legend value. It is apparent in the figure that the higher irrigation depth area was concentrated in the central (overlapped) region as shown in Figure 4, and the lower area of irrigation depth was distributed at the corner region near the sprinklers. Judging from the 2-D contour map in Figures 6A,B, the water distribution at the lowest test pressure of 150 kPa differed slightly from the others, so that some high irrigation depth areas occurred near the edges. The reason could be that the rotation speed of the sprinkler became slow and uneven at 150 kPa or was caused by the curve pattern of the single sprinkler radial water distribution curves as shown in Figure 5. When the water distribution of the two types of sprinklers was compared, the blue color area of the AIS was smaller than that of the IS, which indicates the lower irrigation depth was enhanced from using the aeration impact sprinkler and were verified by following uniformity coefficients.
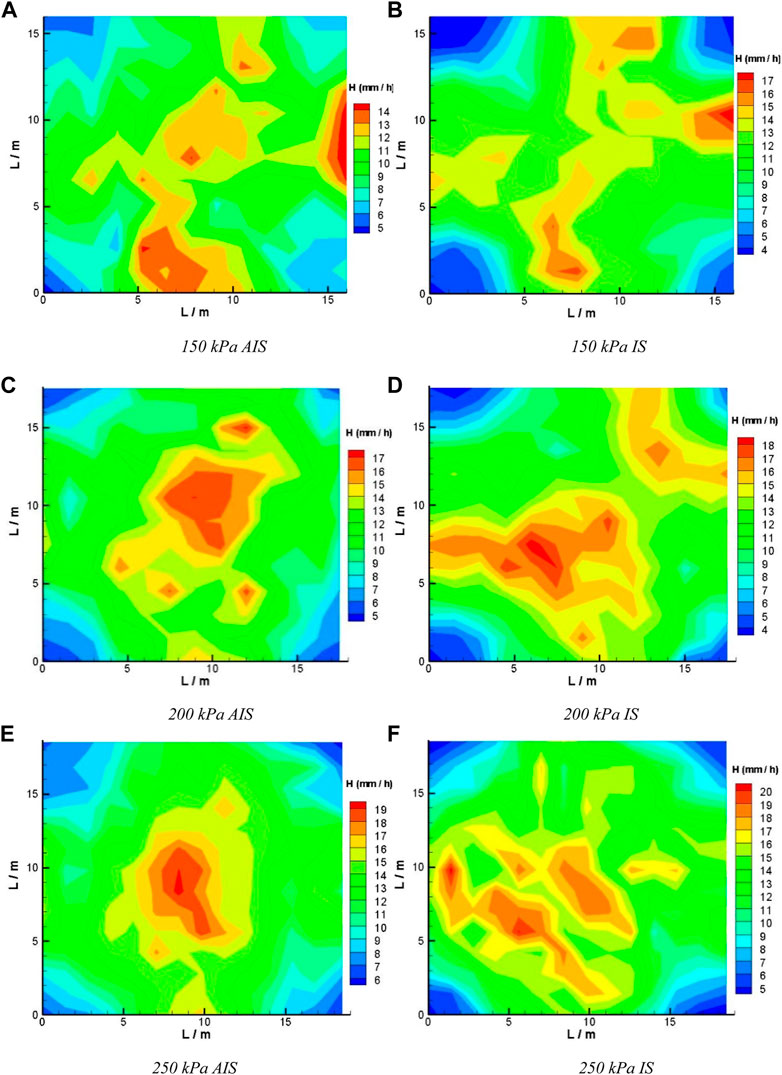
FIGURE 6. Contour map of the experimental data with 1R lateral spacing and at different operating pressures. A, C, E for the AIS at 150, 200, and 250 kPa, and B, D, and F for the IS at the same pressure. AIS, aeration impact sprinkler; IS, impact sprinkler. (A): 150 kPa AIS (B): 150 kPa IS (C): 200 kPa AIS (D): 200 kPa IS (E): 250 kPa AIS (F): 250 kPa IS.
The results of the coefficients calculated using Eqs (7–11) are shown in Table 2 to more clearly evaluate the uniformity.
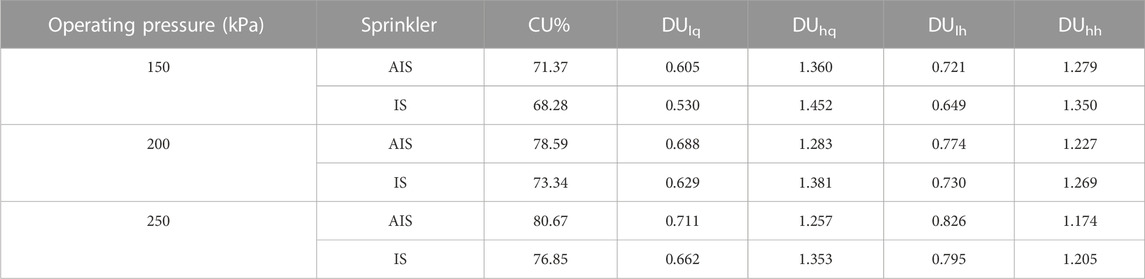
TABLE 2. Results of water uniformity coefficients with a 1R combination spacing coefficient.
Table 2 indicates that CU increased with the operating pressure for the two types of sprinklers. At the same operating pressure, the AIS had a 3.09%–5.25% larger CU value than that of the IS. Thus, this proved that the jet aeration method could improve the water distribution uniformity to some degree under the low pressure for solid set sprinkler irrigation. Since the wind velocity was low during the experiment, the operating pressures became the primary factors that affected the uniformity of the distribution of water. It is difficult to show the influence of massive deviation on water uniformity using the CU coefficient, and thus, the DU coefficient was adopted to compare the performance of combined sprinkler irrigation. As shown in Table 2, the coefficients DUlq and DUlh were <1. In addition, it could be observed that the DUlh was slightly larger than that of the DUlq. If these two coefficients are closer to 1, then the experimental data of lower irrigation depth is much less common, which indicates the uniformity of water distribution is good. Alternatively, if they are significantly >1, the results indicated that the irrigation was much less uniform. As shown in Table 2, when the operating pressure increased, the lower part of the DU coefficient also increased, and the upper part of DU decreased. This was similar to the tendency as indicated by the CU. The DU coefficients showed that the AIS was more effective than the IS. In the impact sprinkler standard (GB/T2299, 2008), the CU coefficient is specified as > 75% for the combined solid set sprinkler irrigation. When the combination spacing was 1 R in Table 2, and the operating pressure was 200 kPa, the CU coefficient of the AIS was larger than the specified value, while that of the IS was below the level. The jet aeration method can decrease approximately 50 kPa degrees of the operating pressure for the 20PY2 impact sprinkler. At 150 kPa of pressure, the CU coefficients of both the IS and AIS did not reach the specified value. Furthermore, there is still room to enhance the water uniformity at even lower pressure using the aeration method. Research by Zhang et al. (2013) shows that substantial energy savings were achieved, and the CO2 emissions were reduced as the low-pressure pipeline irrigation was adopted. Thus, it is safe to conclude that reducing the operating pressure of the sprinkler will lead to a decrease in the pressure of sprinkler irrigation system.
The operating pressure was set as 250 kPa to compare the uniformity of water distribution with different spacing. The outdoor experiment was conducted under the CSC set as 1, 1.1, and 1.2. The results of 1R are plotted in Figures 6E,F, and the results of 1.1R and 1.2R are plotted in Figure 7. It is apparent that the peak value of irrigation depth decreased when the combination spacing coefficient increased. This is consistent with the trends shown in Table 1 that indicated that the average irrigation depth decreased. With the same CSC, the peak value of the AIS was slightly lower than that of the IS, suggesting that the water distribution uniformity differed for the two types of sprinklers. The overlap zone changed when the CSC increased, so the peak value did not occur in the center area of the test zone as shown in Figure 7.
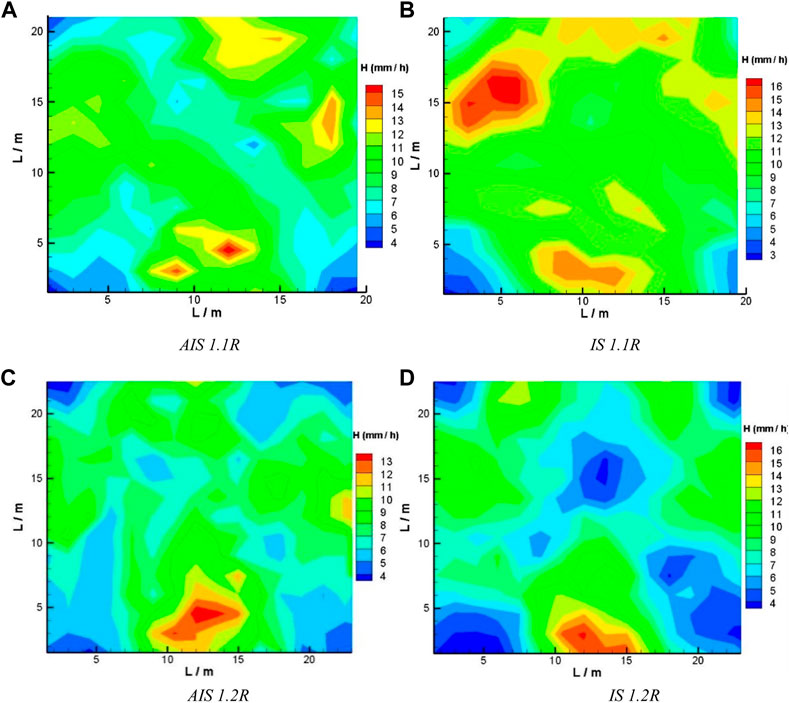
FIGURE 7. Contour map of the experimental data with an operating pressure of 250 kPa with different lateral spacing. AIS, aeration input sprinkler; IS, input sprinkler. (A): AIS 1.1R (B): IS 1.1R (C): AIS 1.2R (D): IS 1.2R.
The calculated uniformity coefficients are shown in Table 3 to evaluate the water distribution uniformity that changed with CSC.
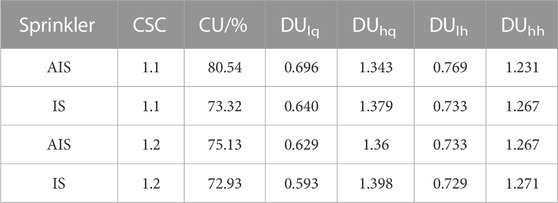
TABLE 3. Results of water uniformity coefficients with 250 kPa operating pressure.
It is apparent from Tables 2, 3 at 250 kPa operating pressure that with different CSC, the uniformity coefficients of the AIS are better than those of the IS. In particular, when the CSC was 1.1, the AIS had a CU value that was 7.22% larger than that of the IS. The purpose of increasing the lateral spacing was to find a suitable combination to optimize the irrigation performance of sprinklers. When the sprinkler was applied during the actual engineering application, the number of sprinklers could be reduced by increasing the lateral spacing, and the cost of irrigation system would be reduced under the premise that the water uniformity meets the requirement. As shown in Table 3, the CU decreased slightly with the increase in CSC, so that the 1R arrangement can obtain the best uniformity coefficients. If the requirement of the water uniformity was established as the standard value of >75% at an operating pressure of 250 kPa, the AIS can still meet the requirements when the CSC increased to 1.2, but the IS cannot meet them even at a CSC value of 1.1. The differences in sprinkler performance were shown when the CSC increased. Based on the conclusions from previous researchers, the irrigation water distribution follows the laws of a normal distribution when the CU > 70%, and the relationship between the CU and DU is approximately linear. There were 18 data samples in this study, including three levels of operating pressure, three types of CSC, and two types of sprinklers under a low wind speed. The fitting curve between DUlq and CU also shows a linear relationship as indicated in Eq. 12.
Where r2 is the correlation coefficient, and n is the sample number. The CU changed from 61% to 81% in Eq. (12), and this relationship coincided with that of Li and Kawano (1995).
To illustrate the effect of simulation, The operation condition results of Figures 6C,D were plotted in 3-D, as shown in Figure 8.
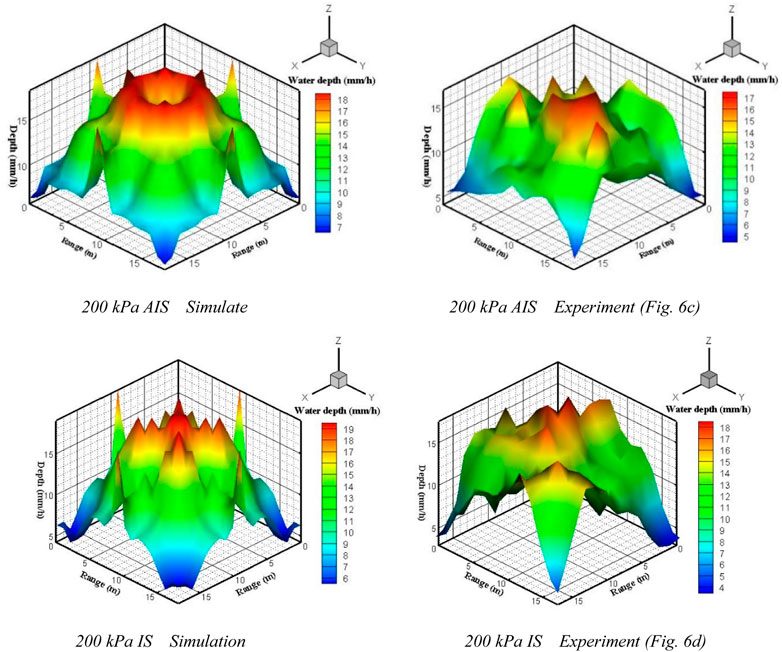
FIGURE 8. Simulated 3-D graph of the AIS and the IS and compared with experimental data. AIS, aerated impact sprinkler; IS, impact sprinkler. 200 kPa AIS Simulate 200 kPa AIS Experiment (Figure 6C) 200 kPa IS Simulation 200 kPa IS Experiment (Figure 6D).
As indicated from the graph of simulated water distribution, the peaks and valleys of the AIS and the IS occur in pairs because the radial water distribution curves in Figure 5 are similar. The simulated result of the AIS near the square center is more uniform than that of the IS. A side peak value appeared near the middle edge position of the square that is consistent with the experiment. The simulated maximal water depth is shown in the legend, which was consistent with the experimental data. The simulated water distribution graph was similar to the experimental results when the CSC was 1R. However, when the CSC increased, the simulated graph began to differ from that of the experimental water distribution.
Based on Eq. 1, the simulated collected irrigation depths were obtained. The simulated mean irrigation depth (Sim. ID) can be obtained as Eq. 3, and the simulated water uniformity coefficients can be calculated as Eqs 7–11. The results are shown in Table 4 and analyzed with the outdoor experimental data.
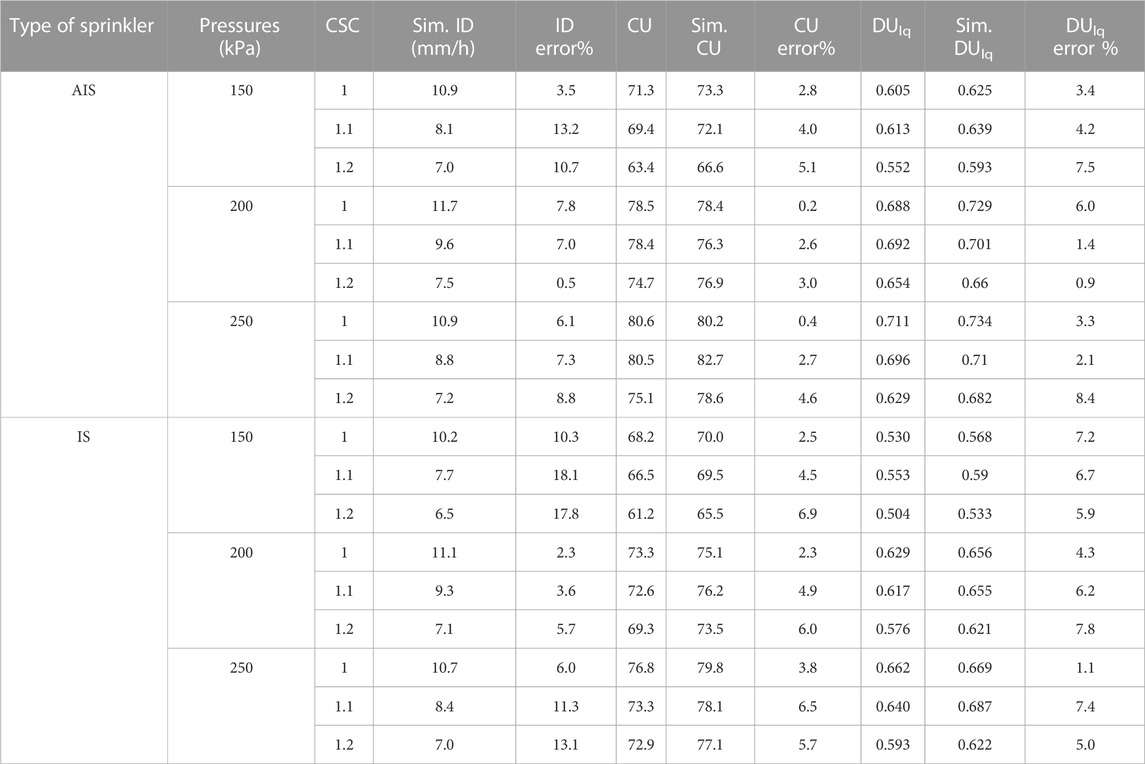
TABLE 4. The Comparison of the simulated sprinkler irrigation with the outdoor experimental results.
All the experimental results of CU are shown in Table 4, which changed from 61% to 81%. The maximal error between the simulation CU and experimental results was approximately 7%. Therefore, the error of DUlq was acceptable. Since the low wind speed had little effect on water droplets flying in the air in the outdoor experimental conditions, the sprinkler irrigation intensity in the test zone was barely influenced. Thus, the results of simulated water distribution uniformity provide a useful reference for the comparison of the AIS and the IS performances. In all the test schemes, both the experiment and simulation show that the AIS have higher values of average CU and average DUlq than the IS, proving that the aeration method could improve the water uniformity under the low operating pressure. The results of simulated water distribution uniformity were primarily affected by the pattern of the radial water distribution curve in the combined sprinkler irrigation. The results of these simulations could be useful for the optimal design of the sprinkler and for determining the optimal combination parameters, such as layout or lateral spacing.
In Table 4, the simulation results of the mean irrigation depth deviated far from the theoretical ThID that was listed in Table 1. That indicates that there is high error between the total calculations of the amount of water that fell in the test zone and the water measured by the electromagnetic flow meter. This error could be caused by the sprinkler step rotation speed, by the fitted curves of radial water distribution and by the meteorological parameters.
In this study, the structure of an aeration impact sprinkler is introduced, which functions as a liquid-gas two-phase jet spray. The performance of 20PY2 impact sprinkler and the aerated sprinkler were compared by a combination of sprinkler irrigation experiments conducted under low operating pressures. The outdoor experiment was conducted on a flat lawn and under breezy environmental conditions. The water distribution was simulated based on indoor experiment results of the single sprinkler. Operating pressure and combination spacing were found to be the primary factors that affect the irrigation performance. The main conclusions are presented as follows.
1) The water loss measured from the two types of sprinklers ranged from 3% to 9.5%, which means that the open-air test data of the AIS and the IS are comparable. Thus, only a small influence was generated by the environmental conditions.
2) The water distribution uniformity coefficient of the AIS is higher than that of the IS under lower operating pressure. The coefficient of CU improved by approximately 3%–7% in all 18 test schemes, and the DUlq was approximately 0.5 using the AIS. There is a linear relationship between CU and the DUlq.
3) The simulation method developed in this study is reliable at predicting the water uniformity but is difficult to predict the water loss. Moreover, the simulation work is useful for studying the flexible pattern of the radial water distribution curve.
4) A sprinkler water jet with the aeration method was proven to be a feasible solution to decrease the sprinkler operational pressure owing to the improvement in water uniformity coefficient. In addition, it met the requirements for the specified value in standard as the AIS functions at low pressure.
The original contributions presented in the study are included in the article/Supplementary Material, further inquiries can be directed to the corresponding author.
WQ conceived and designed the study and completed the paper in English. QX and ZX revised it critically for important intellectual content and gave good research advice and revised the manuscript. All authors have read and agreed to the published version of the manuscript.
This work was supported by the National Natural Science Foundation of China (Grant No 51939005). The artical was supported by Key R&D Project of Jiangsu Province (Modern Agriculture), No. BE2022351.
The authors declare that the research was conducted in the absence of any commercial or financial relationships that could be construed as a potential conflict of interest.
All claims expressed in this article are solely those of the authors and do not necessarily represent those of their affiliated organizations, or those of the publisher, the editors and the reviewers. Any product that may be evaluated in this article, or claim that may be made by its manufacturer, is not guaranteed or endorsed by the publisher.
Beale, J. G. (1964). Distribution uniformity of sprinkler irrigation systems. Sydney: University of NSW.
Branscheid, V. O., and Hart, W. E. (1986). Predicting field distribution of sprinkler systems. Trans. ASAE 11, 801–803.
Cai, D. Y., Yan, H. J., and Li, L. H. (2020). Effects of water application uniformity using a center pivot on winter wheat yield, water and nitrogen use efficiency in the North China Plain. J. Integr. Agric. 19 (9), 2326–2339. doi:10.1016/S2095-3119(19)62877-7
Christiansen, J. E. (1942). Irrigation by sprinkling. California agricultural experiment station bulletin, 670. Berkeley: University of California.
Deng, J., Xu, W. L., and Qu, J. X. (2002). Influence of aeration on scouring. J. Hydraulic Eng. (10), 8–13. (in Chinese).
Huffman, R. L., Fangmeter, D. D., and William, J. E. (2013). “Sprinkler irrigation,” in Mich. Soil and water conservation engineering Editor St. Joseph 7th Edition (ASABE), 403–435. Chapter 17 doi:10.13031/swce.2013.17
ISO 7749-2 (1990). Irrigation equipment - rotating sprinklers - Part 2: Uniformity of distribution and test methods. British standard.
Lefebvre, A. H., Wang, X. F., and Martin, C. A. (1988). Spray characteristics of aerated-liquid pressure atomizers. J. Propuls. Power 4 (4), 293–298. doi:10.2514/3.23066
Li, J., Kawano, H., and Yu, K. (1994). Droplet size distributions from different shaped sprinkler nozzles. Trans. ASAE 37, 1871–1878. doi:10.13031/2013.28278
Li, J. S., and Kawano, H. (1995). Simulating water-drop movement from noncircular sprinkler nozzles. J. Irrigation Drainage Eng. 121 (2), 152–158. doi:10.1061/(asce)0733-9437(1995)121:2(152)
Li, Y. C., Bai, G., and Yan, H. J. (2015). Development and validation of a modified model to simulate the sprinkler water distribution. Comput. Electron. Agric. 111, 38–47. doi:10.1016/j.compag.2014.12.003
Liu, J. P., Yuan, S. Q., Li, H., and Zhu, X. (2011). Combination uniformity improvement of impact sprinkler. Trans. Chin. Soc. Agric. Eng. 27 (7), 107–111. doi:10.3969/j.issn.1002-6819.2011.07.018
Louie, M. J., and Selker, J. S. (2000). Sprinkler head maintenance effects on water application uniformity. J. Irrigation Drainage Eng. 126, 142–148. doi:10.1061/(asce)0733-9437(2000)126:3(142)
Montazar, A., and Sadeghi, M. (2008). Effects of applied water and sprinkler irrigation uniformity on alfalfa growth and hay yield. Agric. Water Manag. 95, 1279–1287. doi:10.1016/j.agwat.2008.05.005
Montero, J., Tarjuelo, J., and Carrión, P. (2001). Sirias: A simulation model for sprinkler irrigation. Irrigation Sci. 20, 85–98. doi:10.1007/s002710000032
Playán, E., Zapata, N., Faci J, M., Tolosa, D., Lacueva, J., Pelegrin, J., et al. (2006). Assessing sprinkler irrigation uniformity using a ballistic simulation model. Agric. Water Manag. 84, 89–100. doi:10.1016/j.agwat.2006.01.006
Sanchez, I., Faci, J. M., and Zapata, N. (2011). The effects of pressure, nozzle diameter and meteorological conditions on the performance of agricultural impact sprinklers. Agric. Water Manag. 102 (1), 13–24. doi:10.1016/j.agwat.2011.10.002
Sanchez, I., Zapata, N., and Faci, J. M. (2010b). Combined effect of technical, meteorological and agronomical factors on solid-set sprinkler irrigation: II. Modifications of the wind velocity and of the water interception plane by the crop canopy. Agric. Water Manag. 97 (10), 1591–1601. doi:10.1016/j.agwat.2010.05.013
Sanchez, I., Zapata, N., and Faci, J. M. (2010a). Combined effect of technical, meteorological and agronomical factors on solid-set sprinkler irrigation: I. Irrigation performance and soil water recharge in alfalfa and maize. Agric. Water Manag. 97 (10), 1571–1581. doi:10.1016/j.agwat.2010.05.012
Schneider, A. D. (2000). Efficiency and uniformity of the lepa and spray sprinkler methods: A review. Trans. Am. Soc. Agric. Eng. 43 (4), 937–944. doi:10.13031/2013.2990
Sourell, H., Faci, J. M., and Playán, E. (2003). Performance of rotating spray plate sprinklers in indoor experiments. J. Irrigation Drainage Eng. 129 (5). doi:10.1061/(asce)0733-9437(2003)129:5(376)
Stambouli, T., Zapata, N., and Faci, J. M. (2014). Performance of new agricultural impact sprinkler fitted with plastic nozzles. Biosyst. Eng. 118, 39–51. doi:10.1016/j.biosystemseng.2013.11.002
Tarjuelo, J. M., Montero, J., Valiente, M., Honrubia, F. T., and Ortiz, J. (1999). Irrigation uniformity with medium size sprinklers Part I: Characterization of water distribution in no-wind conditions. Trans. Am. Soc. Agric. Eng. 42, 665–676. doi:10.13031/2013.13228
Vories, E. D., Von Bernuth, R. D., and Mickelson, R. H. (1987). Simulating sprinkler performance in wind. J. irrigation drainage Eng. 113 (1), 119–130. doi:10.1061/(asce)0733-9437(1987)113:1(119)
Wang, Z. J., Hui, X., and Li, Y. J. (2019). Optimization of nozzle structure and investigation on hydraulic performance of impact sprinkler. J. Hydraulic Eng. 50 (4), 488–496. (in Chinese). doi:10.13243/j.cnki.slxb.20180660
Xiang, Q. J., Qureshi, W. A., Tunio, M. H., Solangi, K. A., Xu, Z., and Lakhiar, I. A. (2021). Low-pressure drop size distribution characterization of impact sprinkler jet nozzles with and without aeration. Agric. Water Manag. 243, 106458. doi:10.1016/j.agwat.2020.106458
Xiang, Q. J., Xu, Z. D., Chen, C., and Li, H. (2016). Experiment on aeration water jet applied to low pressure impact sprinkler irrigation. 32 (16), 54–58. (in Chinese). doi:10.11975/j.issn.1002-6819.2016.16.008
Xu, Z. D., Xiang, Q. J., and Qureshi, W. A. (2018). Field combination experiment on impact sprinklers with aerating jet at low working pressure. J. drainage irrigation Mach. Eng. (JDIME) 36 (9), 841–845. (in Chinese).
Zakaria, I., Li, H., Jiang, Y., Tang, P., and Chao, C. (2018) Influence of fixed water dispersion devices on water distribution uniformity under different spacing and layouts for impact sprinkler ASABE 2018 Annu. Int. Meet. doi:10.13031/aim.201800020
Zhang, Q. T., Xia, Q., Clark, C. K., and Geng, S. (2013). Technologies for efficient use of irrigation water and energy in China. J. Integr. Agric. 12 (8), 1363–1370. doi:10.1016/S2095-3119(13)60544-4
Keywords: sprinkler irrigation, impact sprinkler, water distribution uniformity, aeration water jet, low pressure irrigation
Citation: Qureshi WA, Xiang Q, Xu Z and Fan Z (2023) Study on the irrigation uniformity of impact sprinkler under low pressure with and without aeration. Front. Energy Res. 11:1135543. doi: 10.3389/fenrg.2023.1135543
Received: 01 January 2023; Accepted: 07 February 2023;
Published: 17 March 2023.
Edited by:
Yang Yang, Yangzhou University, ChinaReviewed by:
Yue Jiang, Jiangsu University, ChinaCopyright © 2023 Qureshi, Xiang, Xu and Fan. This is an open-access article distributed under the terms of the Creative Commons Attribution License (CC BY). The use, distribution or reproduction in other forums is permitted, provided the original author(s) and the copyright owner(s) are credited and that the original publication in this journal is cited, in accordance with accepted academic practice. No use, distribution or reproduction is permitted which does not comply with these terms.
*Correspondence: Qingjiang Xiang, eGlhbmdfcWpAMTYzLmNvbQ==
Disclaimer: All claims expressed in this article are solely those of the authors and do not necessarily represent those of their affiliated organizations, or those of the publisher, the editors and the reviewers. Any product that may be evaluated in this article or claim that may be made by its manufacturer is not guaranteed or endorsed by the publisher.
Research integrity at Frontiers
Learn more about the work of our research integrity team to safeguard the quality of each article we publish.