 Mingfei He
 Penglin Huang1,2,3,4
 Chuncheng Zang
- 1Institute of Electrical Engineering, Chinese Academy of Sciences, Beijing, China
- 2University of Chinese Academy of Sciences, Beijing, China
- 3Key Laboratory of Concentrating Solar Thermal Energy and Photovoltaic System, Chinese Academy of Sciences, Beijing, China
- 4Beijing Engineering Research Center of Concentrating Solar Thermal Power, Beijing, China
This work studied the wind load acting on a point focus solar furnace composed of a 110 m2 heliostat and a 77 m2 concentrator through wind tunnel testing. Based on wind tunnel test data under 305 different working conditions, the variation laws of the wind pressure coefficient, power spectral density, and wind load coefficient of the heliostat and concentrator were analyzed. The results showed that due to the interaction between the concentrator and heliostat, the wind speed near the heliostat and concentrator decreased but the turbulence intensity increased, which caused the peak wind load coefficient to rise slightly. The results suggested that a safety factor of 1.1–1.2 should be considered for structural design and optimization of solar furnaces.
1 Introduction
Small- and medium-sized solar furnaces generally consist of a flat heliostat and a parabolic concentrator, as shown in Figure 1. The heliostat is designed with a dual-axis tracking system to guarantee the accuracy of sun tracking and to reflect the sunlight to the fixed concentrator, which focuses a large area of sunlight on a small spot where the receiver or reactor is positioned (Roldán and Monterreal, 2014; Zhang et al., 2018). The ultra-high temperature and high density that can be obtained in the focal spot provide heat for experimental research on material properties, chemical reactions, and device performance under high-temperature environments (Müller-Trefzer et al., 2021; Behar et al., 2022; Yu et al., 2022). Point focus solar furnaces have the great advantages of a fixed focal spot position, good operational convenience, and ideal working conditions. Development prospects are significant for the wide application of solar furnaces in the fields of renewable energy, chemistry, chemical engineering, military, and aerospace (Neumann and Groer, 1996; Zhang et al., 2018).
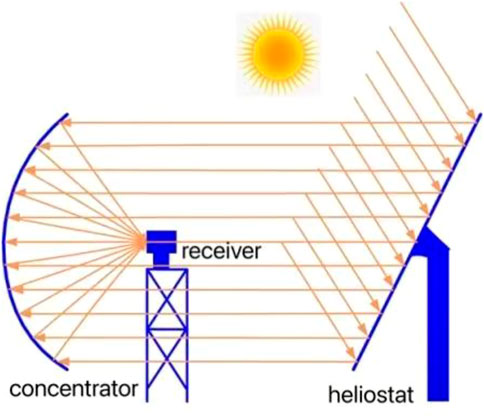
FIGURE 1. Working principal of point focus solar furnaces.
The wind load analysis is significant for solar furnace development because wind load deforms the structure of the heliostat and concentrator to some degree. This deformation leads to a change in the optical path and affects the heat-collecting efficiency of the entire system. Compared with the concentrator, the heliostat is more sensitive to the wind load. When the wind load is too large, it may even cause collapse and damage to the heliostat, resulting in significant economic losses. Therefore, it is very important to study the wind load variation law of solar furnaces, especially that of the heliostat.
Many teams have continuously optimized solar furnaces from multiple perspectives (Garcia et al., 2019; El-Leathy et al., 2022; García et al., 2022). Many studies have reported on the wind load of isolated heliostats, heliostat fields, and concentrators. Peterka et al. (1989) measured the mean wind load and peak wind load on rectangular and circular heliostats; the results showed that the wind load was higher than the predicted value due to the presence of turbulence. Pfahl et al. (2011) studied the wind load coefficients on heliostats of various aspect ratios in wind tunnel measurements. Wu et al. (2010) studied the wind load on heliostats with different gap sizes between the facets, in which the results showed that the influence of the current gap size was negligible. Emes et al. (2017) and Emes et al. (2020) studied the correlation between the peak wind load coefficients on a heliostat and the turbulence characteristics to optimize the size of the heliostat and reduce the cost. The authors also studied the impact of turbulence on the cost of the heliostat. Gong et al. (2013) measured the wind pressures on a heliostat and analyzed the fluctuating wind pressure characteristics. Zang et al. (2014) used an AR mathematical model to simulate the time history of wind velocity fluctuation and then performed modal and transient analyses. Blume et al. (2020) used a dynamic photogrammetry system to capture the wind-induced response. Xiong et al. (2019) used a uniform design method and regression equations to simplify the test conditions of the wind tunnel test. The layout of the heliostat field mainly considers optical efficiency rather than wind load, and the wind load on the heliostat is strongly correlated with the field density (Noone et al., 2012). Sment and Ho (2014) and Emes et al. (2018) studied the heliostat wake and the heliostat load. The research showed that for the heliostat field, the wind load coefficient of the second row of heliostats decreased, and the average wind speed decreased but the turbulence increased. Ma (2010), Wu (2015), and Zhu (2016) studied the interference effect of the heliostat field and the distribution of wind pressure based on numerical simulation. Naeeni and Yaghoubi (2007) studied the wind load on a parabolic collector through wind tunnel testing and numerical simulation. Gong et al. (2012) studied the wind load characteristics and wind pressure distribution of parabolic trough solar collectors by field measurement. Zou et al. (2015), Zou et al. (2017), and Zou et al. (2021) studied the wind load coefficient of a parabolic collector on a flat roof and on the ground, and compared the differences caused by the environment. He et al. (2014) studied the wind load of a dish concentrator through numerical simulation.
For point focus solar furnaces, the heliostat and concentrator affect each other’s wind pressure distribution and other wind load characteristics. The structures and sizes of the concentrator and heliostat are completely different. Therefore, the wind environment of the heliostat of point focus solar furnaces differs not only from the isolated heliostat but also from the heliostat field. The size and structure of the solar furnace concentrator also differ from parabolic trough solar collectors and dish concentrators. Relevant research on the wind load of solar furnace is currently lacking. Therefore, this study assessed the wind pressure distribution and wind load coefficient of a solar furnace based on wind tunnel tests, and provides a technology reference for the structural design and optimization of the solar furnace.
2 Overview of the wind tunnel test
2.1 Test equipment
The experiments were conducted in the atmospheric boundary layer wind tunnel at the Badaling Concentrated Solar Power Platform of Institute of Electrical Engineering of the Chinese Academy of Sciences, Yanqing District, Beijing, as shown in Figure 2. The test section of the wind tunnel is 20 m long, 3 m wide, and 2.5 m high.
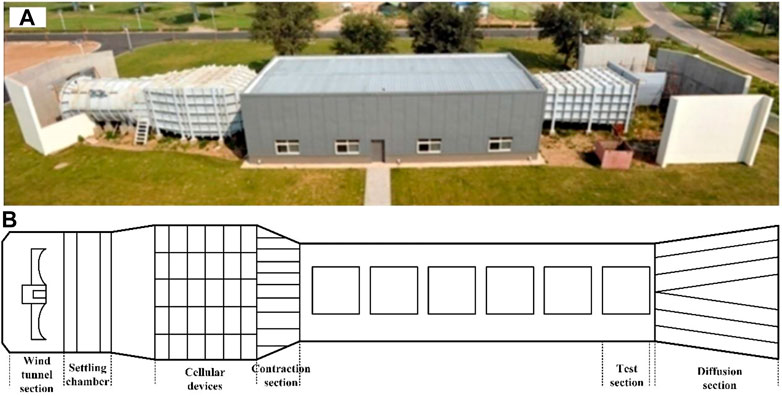
FIGURE 2. Atmospheric boundary layer wind tunnel. (A) Photograph of the wind tunnel. (B) Schematic drawing of the wind tunnel section.
In this experiment, the wind pressure distribution of the heliostat model was measured by the electronic scanning pressure measurement system. Pressure measuring holes were arranged on the surface of the model, which were connected to the electronic scanning valve body through the pressure measuring pipeline. The surface pressure signal of the model was measured synchronously at high frequency. The scanivalve electronic scanning pressure measurement system used in this experiment was a high-precision, high-frequency, real-time, multi-channel pressure signal test system. The 512 channels in a single module can perform accurate measurements under a wide range of temperature changes (from 0°C to 80°C). The accuracy of pressure measurement was up to 1/1000 N, and the sampling frequency was up to 12 kHz.
2.2 Test model
This experiment used a heliostat model with an adjustable elevation angle and a concentrator model, as shown in Figure 3A. The models accurately simulated the supporting structure of the prototype, which is shown in Figure 3B. The prototype of the heliostat had a net reflective area of 110 m2 and the aperture of the concentrator was approximately 77 m2. The geometric dimension ratio of the test model to the prototype was 1: 20.
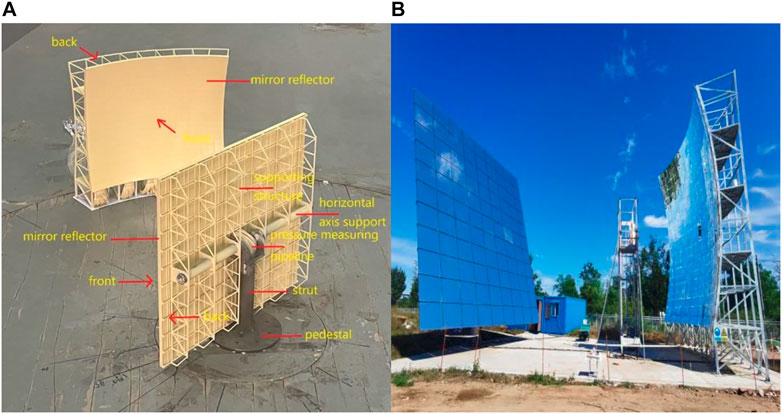
FIGURE 3. Test model and prototype. (A) Heliostat and concentrator models. (B) Point focus solar furnace prototype.
This test model was mainly made of acrylonitrile butadiene styrene plastic, while the horizontal axis support, strut, and pedestal were made of steel to ensure the rigidity of the model and the adjustment of various elevation angles. The pressure measuring pipeline was encapsulated inside a mirror reflector, which ensures that the wind field around the models was not disturbed by the pressure measuring pipeline.
The mirror reflector of the heliostat model contained 170 measuring points on its surface, located on both the front and back. Among them, 6 × 9 = 54 measuring points were evenly distributed, while the measuring points at the corners were clustered. The surface of the mirror reflector of the concentrator model contained 246 measuring points located on both the front and back. Among them, 9 × 11 = 99 measuring points were evenly distributed, while the measuring points at the corners were encrypted.
2.3 Test conditions
In the wind tunnel test, for the heliostat of a point focus solar furnace, each test condition constituted each wind direction angle of the heliostat, each wind direction angle of the concentrator, and the elevation angle. The wind direction angle of the concentrator was related to the wind direction angle of the heliostat. When the concentrator model was oriented back to the flow direction, the wind direction angle α was assumed to be 0°. When the heliostat model was oriented toward the flow direction, the wind direction angle β was assumed to be 0° and it rotated every 30°. When the heliostat mirror reflector was perpendicular to the ground, the elevation angle θ was assumed to be 0°, and it rotated every 15° for a total of seven elevation angles. According to the full test method, 266 (2 × 7 × 7 + 2 × 12 × 7 = 266) test conditions were considered, and the test conditions are shown in Table 1. The concentrator of the point focus solar furnace rotated every 15° (from 0° to 180°). Thus, 39 (13 × 3 = 39) test conditions were considered, and the coordinate system of the wind direction angles and elevation angles is shown in Figure 4.

TABLE 1. Test conditions of the heliostat.
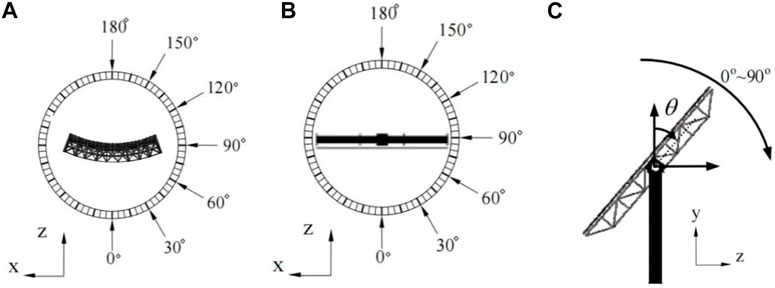
FIGURE 4. Test conditions. (A) Concentrator wind direction angle α; (B) heliostat wind direction angle β; and (C) heliostat elevation angle θ.
2.4 Atmospheric boundary layer modelling
The atmospheric boundary layer simulator consisted of pointed splits and rough elements which, by adjusting their number and position, can produce a simulated atmospheric boundary layer comparable to the field conditions in the wind tunnel test section. The simulation of the atmospheric boundary layer and the placement of the model in the test section of the wind tunnel are shown in Figure 5.
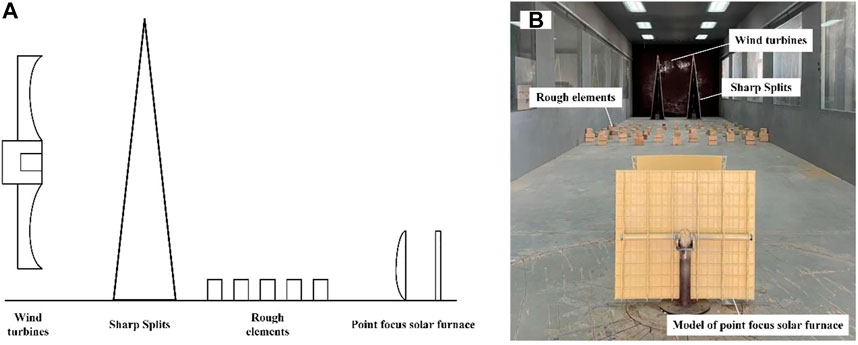
FIGURE 5. Wind tunnel test of the point focus solar furnace. (A) Section diagram. (B) Experiment layout.
The point focus solar furnace in this study is located in the suburbs of Yanqing, China. According to the standard for wind tunnel tests of buildings and structures (JGJ/T 338–2014), the atmospheric boundary layer characteristics were simulated according to a B-type surface. The theoretical wind velocity and turbulence intensity profiles were calculated according to Eq. 1, Eq. 2:
where
When simulating the atmospheric boundary layer, the measuring points of the wind profile started at a height of 0.1 m and ended at 0.7 m, with an interval of 0.1 m, for a total of seven measuring points. The relative deviation between the measured and theoretical values of the mean wind speed was less than ±5%, while the absolute deviation between the measured and theoretical values of the turbulence intensity was less than ±0.02. The measured value and the theoretical curve are shown in Figure 6.
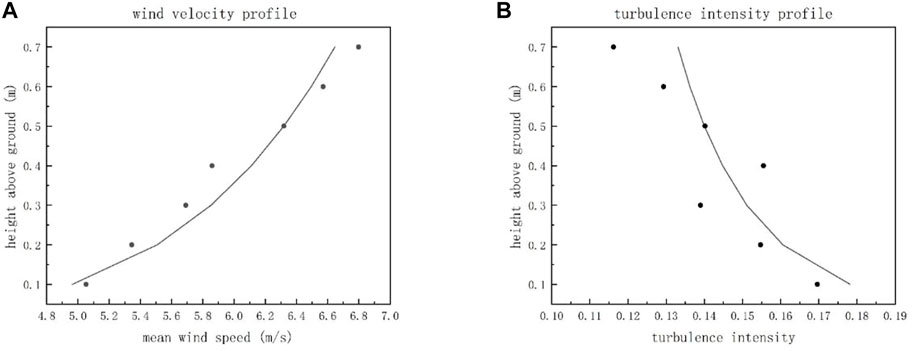
FIGURE 6. Wind profiles. (A) Wind velocity profile. (B) Turbulence intensity profile.
3 Results and discussion
3.1 Wind pressure coefficient analysis
With the difference in the wind direction angle and elevation angle and the influence of the concentrator, the flow field properties on the surface of the heliostat and its cause are essentially different. In addition, the front of the heliostat is a smooth mirror surface, while the back is a sheltered surface with many supports, which causes the wind pressure on the front and back to differ from that on the simple flat structure. The concentrator is fixed on the ground, and its mirror surface is paraboloid. With the difference of the wind direction and the influence of the heliostat, the flow field properties on the surface of the concentrator also differ. This section studied the mean wind pressure coefficients on the front and back surfaces, and the mean net wind pressure coefficient of the heliostat and the concentrator.
The wind pressure of the heliostat and the concentrator is mainly caused by the wind pressure on the front and back of the mirror reflector. It is defined by the time history value of the net wind pressure coefficient and is expressed as the ratio of the net wind pressure on the mirror reflector and the atmospheric incoming wind pressure. It is a dimensionless quantity and is calculated according to Eq. 3.
where
For each measuring point, through mathematical statistical analysis, the mean net wind pressure coefficient
where g is the crest factor, the fluctuating wind usually follows a Gaussian distribution, and g = 3.5.
3.1.1 Influence of wind direction angle and elevation angle on the wind pressure distribution of the heliostat
When β = 0° and θ = 0°, because the lower edge of the mirror is close to the ground, the maximum wind pressure on the windward side occurs in the upper part of the structure. With this position as the center, the wind pressure decreases radially to the surroundings and the minimum average wind pressure coefficient appears at the two corners below the mirror, which is a negative value. With β or θ increasing, the maximum positive pressure area of the mirror gradually moves closer to the windward side. When β = 0° or θ = 0°, the mirror reflector is parallel to the incoming flow and separation of the air flow occurs on the side of the mirror surface close to the incoming flow, causing a negative pressure zone on both the front and back of the mirror edge. The gradient of the negative pressure zone changes drastically and maximum negative pressure occurs at the edge of the mirror. When β = 180°, the heliostat is oriented back to the flow direction and maximum positive pressure occurs between the supports and on the upper side of the mirror. However, due to the supports, horizontal axis support, and strut all being exposed to the incoming flow, the wind pressure distribution is different from the front. The typical working conditions are shown in Figure 7.
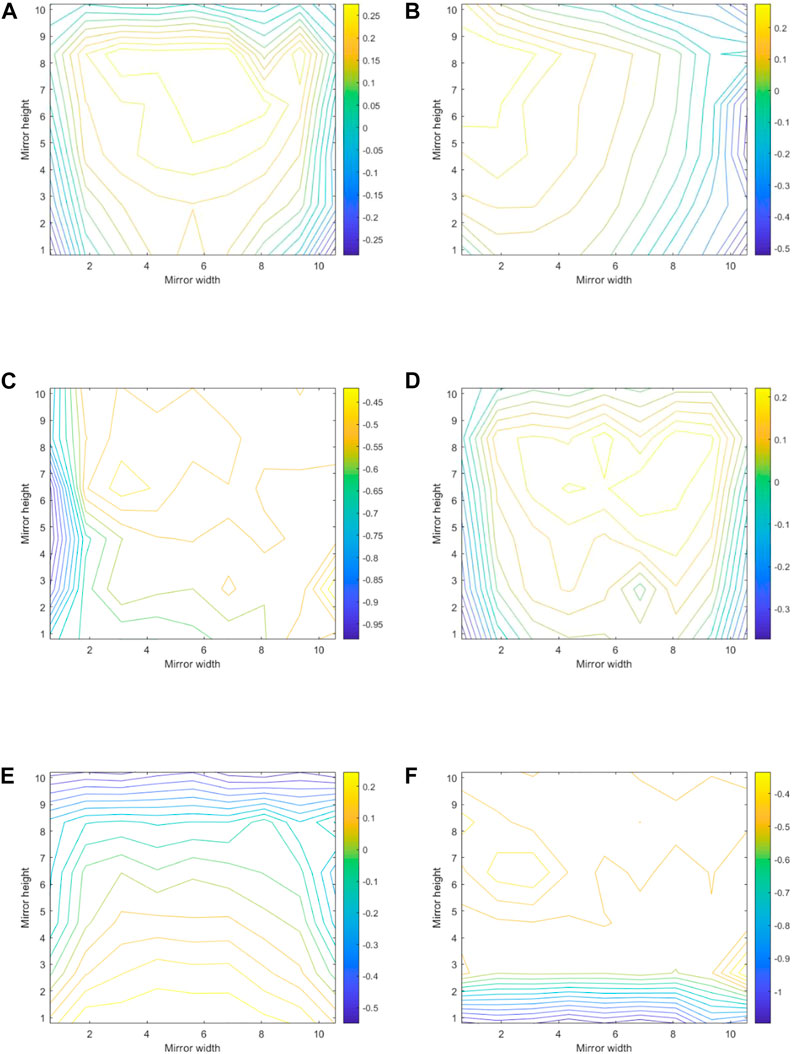
FIGURE 7. Distribution diagram of mean wind pressure coefficient of heliostat under several typical working conditions. (A) α = /, β = 0°, θ = 0°, front; (B) α = /, β = 30°, θ = 0°, front; (C) α = /, β = 90°, θ = 0°, front; (D) α = /, β = 180°, θ = 0°, back; (E) α = /, β = 0°, θ = 45°, front; (F) α = /, β = 0°, θ = 90°, front.
3.1.2 The influence of the concentrator on the wind pressure distribution of heliostat
When α = β = 0° and θ = 0°, the concentrator is in the direction of the incoming flow, completely shielding the heliostat, and a vortex is generated on the front of the concentrator. The distance between the heliostat and the concentrator is relatively small, and the heliostat is located in the area where the vortex is generated. This makes the front of the heliostat mirror generate wind suction, and the largest negative pressure area occurs in the lower part of the structure, with this position as the center, radiating to the surroundings. When α = 30°, β = 0°, and θ = 0° the concentrator does not completely shield the heliostat. Due to the influence of its wake and eddy currents, only a small part of the front of the heliostat is a positive pressure area, and the mean wind pressure coefficient value is small (approximately 0.1). The positive pressure area is near the upper middle part of the unobstructed side, and most of the other areas are negative pressure areas. When α = 0° and β or θ increases, the maximum negative pressure area gradually approaches the incoming flow side and the value gradually increases. This is because when β or θ increases, the side closer to the incoming flow is closer to the center of the vortex. When α = β = 0° and θ = 90°, the negative pressure is still higher near the incoming stream, but the gradient change is not obvious compared to the heliostat, without considering the influence of the concentrator. In general, the influence of the concentrator on the heliostat is mainly due to the occlusion of the heliostat when the concentrator is oriented in the direction of the incoming flow. The greater the occlusion, the more obvious the impact. The typical working conditions are shown in Figure 8.
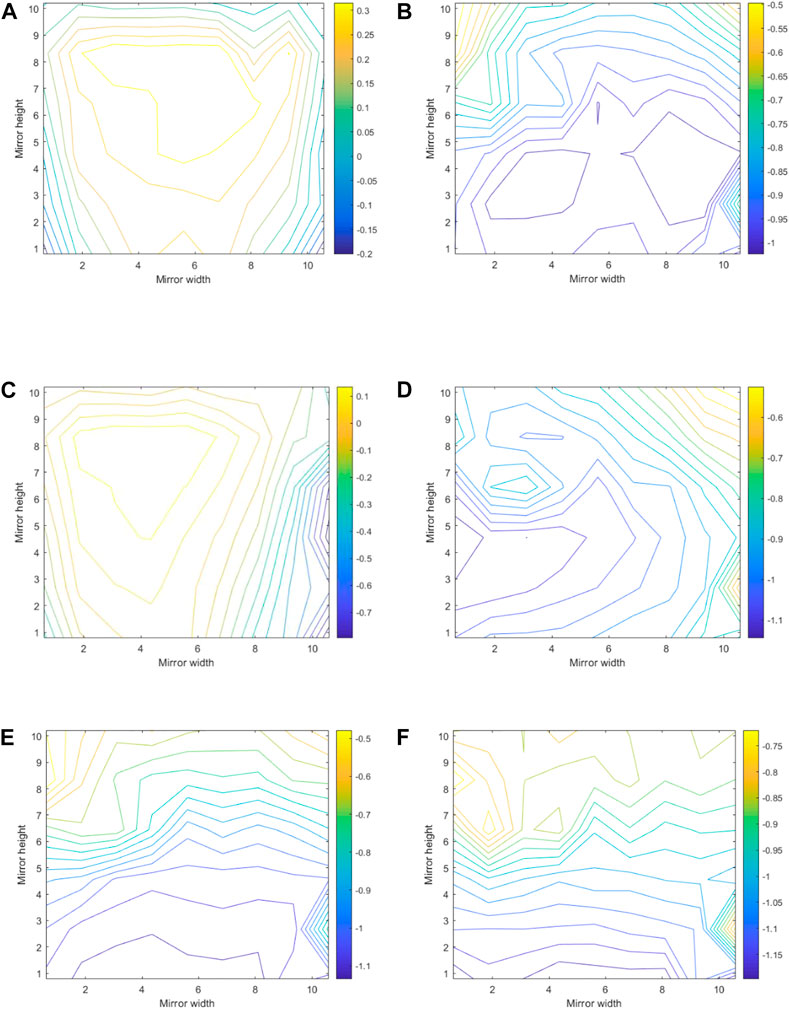
FIGURE 8. Distribution diagram of mean wind pressure coefficient of heliostat under several typical working conditions. (A) α = /, β = 0°, θ = 0°, front; (B) α = 0°, β = 0°, θ = 0°, front; (C) α = 30°, β = 0°, θ = 0°, front; (D) α = 0°, β = 30°, θ = 0°, front; (E) α = 0°, β = 0°, θ = 30°, front; (F) α = 0°, β = 0°, θ = 90°, front.
3.1.3 Wind pressure distribution of the concentrator
Without considering the influence of heliostat, when α = 180°, the concentrator is oriented toward the flow direction. Most of the front is under pressure, and the pressure coefficient is positive and similar in value. The gradient changes drastically near the edge, and a small part of the edge is under negative pressure. The negative wind pressure at the same height of the back is roughly equal, and its value gradually decreases from low to high. When α decreases, the maximum wind pressure area on the concave surface gradually deviates from the windward side and the value decreases. When α = 90°, a vortex is formed on the concave surface and there is a minimum negative pressure zone at the upper and lower positions on the windward side, and two maximum negative pressure zones appear on the other side. When α = 0°, the convex surface faces the wind and its maximum wind pressure occurs in the lower part of the structure, radially decreasing to the surroundings, with sharp gradient changes appearing at the upper edge of the structure, which are caused by the convex support and the platform. The concave surface forms a vortex, and the maximum negative pressure zone is located in the middle of the structure, decreasing upward and downward, with the downward gradient change being less obvious than the uppward.
Considering the influence of the heliostat, when α = β = 180° and θ = 0°, due to the heliostats shielding the concentrator, the concave surface of the concentrator is subjected to wind suction, which is all negative pressure, and the minimum negative pressure zone is located in the lower part of the structure. When α = β = 0° and θ = 0°, the heliostat is located downstream of the wind field. Furthermore, the negative pressure on the concave surface is slightly larger than the case without the heliostat, and the maximum negative pressure area shifts slightly downward. When α = β = 180° and θ = 90°, the heliostat shields the concentrator less, mainly near its horizontal axis. Most areas of the concentrator are under positive pressure, and the edge area is under negative pressure, forming two positive pressure zones with the height of the horizontal axis as the boundary. In general, the influence of the heliostat on the concentrator is similar to the influence of the concentrator on the heliostat. The greater the occlusion, the more obvious the impact. The typical working conditions are shown in Figure 9.
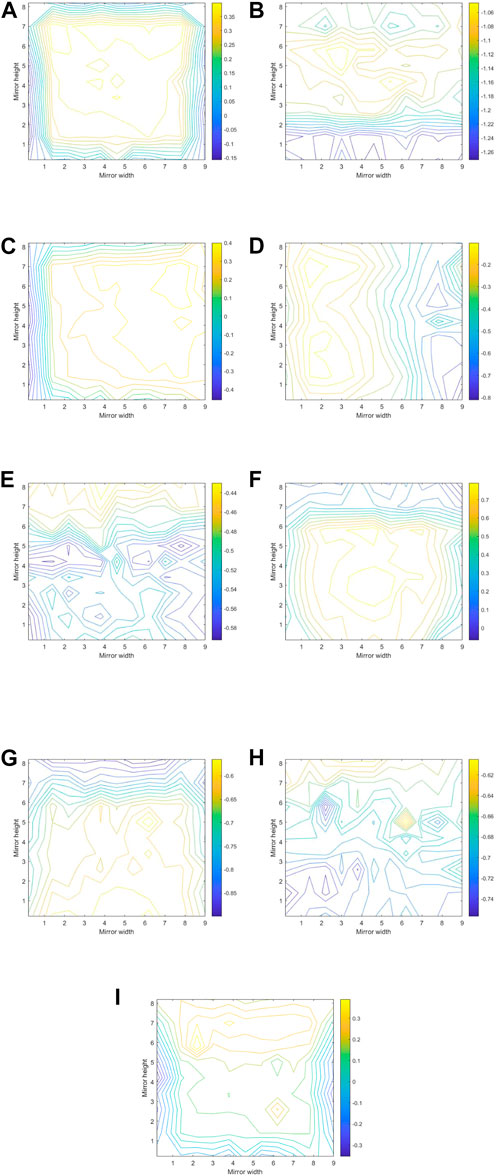
FIGURE 9. Distribution diagram of mean wind pressure coefficient of the concentrator under several typical working conditions. (A) α = 180°, β = /, θ = /, front; (B) α = 180°, β = /, θ = /, back; (C) α = 150°, β = /, θ = /, front; (D) α = 90°, β = /, θ = /, front; (E) α = 0°, β = /, θ = /, front; (F) α = 0°, β = /, θ = /, back; (G) α = β = 180°, θ = 0°, front; (H) α = β = 0°, θ = 0°, front; (I) α = β = 180°, θ = 90°, front.
3.2 Frequency domain analysis
The power spectral density function is the signal power in the unit frequency band, which can be used to describe the distribution of wind pressure random signal power in the frequency domain. In this article, Welch’s method is used to analyze the wind pressure random signal in the frequency domain.
3.2.1 Frequency domain analysis of the heliostat
The distribution of the measuring points in this section is shown in Figure 10.
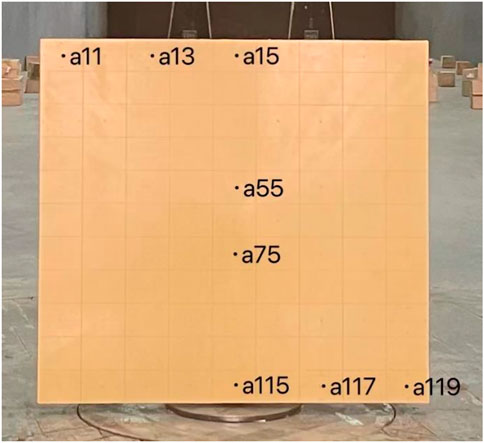
FIGURE 10. Distribution map of the measuring points of the heliostat.
Without considering the influence of the concentrator, when β = 0° and θ = 0°, it can be seen that changes in the energy distribution trend in the frequency domain of each measuring point are similar, and the specific value varies depending on the location. In the low frequency region, the power density of the upper measuring point is first slightly lower than that of the lower measuring point, and then slightly higher. In the high frequency region, the power density of measurement points changes in a more complicated fashion. With an increase in β or θ, the energy in each frequency domain of the measuring point on the side of the incoming flow significantly increases. When β = 180° and θ = 0°, the front measurement points are almost the same in the low frequency region but show different changes in the high frequency region. The typical working conditions are shown in Figure 11, where the abscissa is frequency f, and the ordinate is the power spectral density function Sp(f).
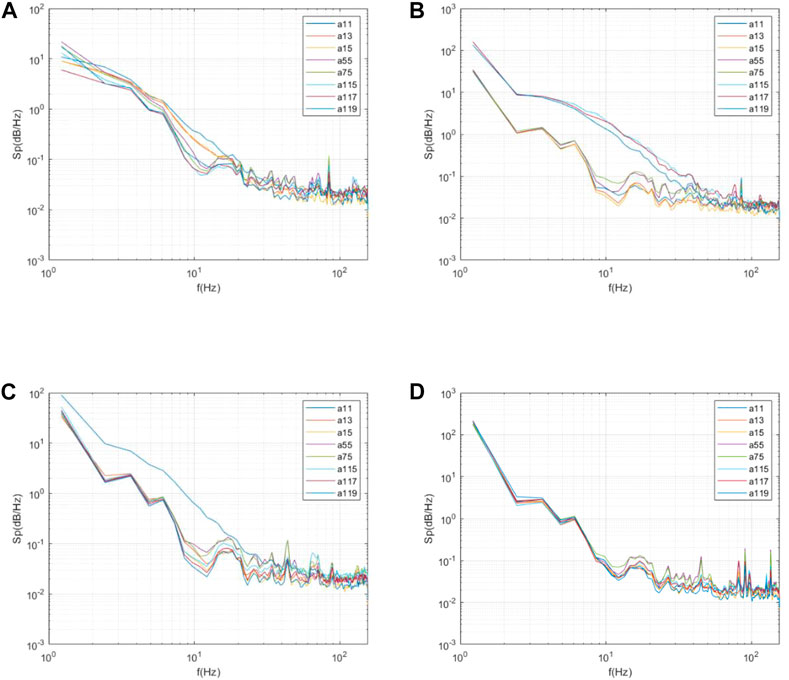
FIGURE 11. Wind pressure power spectral densities of representative measuring points of the heliostat under some typical working conditions. (A) α = /, β = 0°, θ = 0°; (B) α = /, β = 0°, θ = 90°; (C) α = /, β = 90°, θ = 0°; (D) α = /, β = 180°, θ = 0°.
Considering the influence of the concentrator, when α = 0°, β = 0°, and θ = 0°, the concentrator is located at the incoming wind, completely shielding the heliostat. Affected by the wake of the concentrator, the power spectral density of each measuring point is higher than when the concentrator is not considered. Furthermore, because the edge of the concentrator has greater fluctuations, the power density of the corner point a11 is greater than the points a13 and a15 at the upper edge, and both of these points are greater than those of the middle and lower parts. With a gradual increase in θ, the power spectral density of the corner points decreases but is still higher than when the concentrator is not considered. When α = 30°, the concentrator blocks part of the heliostat. Furthermore, the power spectral density of each measuring point is higher than when the concentrator is not considered, and the power spectral density of the measuring point located downstream of the edge of the concentrator significantly increases. When α = 30°, it can be seen that the a115 measuring point is slightly higher than the a117 measuring point, and significantly higher than the a119 and other measuring points. In addition, the a11 and a13 measuring points, which are far away from the incoming wind and concentrator, have the smallest power spectral density. With a gradual increase of α, the power density of each measuring point gradually drops to the same as the heliostat, without considering the influence of concentrator. When α = 180°, the distribution in the frequency domain is very close to that of the heliostat, without considering the influence of concentrator. In general, the influence of the concentrator on the wind pressure of the heliostat in the frequency domain mainly comes from the occlusion of the concentrator and the fluctuation caused by the edge of the concentrator. In addition, the wind pressure power spectral density is higher than when the concentrator is not considered. The typical working conditions are shown in Figure 12.
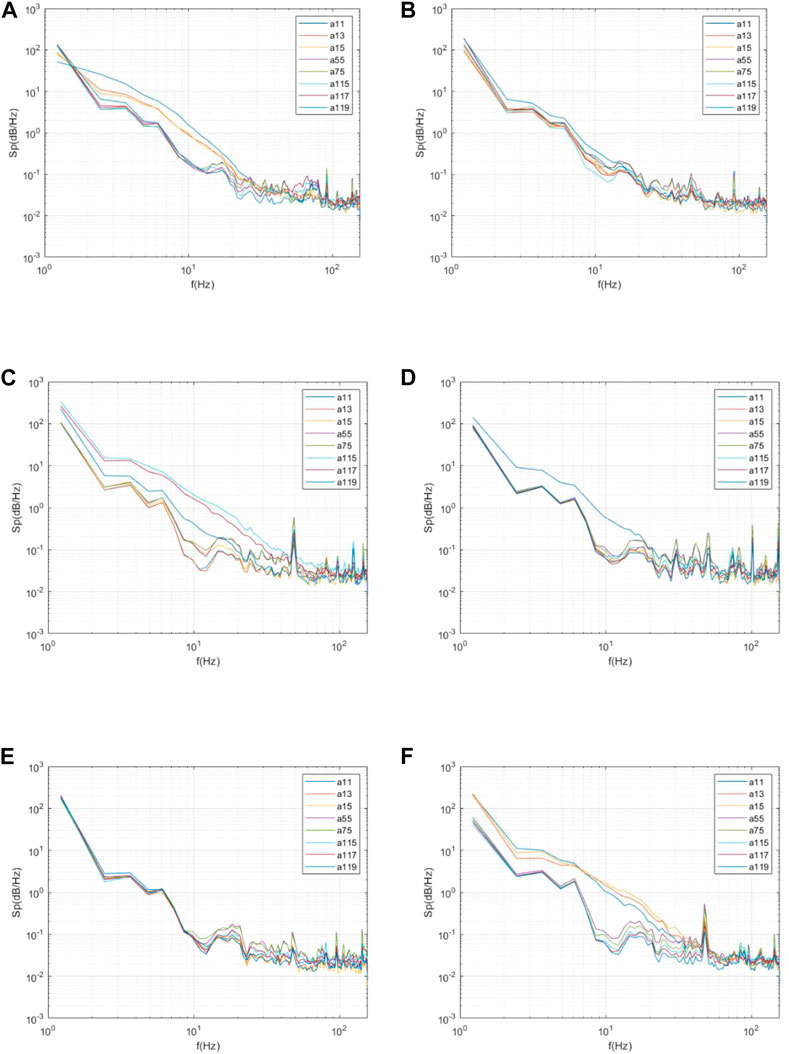
FIGURE 12. Wind pressure power spectral densities of representative measuring points of the heliostat under some typical working conditions. (A) α = 0°, β = 0°, θ = 0°; (B) α = 0°, β = 0°, θ = 90°; (C) α = 30°, β = 0°, θ = 90°; (D) α = 90°, β = 90°, θ = 0°; (E) α = 180°, β = 180°, θ = 0°; (F) α = 180°, β = 180°, θ = 90°.
3.2.2 Frequency domain analysis of the concentrator
The distribution of the measuring points in this section is shown in Figure 13.
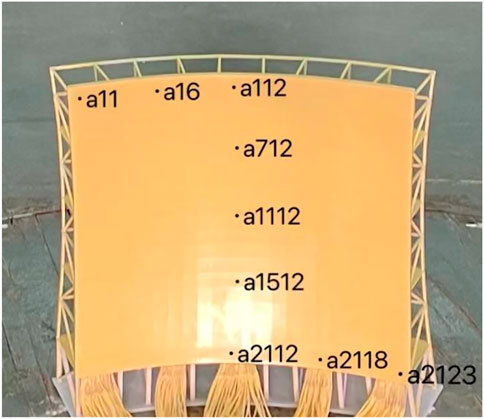
FIGURE 13. Distribution map of the measuring points of the concentrator.
Without considering the influence of the heliostat, when α = 0°, the convex surface is compressed, the change in the energy distribution trend in the frequency domain of each measuring point are similar, and the specific value varies depending on the location. The power spectral density of the lower measuring points is slightly higher than that of the upper measuring points. With an increase in α, the power density of the concave measuring point gradually decreases and the power density of the measuring point on the side far from the incoming wind is slightly higher. When α = 180°, the difference of each measuring point is larger than when α = 0°.
Considering the influence of the heliostat, the changes of each measuring point are similar to the measuring points of the heliostat when the influence of the concentrator is considered, and the power spectral density is significantly increased. The typical working conditions are shown in Figure 14.
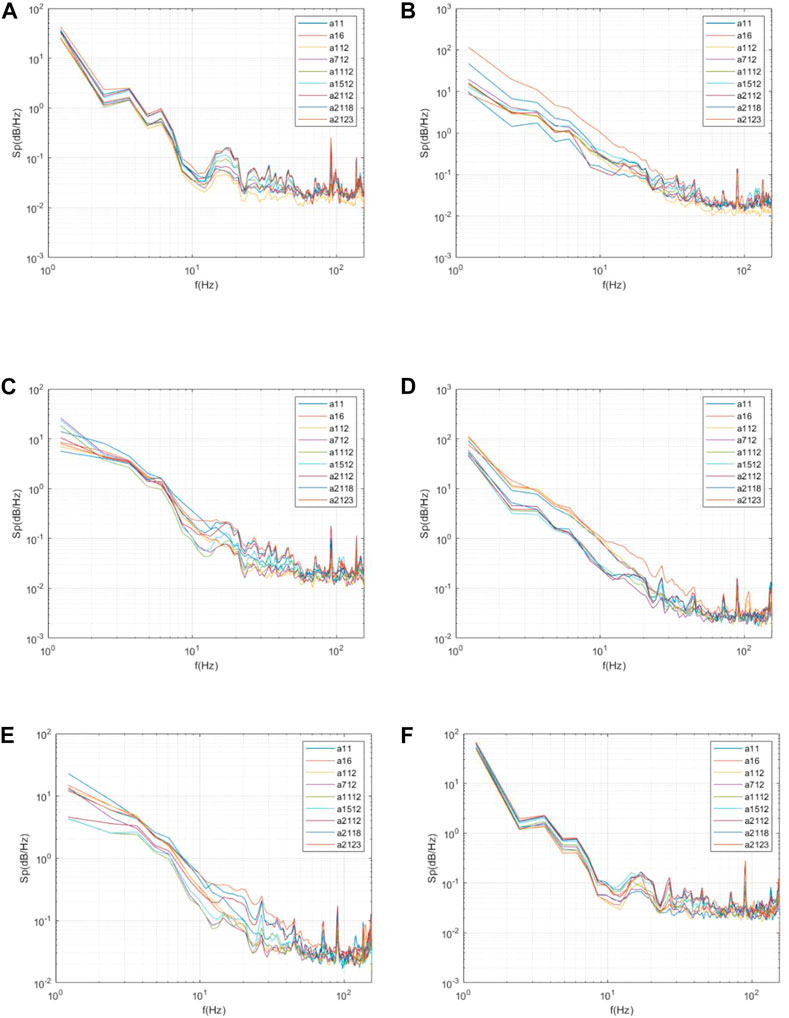
FIGURE 14. Wind pressure power spectral density of representative measuring points of the concentrator under some typical working conditions. (A) α = 0°, β = /, θ = /; (B) α = 90°, β = /, θ = /; (C) α = 180°, β = /, θ = /; (D) α = 180°, β = 180°, θ = 0°; (E) α = 180°, β = 180°, θ = 90°; (F) α = 0°, β = 0°, θ = 0°.
3.3 Variation law of wind load coefficients
3.3.1 Variation law of the mean wind load coefficients of the heliostat
In order to accurately grasp the situation of the heliostat, on the one hand, it is necessary to calculate the wind pressure acting on the surface of the heliostat, and on the other hand, it is necessary to calculate the mean and peak wind load force of the heliostat. In this section, the mean drag force coefficient, mean lift force coefficient, and the coefficient of the moment induced at the hinge are selected to introduce the variation law of the heliostat wind load coefficient.
The mean drag force
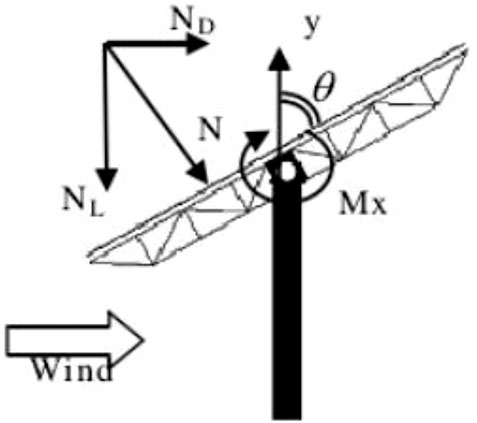
FIGURE 15. Direction of the drag force, lift force, and moment induced at the hinge.
where
The mean drag force coefficient
where N is the number of samples, ρ is the air density,
Without considering the concentrator, the shape of the drag force coefficient curve of the heliostat is similar to the cos function curve. However, due to the difference in the structure of the front and back of the heliostat, the absolute value of the drag coefficient when the back is facing the wind is smaller. Considering the influence of the concentrator, the overall trend of the curve is similar to the situation without the concentrator, but the specific value is also changed due to the influence of the concentrator, which is mainly due to the occlusion of the heliostat by the concentrator and the wake of the concentrator.
When α = 60°–300°, the concentrator has a significant effect on the drag force coefficient of the heliostat. When α = β = 0°, the drag force coefficient, considering the influence of the concentrator on the heliostat, is 9.84% of that without the concentrator. When α = β = 180°, the drag force coefficient, considering the influence of the concentrator on the heliostat, is 104.57% of that without the concentrator. In most working conditions, the drag force coefficient when the influence of the concentrator is considered is smaller than that when the influence of the concentrator is not considered. However, in a very small number of working conditions, the drag force coefficient when the influence of the concentrator is considered is slightly larger than that when the influence of the concentrator is not considered. In addition, due to the influence of the concentrator, the wind speed near the heliostat decreases but the turbulence intensity increases, which causes the peak wind load coefficient to rise slightly. The drag force coefficient curve of the heliostat when θ = 0°is shown in Figure 16.
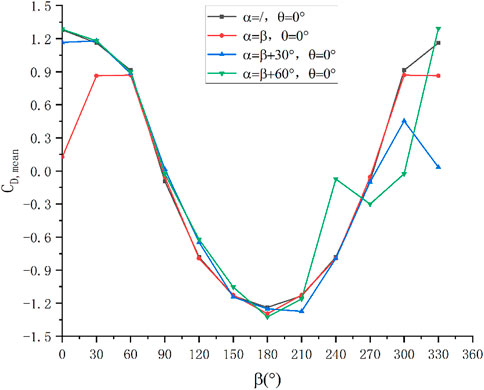
FIGURE 16. Drag force coefficient curve of the heliostat.
The overall trend of lift force coefficient curve and the coefficient curve of the moment induced at the hinge is similar to the drag force coefficient curve, and they are shown in Figure 17 and Figure 18.
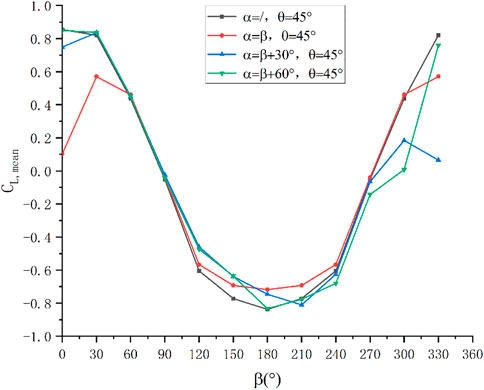
FIGURE 17. Lift force coefficient curve of the heliostat.
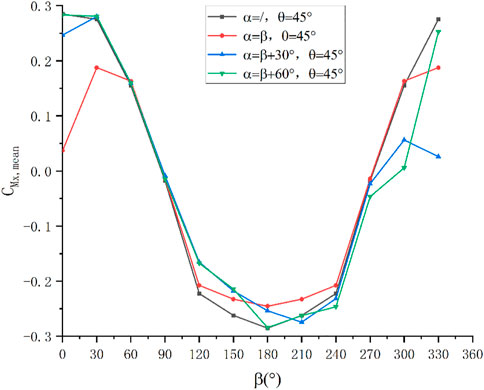
FIGURE 18. Coefficient curve of the moment induced at the hinge.
3.3.2 Variation law of the mean wind load coefficients of the concentrator
Accurately determining the concentrator status requires calculation of the mean and peak wind load force of the concentrator. The solar furnace concentrator is fixed on the ground, with changes only in the wind direction angle. The drag force plays a major role, and the variation law of the lift force coefficient is similar to the variation law of the lift force coefficient. So, in this section, the mean drag force coefficient is selected to introduce the variation law of the concentrator wind load coefficient. The drag force coefficient is calculated according to Eq. 14, while the direction of the force is shown in Figure 4.
where ρ is the air density,
Without considering the influence of the heliostat, when α = 180°, the absolute value of the drag force coefficient is the largest. As α decreases, the drag coefficient gradually decreases and the slope is largest near 90°, which is caused by its shape. The concave surface has greater resistance, while the convex surface has less resistance.
Considering the influence of the heliostat, when α = β = 180°, the wind speed near the concentrator is low and the drag force is small due to the blocking of the heliostat. As α and β gradually decrease, the occlusion gradually lessens and the drag force gradually tends to the situation when the heliostat is not considered. When α and β are constant and as θ increases, the occlusion decreases, which will also increase the force on the concentrator. The maximum positive value when considering the influence of the heliostat is 83.92% of that without considering the influence of the heliostat. The maximum negative value when considering the influence of heliostat is 102.67% of that without considering the influence of the heliostat. The drag force coefficient is shown in Figure 19.
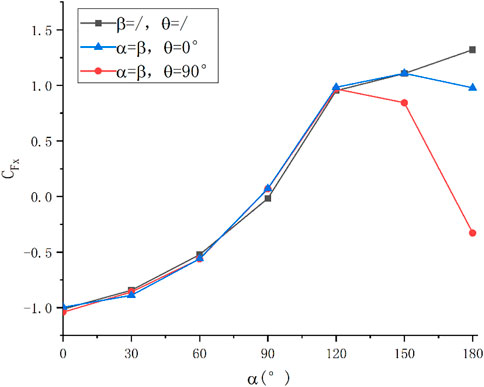
FIGURE 19. Drag force coefficient curve of the concentrator.
To summarize the aforementioned test data analysis, we suggest considering a safety factor of 1.1–1.2 for structural design and optimization of the solar furnace.
4 Conclusion
Based on the wind tunnel test data obtained under 305 different working conditions, the variation laws of the wind pressure coefficient and wind load coefficient of a point focus solar furnace heliostat and concentrator were studied. The results showed that for small- and medium-sized solar furnaces, the mutual influence between the heliostat and the concentrator was very obvious and should be considered for the structural design and optimization of solar furnaces. The conclusions are summarized as follows.
(1) The analysis of the distribution of the wind pressure coefficient showed that the mutual influence between the concentrator and heliostat mainly originated from the occlusion of the incoming wind and its wake. The greater the occlusion, the greater the impact. When completely blocked, the front of the mirror reflector was full of negative pressure.
(2) This study performed a frequency domain analysis of the wind pressure time sequence at each measurement point. When considering the mutual influence of the heliostat and concentrator, the power spectral density of each measuring point of the heliostat and concentrator were significantly higher than those when the mutual influence was not considered. This showed that owing to the mutual influence of the heliostat and concentrator, the mirror reflector had a higher energy everywhere, as well as a higher turbulence intensity near the mirror plate.
(3) Under the most favorable conditions, the drag force coefficient considering the influence of the concentrator on the heliostat was 9.84% of that without the concentrator. Under the most unfavorable condition, the drag force coefficient considering the influence of the concentrator on the heliostat was 104.57% of that without the concentrator. Because of the mutual influence between the concentrator and heliostat, the wind speed near the heliostat and concentrator decreased, but the turbulence intensity increased, causing the peak wind load coefficient to increase slightly. In addition, a safety factor of 1.1–1.2 may be considered for the design and optimization of solar furnaces.
Data availability statement
The original contributions presented in the study are included in the article/Supplementary Material. Further inquiries can be directed to the corresponding author.
Author contributions
Conceptualization, CZ and BG; methodology, MH and PH; software, MH and PH; experiment, MH and PH; formal analysis, PH and CZ; investigation, MH, PH, and CZ; writing—original draft preparation, MH and PH; writing—review and editing, ZW, CZ, BG, and MH; supervision, CZ and ZW; funding acquisition, CZ. All authors contributed to the article and approved the submitted version.
Funding
This project was supported by the CAS-VPST Silk Road Science Fund 2019 (GJHZ201965) and the Strategic Priority Research Program of the Chinese Academy of Sciences (No. XDA21050200).
Conflict of interest
The authors declare that the research was conducted in the absence of any commercial or financial relationships that could be construed as a potential conflict of interest.
The reviewer TM declared a shared affiliation with the authors at the time of the review.
Publisher’s note
All claims expressed in this article are solely those of the authors and do not necessarily represent those of their affiliated organizations, or those of the publisher, the editors, and the reviewers. Any product that may be evaluated in this article, or claim that may be made by its manufacturer, is not guaranteed or endorsed by the publisher.
References
Behar, O., Valenzuela, L., and Mohammedi, K. (2022). Editorial: Advances in solar central receiver technology. Front. Energy Res. 10, 909169. doi:10.3389/fenrg.2022.909169
Blume, K., Röger, M., Schlichting, T., Macke, A., and Pitz-Paal, R. (2020). Dynamic photogrammetry applied to a real scale heliostat: Insights into the wind-induced behavior and effects on the optical performance. Sol. Energy 212, 297–308. doi:10.1016/j.solener.2020.10.056
El-Leathy, A., Al-Ansary, H., Danish, S. N., Alsuhaibani, A., and Alswaiyd, A. (2022). An investigation of the optimum solar flux distribution on a large-scale particle heating receiver. Front. Energy Res. 10, 823448. doi:10.3389/fenrg.2022.823448
Emes, M. J., Arjomandi, M., Ghanadi, F., and Kelso, R. M. (2017). Effect of turbulence characteristics in the atmospheric surface layer on the peak wind loads on heliostats in stow position. Sol. Energy 157, 284–297. doi:10.1016/j.solener.2017.08.031
Emes, M. J., Ghanadi, F., Arjomandi, M., and Kelso, R. M. (2018). Investigation of peak wind loads on tandem heliostats in stow position. Renew. Energy 121, 548–558. doi:10.1016/j.renene.2018.01.080
Emes, M. J., Jafari, A., Coventry, J., and Arjomandi, M. (2020). The influence of atmospheric boundary layer turbulence on the design wind loads and cost of heliostats. Sol. Energy 207, 796–812. doi:10.1016/j.solener.2020.07.022
Garcia, D., Liang, D., Tibúrcio, B. D., Almeida, J., and Vistas, C. R. (2019). A three-dimensional ring-array concentrator solar furnace. Sol. Energy. 193, 915–928. doi:10.1016/j.solener.2019.10.016
García, J., Barraza, R., Soo Too, Y. C., Vásquez Padilla, R., Acosta, D., Estay, D., et al. (2022). Tuning analysis and optimization of a cluster-based aiming methodology for solar central receivers. Front. Energy Res. 10, 808816. doi:10.3389/fenrg.2022.808816
Gong, B., Wang, Z., Li, Z., Zang, C., and Wu, Z. (2013). Fluctuating wind pressure characteristics of heliostats. Renew. Energy 50, 307–316. doi:10.1016/j.renene.2012.06.037
Gong, B., Wang, Z., Li, Z., Zhang, J., and Fu, X. (2012). Field measurements of boundary layer wind characteristics and wind loads of a parabolic trough solar collector. Sol. Energy 86, 1880–1898. doi:10.1016/j.solener.2012.02.036
He, Y., Peng, Y., Long, D., and Yan, J. (2014). Wind load analysis of the large dish condenser for solar power concentrator. Mach. Des. Manuf., 3–5. doi:10.19356/j.cnki.1001-3997.2014.03.076
Ma, R. (2010). “Researches on the wind environment simulation on large-scale heliostat field,”. Doctoral thesis (Changsha China: Hunan University).
Müller-Trefzer, F., Niedermeier, K., Fellmoser, F., Flesch, J., Pacio, J., and Wetzel, T. (2021). Experimental results from a high heat flux solar furnace with a molten metal-cooled receiver SOMMER. Sol. Energy. 221, 176–184. doi:10.1016/j.solener.2021.03.066
Naeeni, N., and Yaghoubi, M. (2007). Analysis of wind flow around a parabolic collector (1) fluid flow. Renew. Energy 32, 1898–1916. doi:10.1016/j.renene.2006.10.004
Neumann, A., and Groer, U. (1996). Experimenting with concentrated sunlight using the DLR solar furnace. Sol. Energy 58, 181–190. doi:10.1016/S0038-092X(96)00079-5
Noone, C. J., Torrilhon, M., and Mitsos, A. (2012). Heliostat field optimization: A new computationally efficient model and biomimetic layout. Sol. Energy 86, 792–803. doi:10.1016/j.solener.2011.12.007
Peterka, J. A., Tan, Z., Cermak, J. E., and Bienkiewicz, B. (1989). Mean and peak wind loads on heliostats. J. Sol. Energy Eng. 111, 158–164. doi:10.1115/1.3268302
Pfahl, A., Buselmeier, M., and Zaschke, M. (2011). Wind loads on heliostats and photovoltaic trackers of various aspect ratios. Sol. Energy 85, 2185–2201. doi:10.1016/j.solener.2011.06.006
Roldán, M. I., and Monterreal, R. (2014). Heat flux and temperature prediction on a volumetric receiver installed in a solar furnace. Appl. Energy 120, 65–74. doi:10.1016/j.apenergy.2014.01.029
Sment, J., and Ho, C. K. (2014). Wind patterns over a heliostat field. Energy Procedia 49, 229–238. doi:10.1016/j.egypro.2014.03.025
Wu, W. (2015). “Wind pressure and interference effects study on heliostat of tower solar thermal power generation system,”. Doctoral thesis (Changsha China: Hunan University).
Wu, Z., Gong, B., Wang, Z., Li, Z., and Zang, C. (2010). An experimental and numerical study of the gap effect on wind load on heliostat. Renew. Energy 35, 797–806. doi:10.1016/j.renene.2009.09.009
Xiong, Q., Li, Z., Luo, H., and Zhao, Z. (2019). Wind tunnel test study on wind load coefficients variation law of heliostat based on uniform design method. Sol. Energy 184, 209–229. doi:10.1016/j.solener.2019.03.082
Yu, Y.-P., Bai, F.-W., and Wang, Z.-F. (2022). Numerical and experimental investigation on thermal performances of quartz tube gravity-driven solid particle solar receiver based on linear-focused solar furnace. Renew. Energy. 203, 881–897. doi:10.1016/j.renene.2022.12.126
Zang, C. C., Christian, J. M., Yuan, J. K., Sment, J., Moya, A. C., Ho, C. K., et al. (2014). Numerical simulation of wind loads and wind induced dynamic response of heliostats. Energy Procedia 49, 1582–1591. doi:10.1016/j.egypro.2014.03.167
Zhang, X., Cui, Z., Zang, C., Zhu, H., Bai, F., Wang, Z., et al. (2018). Gender difference in the relationship between serum uric acid reduction and improvement in body fat distribution after laparoscopic sleeve gastrectomy in Chinese obese patients: A 6-month follow-up. Adv. New Renew. Energy 6, 288–296. doi:10.1186/s12944-018-0934-y
Zhu, C. (2016). “Study on wind pressure distribution of large-scale heliostat group based on supercomputing,”. Doctoral thesis (Changsha China: Hunan University).
Zou, Q., Li, Z., Wu, H., Kuang, R., and Hui, Y. (2015). Wind pressure distribution on trough concentrator and fluctuating wind pressure characteristics. Sol. Energy 120, 464–478. doi:10.1016/j.solener.2015.02.014
Zou, Q., Li, Z., and Wu, H. (2017). Modal analysis of trough solar collector. Sol. Energy 141, 81–90. doi:10.1016/j.solener.2016.11.026
Zou, Q., Wang, C., Zeng, X., Shan, M., Zhao, Y., Liu, Y., et al. (2021). Experimental study on wind tunnel force measurement of flat roof Trough Condenser (FRTC). Sol. Energy 224, 1302–1312. doi:10.1016/j.solener.2021.06.081
Nomenclature

Keywords: point focus solar furnace, heliostat, concentrator, wind load, wind tunnel test
Citation: He M, Huang P, Gong B, Zang C and Wang Z (2023) Wind tunnel test study on the wind load variation law of a point focus solar furnace. Front. Energy Res. 11:1133884. doi: 10.3389/fenrg.2023.1133884
Received: 29 December 2022; Accepted: 15 May 2023;
Published: 30 May 2023.
Edited by:
Mircea Neagoe, Transilvania University of Brașov, RomaniaReviewed by:
Olanrewaju Oyewola, Fiji National University, FijiTianzeng Ma, Chinese Academy of Sciences (CAS), China
Copyright © 2023 He, Huang, Gong, Zang and Wang. This is an open-access article distributed under the terms of the Creative Commons Attribution License (CC BY). The use, distribution or reproduction in other forums is permitted, provided the original author(s) and the copyright owner(s) are credited and that the original publication in this journal is cited, in accordance with accepted academic practice. No use, distribution or reproduction is permitted which does not comply with these terms.
*Correspondence: Chuncheng Zang, emFuZ2NoY2hAbWFpbC5pZWUuYWMuY24=