 Ying Cai*
 Wei Luo
- Guangzhou Power Supply Bureau of Guangdong Power Supply Company Ltd.,, Guangzhou, China
The purpose of this paper is to reach the optimal active and reactive power operation of multiple dispersed resources consisting of mobile energy storage system (MESS), demand response (DR) and photovoltaic (PV), for flexibility improvement of distribution network with uncertain PV and DR, minimization of power loss and operation cost whilst satisfaction of both power factor and voltage variation requirement. Especially, the flexibility aspect of distribution network is focused due to its significance for supporting economic operation without voltage rise issue during high PVs integration. Firstly, the active and reactive power operation spaces of MESS and PV inverter are discussed under power factor constraint. Then, the stochastic characteristics of PV generation and DR of microgrids are investigated using probability distribution. After that, the optimization framework coordination with dispersed MESS, PV inverter and DR to ensure operational flexibility of distribution network is proposed. Finally, the total cost minimization based flexibility improvement approach is presented by optimizing power loss, uncertain risk, operation cost of distribution network and MESS, satisfying operation constraints of both distribution network and dispersed resources. Simulation results conducted on the IEEE 69-bus system demonstrate the effectiveness of the proposed approach for PV accommodation, voltage quality improvement as well as peak load shaving.
1 Introduction
With concerning about issues of environmental emissions and depletion of fossil fuels, the solar photovoltaic (PV) has experienced rapid growth in the last decades. For instant, at the end of 2030, the global total installed capacity of PV estimated at roughly 3000 GW, about 2000 GW of which will be installed during 2020–2030 Adib et al. (2015). Generally, the maximum PV output happens with a low level of load demand, a high proportion PV integration might create reverse power flow in distribution network, and thus feeders are more likely to experience overvoltage problem, especially in weak distribution grids Tonkoski et al. (2012); Li et al. (2021). Besides, the reverse power flow will inevitably increase the power loss of weak distribution grids.
In the past few years, different kinds of approaches have been conducted to mitigate the undesirable voltage rise on the increasing of the proportion of PV integration in distribution network. The most effective strategy for handling voltage rise is grid reinforcement by increasing the radius of the feeder. However, the investment cost of this approach is very expensive Shayani and de Oliveira (2011); Jiao et al. (2019). Another strategy to address voltage rise is using onload tap changing transformers at the secondary winding. However, this strategy cannot well deal with the voltage rise at the terminal node of distribution network. Additionally, this strategy requires the tap to change frequently, which inevitably reduces the service life and in turn increases operational and maintenance cost of transformer Wang et al. (2012).
Recently, curtail active power or consume reactive power were investigated to address the voltage rise problem Demirok et al. (2011); Tonkoski et al. (2011). Although the active power curtailment is effective to regulate voltage rise, it may not be an economically attractive solution. Because this approach reduced the penetration level of the PV resource, and adversely affects on PV owner revenue Weckx et al. (2014). As for the approach to consume reactive power, it might bring additional power losses in feeders due to the higher current flows Cortés-Caicedo et al. (2021). In Liu et al. (2012), authors have discussed the limitations of the reactive power in addressing voltage rise. However, in some low voltage distribution grids, as the ratio of R/X is high, overconsume reactive power is not a good way to prevent overvoltage under a high PV penetration level. Therefore, investigate the optimal operation strategy of active and reactive generation of dispersed PVs is necessary. But, the optimal operation of dispersed PVs also faces the challenges of randomness and volatility of PV generation Jiao et al. (2021).
In the past few years, the concept of using energy storage system (ESS) to prevent overvoltage is a cost-effective method for the replacement of the power curtailment Hashemi and Østergaard (2018); Prabpal et al. (2021). Besides, the ESS also performs a good performance in shaving peak power as well as backup power. Moreover, smoothing the output changes of PV can be realized by ESS Kabir et al. (2014). In von Appen et al. (2014), the authors investigate several local control strategies for sizing the ESS in low voltage distribution grids. The intelligent charging/discharging strategies of the ESS have been discussed in Gao et al. (2021); Xiang et al. (2018) for mitigating voltage rise/drop problems. These strategies have been shown to be very robust with respect to overvoltage and have significant advantages of non-communication and high computation efficiency. The main issue for deploying ESS is the economic, which limits large-scale access to ESS. The dispersed PVs are installed at different locations of distribution network. This means that the voltage rise issue can occur at different locations, and it is not practical to install multiple distributed ESS to address this issue.
Mobile energy storage system (MESS) is with the advantage of transportability, and can realize the space-time transfer of energy. MESS has become a good alternative to the traditional ESS in addressing the voltage rise caused by the dispersed Qu et al. (2021); Jeon and Choi (2022). For example, the authors in Sun et al. (2021) proposed a two-stage MESS control strategy to relieve voltage violation. In addition to mitigating the voltage violation, the MESS can also reduce the investment, operating and emission cost in weak distribution grids with high PVs Ahmed et al. (2021). In Saboori and Jadid (2022), the authors investigated the optimal spatio-temporal scheduling of MESS in recovering the variable renewable energy. From the above discussion, MESS is a promising technology that will contribute to improve flexibility of distribution network with high PVs integration. However, few work in the literature studies the coordinated active and reactive power operation of dispersed MESS, PV inverters and demand response (DR). Moreover, most of the studies in the literature on MESS ignore its reserve service for addressing the randomness and volatility of PV generation and DR.
In view of the above discussion, we propose a coordinated active and reactive power operation model of multiple dispersed resources for flexibility improvement, to address the voltage issue, power loss as well as randomness and volatility of PV generation and DR. In the model, the operation spaces of MESS and PV inverters are fully discussed considering power factor requirement. Then, the stochastic characteristics of PVs generation and DR of microgrids are studied by expected power not served (EPNS) and expected power curtailment (EPC). Finally, by optimizing power loss, demand response cost, and operation cost of both MESS and distribution network, the flexibility improvement based coordinated operation model is proposed and optimized by a novel evolutionary algorithm.
The rest of the paper is structured as follows. Section 2 gives the problem formulation. The operation characteristics of PV inverter and MESS are discussed in Section 3. The quantitative evaluation of uncertain PV and DR is developed in Section 4. The coordinated optimization model is presented in Section 5, Section 6, Section 7 present the experimental study and conclusion, respectively.
2 Problem formulation
In a low voltage distribution network, the ratio between resistance R and reactance X is relatively high, and a high proportion PV may cause voltage rise and drop during peak and off-peak PV generation. To analyze the scenario concerning voltage issue, an equivalent two-bus system with PV inverter is shown by Figure 1, which PV inverter denotes the solar power generation with active power P and reactive power Q. U denotes the magnitude of voltage phasor at point of common coupling (PCC), PL and QL are respectively the active power and reactive power demand at PCC, ΔP and ΔQ are respectively the active and reactive power provided by PV inverter to power grid, and US represents the voltage magnitude. Then, we can easily derive the following relationships:
and magnitudes of the voltage at PCC without and with PV integration can be expressed by Eqs 2, 3, respectively
thus, the voltage deviation at PCC with and without PV integration is
note that the second item of Eq. 4 is much smaller than the first item Divshali and Söder (2017), and Eq. 4 can be rewritten into
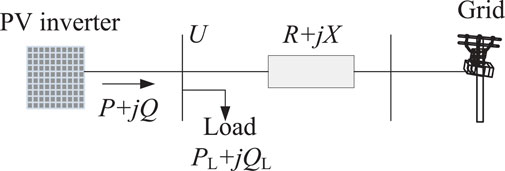
FIGURE 1. The equivalent single-line diagram of PV inverter in low voltage feeder.
Generally, in the case of the voltage of injecting node not exceed the bound, the PV is suggested to provide power to the line with an almost unity power factor. That is, the voltage deviation is mainly affected by the active power:
Suppose ΔUmax denotes the maximum voltage deviation, corresponding to the maximum voltage Umax and the maximum active power Pmax. If PV inverter’s active power satisfies P′ > Pmax, in order to prevent overvoltage, it requires active power curtailment or reactive power consumption, satisfying:
where
On the other hand, suppose the minimum allowed voltage deviation is ΔUmin, corresponding to the minimum active power output of PV inverter, Pmin, and minimum voltage of PCC, Umin. If the active power output of PV system P″ < Pmin, in order to prevent undervoltage, it requires active power injection or reactive power compensation, satisfying:
where
Thus, the problem of voltage rise and drop could be controlled by coordinating active and reactive power. Note that it is not allowed to curtail customer-owned PV power in certain counties, as in Denmark. In this paper, therefore, a coordinated operation framework for investigating the optimal MESS and PV inverter is developed to solve the voltage issue in a high-level PV integrated distribution network.
3 Operation characteristics of PV inverter and MESS
3.1 PV inverter operation space
In this subsection, we will discuss the maximum allowed power output in the presence of overvoltage and undervoltage. As discussed in the above section, a high PV inverter penetration will cause voltage rise. Then, it is necessary to determine the maximum deliverable power limit to avoid overvoltage. Figure 2 gives two possible relationships between voltage and active power, which are described by f1(U) and f2(U).
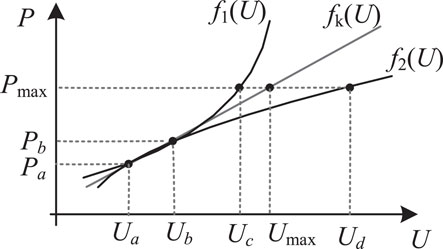
FIGURE 2. The relationship between active power and voltage.
As shown by Figure 2, suppose (Ua, Pa) and (Ub, Pb) are two points on f1(U) and f2(U) at time ta and tb, respectively. Let Δt = tb − ta, tb → ta, then the P − U curve can be expressed by fk(U) approximately, where the slope factor k of fk(U) is
Thus, the maximum active power Pmax corresponds to the maximum allowed voltage Umax shown as follows
In Figure 2, f1(U) and f2(U) are two possible curves between active power and voltage. In f1(U), it indicates that dU/dP > 0, and d2U/dP2 < 0; while in f2(U), it implies that dU/dP < 0, and d2U/dP2 > 0. From the figure, we can reach that in f1(U) the maximum active power Pmax corresponds to voltage Uc(<Umax), which means the determined maximum active power by Eq. 12 satisfies voltage limitation; while in f2(U) the maximum active power Pmax corresponds to voltage Ud(>Umax), which indicates Eq. 12 cannot be used for f2(U) to determine the maximum active power.
Actually, according to Eq. 5, we can derive the following equations:
therefore, the relationship between voltage and active power illustrated by f2(U) does not exist and Eq. 12 can be used to investigate f1(U). The upper limit of active power in distribution grid from PV inverter can be expressed as
where PMPPT denotes the maximum tracked power of the PV inverter.
Given apparent power SPV of PV inverter, the operating space of the inverter is
3.2 Operation characteristic of MESS
The temporal-spatial characteristic is a commonly used modeling method for transportation network, which has been successfully employed to address vehicle routing and scheduling in power system optimizing problem (Qu et al., 2021). In this paper, this method is developed to simulate temporal-spatial charging/discharging of MESS in distribution network. All possible transportation routes of MESS are modeled by moving arcs and holding arcs. The moving arcs represents a movement associated with a spatial and time location. As for the holding arcs, it indicates that MESS is with the charging/discharging service during the operation period.
Suppose m and n are two nodes of distribution network, the transportation time ζn,m(t) between these two nodes can be modeled as Abdeltawab and Mohamed (2017):
where kdelay(t) denotes the traffic congestion delay during time t, Dn,m represents the traveling distance between nodes m and n, vMESS is the transportation speed of MESS and
Equation 16 indicates that MESS departing from node m at time t cannot move to destination node n until time t + ζm,n(t). Here, uMESS(t) ∈ {0, 1} is the binary variable, which is defined as the indicator of MESS state, where uMESS(t) = 1 means that MESS is in the charging/discharging state during time t, while uMESS(t) = 0 represents that MESS is in the transportation state during time t. ζm,n(t) denotes the time period required to transport from nodes m to n at time t. Thus, the relationship between uMESS(t) and ζm,n(t) satisfies:
where N is the node number,
Based on Eq. 17, the transit-time matrix M of MESS can be formulated by Dijkstra’s algorithm(Kwon et al., 2019):
where
I and 0 are respectively the identity matrix and zero matrix, T is the daily dispatching periods, and
In the whole dispatching period, the MESS should satisfy the following operation constraints:
Equation 21a describes the MESS available energy at the start and end time which should be equal, where SOE(0) and SOE(T) are respectively the state of energy (SOE) at start and end time; Eq. 21b denotes the state of charge (SOC) of MESS, SOC(t) denotes the state of the charge at time t, EMESS is the capacity of MESS, and SOCmax and SOCmin denote the maximum and minimum SOC, respectively; Eq. 21c is employed to determine the capacity of MESS, where SOEmax and SOEmin indicate the maximum and minimum SOE, respectively; Eq. 21d denotes the relationship between charging/discharging power and SOE during time t, where
As for MESS, if the allowed power factor is CMESS, then the operating space is represented as:
where
4 Quantitative evaluation of uncertain PV and DR
As stated by Zhang et al. (2019); Chen et al. (2017b), the forecasting errors of PV generation and DR always exist, and thus the forecasting errors should be considered in distribution network scheduling with high proportion PV penetration by using Gaussian distribution Preda et al. (2018); Chen et al. (2017a).
Without loss of generality, at a specified time period, we assume that there are two nodes installed PV inverters and two nodes participated in DR. Here, the forecasting errors of PV inverter and DR are assumed to follow multivariance normal distribution, i.e., ΔPPV = (ΔPPV,1, ΔPPV,2) ∼ N(0, BPV), and ΔPDR = (ΔPDR,1, ΔPDR,2) ∼ N(0, BDR), where ΔPPV and ΔPDR represent the forecasting error vectors of PV inverter and DR, respectively and
where μPV = (μPV,1, μPV,2) and μDR = (μDR,1, μDR,2) are respectively the forecasting value vectors of PV inverter and DR.
Then, let ϕ(PPV) and ϕ(PDR) represents the joint probability density (JPD) functions of PV inverter and DR, respectively. Then, ∀x ∈ (0, PPV,i), i ∈ {1, 2}, the expected power not served (EPNS) of PV inverter can be evaluated by Eq. 24:
where
and the JPD function of QPV = (QPV,1, QPV,2) is ϕ(QPV)|J(QPV,1, QPV,2)|. Accordingly, the EPNS associated with PV reactive power is given as:
Let
Similar to PV inverter, ∀y ∈ (0, PDR,j), j ∈ {1, 2}, the EPNS and EPC of jth DR considering response error can be derived by the following equations:
where
5 Proposed optimization model
On the one hand, a high penetration of PV will contribute to distribution network to reduce the pollution emission and operation cost Chen et al. (2017a, 2020). However, the distribution network will inevitably experience the voltage issue and power loss problems. On the other hand, though coordination operation can efficiently mitigate voltage issue, the PV inverter and MESS face the challenges of power factor requirement and forecasting uncertainty. To well describe the issues of security and economic, in the proposed active and reactive coordination optimization model, flexibility objectives associated with power loss, EENS and EEC of PV inverter and DR, and operation cost of MESS and distribution network are considered under various of practical security constraints, which aims to minimize the power loss and operation cost in the predefined dispersed resources physical limits, voltage level as well as power factor requirement.
Suppose the scheduling time interval is T, and the numbers of PV inverter, DR user and MESS are respectively NPV, NDR and NMESS. The optimization objective F is formulated as follows:
where (Eq. 33a) represents the active power cost, λP(t) is the active power time-of-use price, PLoad,0(t) denotes the active power demand without implementing DR at time t, and PLoss(t) represents power loss of distribution network; (Eq. 33b) denotes the reactive power cost, λQ(t) is the reactive power time-of-use price at time t, QLoad,0(t) denotes the reactive power demand without implementing DR at time t; (Eq. 33c) denotes the cost of implementing DR, λP0(t) and λQ0(t) are respectively the active and reactive power price without implementing DR at time t, PLoad(t) and QLoad(t) represent active and reactive load demand after DR, respectively; (Eq. 33d) represents reserve requirement cost to address the forecasting errors of PV inverter and DR,
Besides the active and reactive power feasible areas of PV inverter and MESS discussed in Section 3, constraints of the proposed coordination scheduling are also constrained by the following constraints.
Equations 34, 35 are respectively power balance constraints of distribution grid, where
6 Experimental study
The IEEE 69-bus test system with 12.66 kV with 69 buses and seven laterals is employed Baran and Wu (1989). The substation voltage is considered as 1 p.u. In consideration that the proposed coordination optimization framework is with the non-convex and non-smooth characteristics, derivation-based approaches face the challenge in searching the optimal solution. Keep this in mind, the evolutionary predator and prey strategy (EPPS) investigated in Chen et al. (2016) is employed in this paper. The EPPS algorithm shows great potentials in balancing global searching and local searching based on the hunting-escaping mechanism, and the investigations carried out in Chen et al. (2016, 2017a); Qu et al. (2021) shown a good global searching ability in solving complex benchmarks and engineering optimization problems.
We consider a typical day with T = 24. The peak period is 10 A.M.–16 P.M. and 20 P.M.–24 P.M., the off-peak period is 6 A.M.–9 A.M. and 17 P.M.–19 P.M., and the valley period is 1 A.M.–5 A.M. Chen et al. (2020). The initial active power price is 240$/MW, and the peak, off-peak and valley active power price are respectively within the intervals [242, 440], [220, 220], and [0, 198]; the initial reactive power price is 48$/MW, and the peak, off-peak and valley reactive power price are respectively within the intervals [48.4, 88], [44, 44], and [0, 39.6] Jiao et al. (2021). The DR users are on buses 11, 18, and 61 with maximum PV installed capacity 1 MW, 2 MW and 3 MW, respectively. The forecasting errors of DR are set to 10% of the response values, and the forecasting errors of PV inverters are set to 20%, 25% and 30% of the forecased values. The power factors of PV inverter and MESS are both set to 0.9. The charging/discharging efficiency of MESS is 90%, the truck labor cost of MESS is 5$/h, the fuel cost is 2$/km, and lower and upper limits of SOC are 0.2 and 1.0, respectively Qu et al. (2021). The forecasted hourly output of PV inverter and the traffic congestion delay time of MESS are shown by Figure 3.
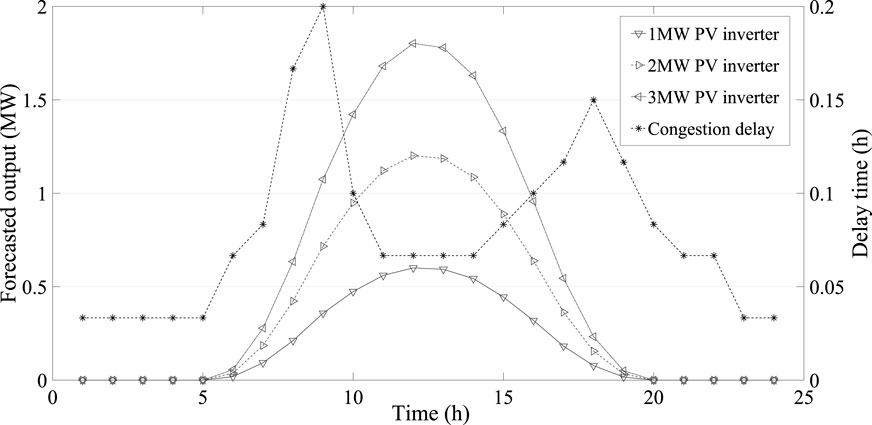
FIGURE 3. Hourly output of PV inverter and traffic congestion delay time of MESS.
Figure 4 shows the optimal voltage files, which are in the range from 0.9990 to 0.9999, satisfying the operation condition of the distribution network. In addition, the box plot of feeder voltages from different hours are presented in Figure 5. The exceptional value are plotted as outliers using “+”. The bottom and top horizontal lines denote the limit values expect the outliers. As for the rectangular box, it contains half of the voltage, which the red lines within rectangular box show the median of feeder voltage. The voltage rise and drop problems can be well dealt with by the proposed method in distribution network scheduling.
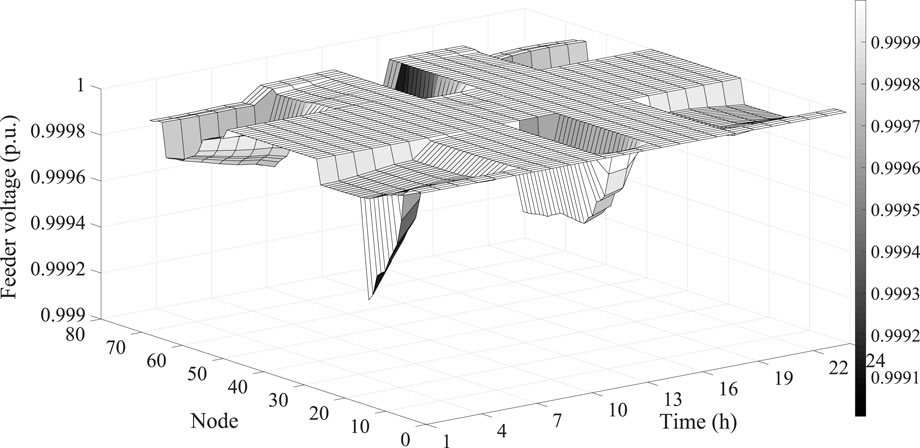
FIGURE 4. The feeder voltage of the test system over 24-h.
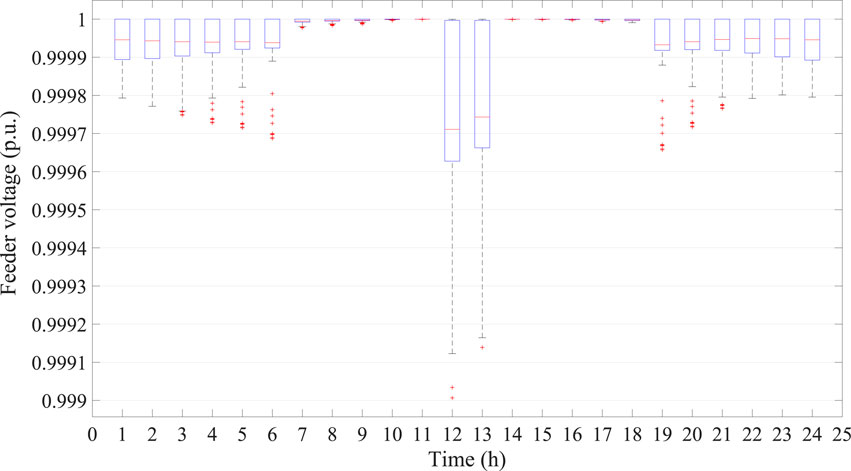
FIGURE 5. The feeder voltage box of the test system over 24-h.
The optimal capacity of MESS is 2.2690 MW, and power factors of PV inverter and MESS are shown by Figure 6, which are in the range from 0.9 to 1.0, satisfying the operation condition of the distribution network. The hourly SOC and charging/discharging location of MESS for distribution network are given by Figure 7, satisfying the operation constraints shown by equation. 21. Additionally, the optimal time-of-use price, charging/discharging power of MESS, output of PV inverter, DR and power loss are given in Table 1.
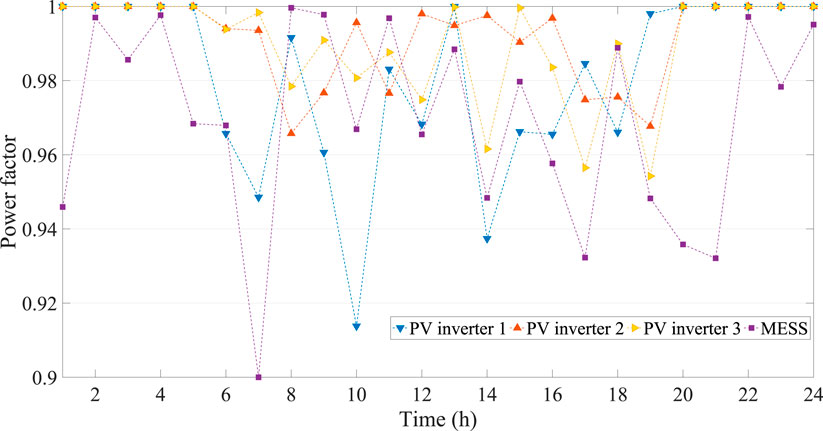
FIGURE 6. The power factor of PV inverter and MESS over 24-h.
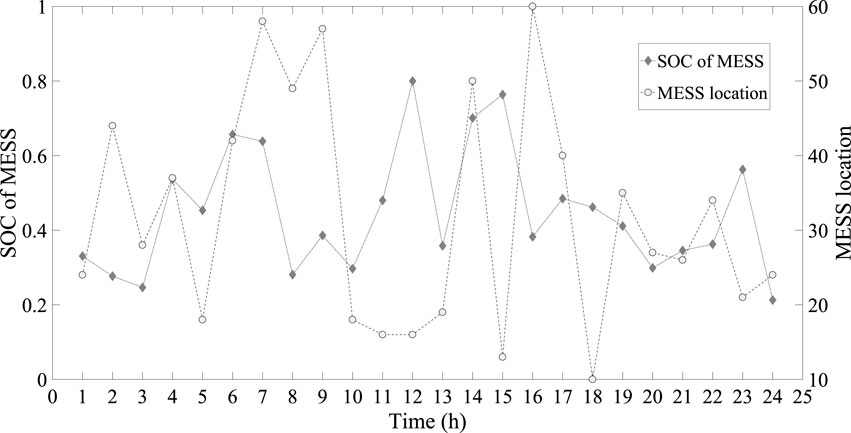
FIGURE 7. The SOC and charging/discharging bus of MESS.

TABLE 1. The optimal hourly time-of-use price, charging/discharging power of MESS, output of PV inverter, DR and power loss obtained by the proposed method.
It is seen from Table 1 that the PV power can significantly affect time-of-use price. Actually, the correlation coefficient (CC) and the hypothesis of no correlation (HnC) between λP(t) and PPV(t) are respectively −0.9091 and 7.8981e-10, and the CC and the HnC between λQ(t) and QPV(t) are respectively −0.7454 and 2.9221e-5. These results indicate that the time-of-use price and the PV penetration have a significantly negative correlation. In addition, the PV penetration can also decrease active power loss, where the CC and the HnC between the power loss and the PV inverter active power penetration are −0.8947 and 3.7190e-9, respectively. The CC and the HnC between power loss and PV inverter reactive power penetration are −0.6856 and 2.1749e-4, respectively. On the other hand, the optimal hourly generation of PV inverter is not its upper bound as shown by Figure 8. The detailed comparisons among the optimal output, forecasted value and bounds of PV inverter are given by Figure 9.
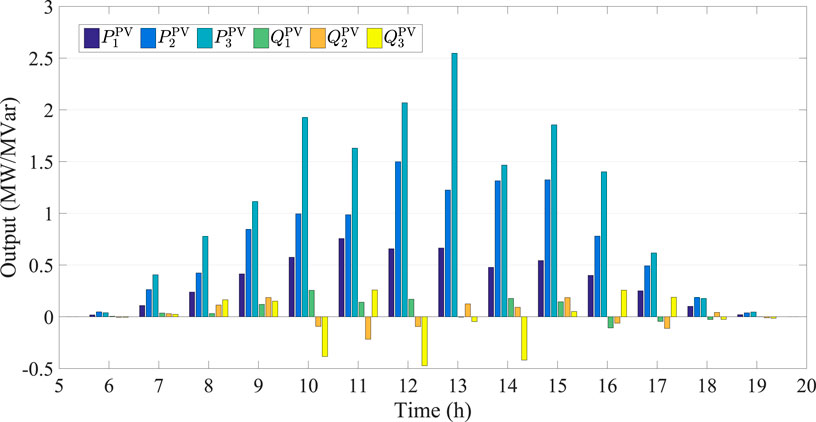
FIGURE 8. The optimal active and reactive power of PV inverter.
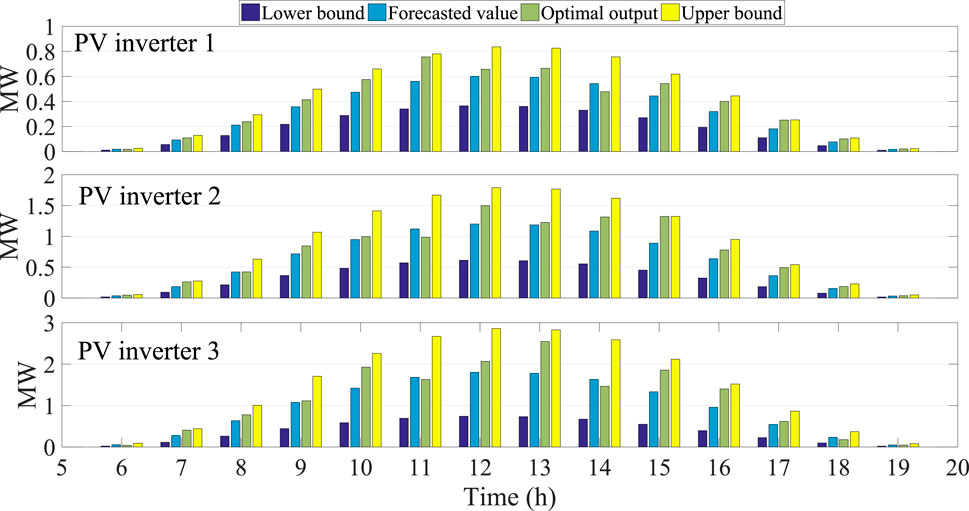
FIGURE 9. The optimal output, forecasted value, and lower and upper bound of PV inverter over 24-h.
From Figure 9, it is interesting to find that the optimal ourtput of PV inverter is higher than the forecasted value in most of the cases. This is because the fact that a large scale integration of PV power can reduce operation cost of distribution network, but it will also bring a high uncertainty, and increase additional operation risk for distribution network. In order to show the relationship more intuitively, Table 2 lists the optimal hourly EPNS and EPC of PV inverter and DR.
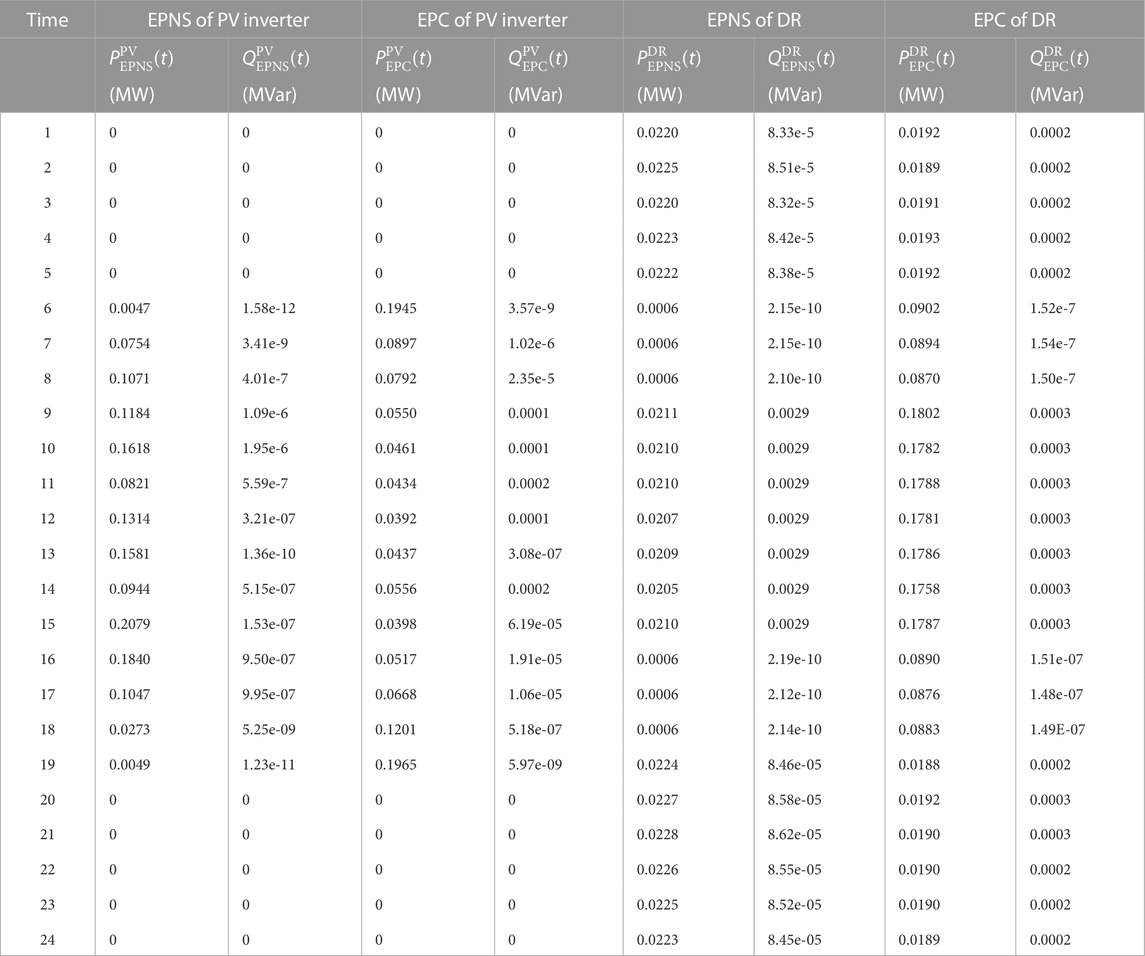
TABLE 2. The hourly EPNS and EPC of PV inverter and DR.
In comparison with the results listed in Tables 1, 2, we find that the EPNS is with a positive relationship with PV inverter, where the CC and the HnC between
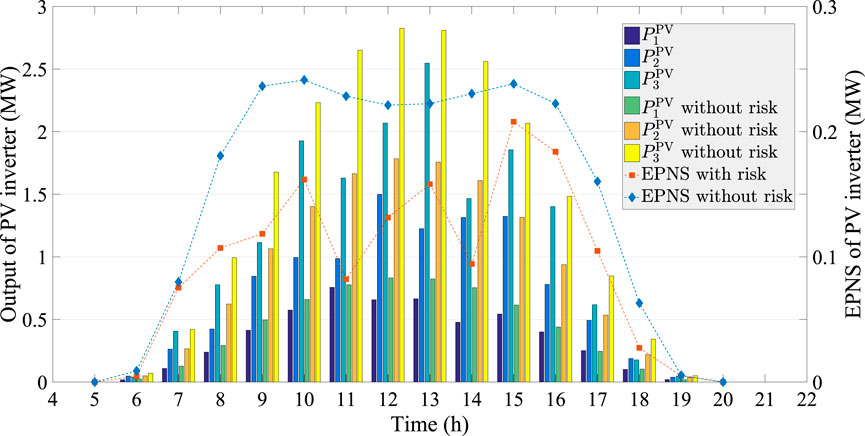
FIGURE 10. The hourly output and EPNS of PV inverter with and without uncertain evaluation.
From Figure 10, we can see that the hourly penetration level of PV power without considering risk is much higher than that of our proposed model. The total output of PV inverter without risk is 40.5046 MW, which is 27.6548% higher than 31.7298 MW of the proposed model with risk. However, the EPNS of the proposed model is 1.4621MW, which is 59.9549% lower than 2.3387 MW obtained without considering the uncertain risk. In addition, the optimal outputs of DR with and without considering uncertain evaluation are given by Figure 11.
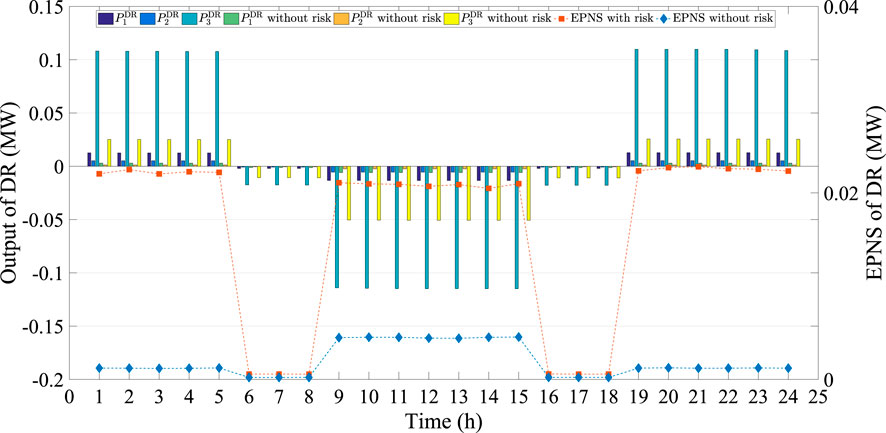
FIGURE 11. The hourly power and EPNS of DR with and without uncertain evaluation.
The results illustrated in Figure 11 show that the hourly DR and EPNS obtained by our proposed model are both higher than these without considering uncertain risk. This is because that a high PV power comes to a low electricity price, and very few power participates in DR. On the contrary, a relatively low penetration of PV power leads to a high electricity price, and more power would like to participate in DR. These comparisons further demonstrate the proposed model can well coordinate active and reactive power of multiple dispersed resources for flexibility improvement of distribution network under forecasting errors.
7 Conclusion
In this paper, a coordinated operation of MESS, DR and PV inverter is proposed to improve flexibility of distribution network with uncertain PV and DR. We first investigate the effect of active and reactive power coordination to regulate voltage issue, and then the operation spaces of active and reactive power under power factor constraint are derived. After that, the flexibility objective consisting of power loss, operation cost, uncertain risk, DR cost and MESS cost is formulated. The experimental study conducted on the IEEE 69-bus system draws the followings conclusions.
1) The instantaneous penetration level of PV power (4.4378 MW at time 13) can be as high as 111.13% of the load demand (3.9932 MW). Based on the active and reactive power coordination of dispersed resources, the voltage files are in the range from 0.9990 to 0.9999.
2) The uncertain risk caused by forecasting errors of PV inverter and DR should be considered in distribution network operation, where a high PV power or DR power corresponds to a large EPNS value and a small EPC value. The proposed EPNS and EPC indexes show a good performance in evaluating the uncertain risk and determine the optimal PV power and DR power.
3) It is interesting to find that a large PV power can reduce time-of-use price, but limits the DR power. This further verifies the necessity of coordination optimization of multiple dispersed resources to exploit the flexibility for distribution system operation under uncertainty.
Data availability statement
The original contributions presented in the study are included in the article/supplementary materials, further inquiries can be directed to the corresponding author.
Author contributions
YC: Conceptualization, methodology and investigation, Funding acquisition; WL: Writing—review, editing and supervising. Both authors have read and agreed to the published version of the manuscript.
Funding
This work was supported by the Science and Technology Project of Guangzhou Power Supply Bureau of Guangdong Power Grid Corporation (GZHKJXM20190061).
Conflict of interest
Authors YC, and WL were employed by Guangzhou Power Supply Bureau of Guangdong Power Supply Company Ltd.
The authors declare that this study received funding from Guangdong Power Grid Corporation. The funder had the following involvement in the study: data collection and analysis.
Publisher’s note
All claims expressed in this article are solely those of the authors and do not necessarily represent those of their affiliated organizations, or those of the publisher, the editors and the reviewers. Any product that may be evaluated in this article, or claim that may be made by its manufacturer, is not guaranteed or endorsed by the publisher.
References
Abdeltawab, H. H., and Mohamed, Y. A.-R. I. (2017). Mobile energy storage scheduling and operation in active distribution systems. IEEE Trans. Industrial Electron. 64, 6828–6840. doi:10.1109/tie.2017.2682779
Adib, R., Murdock, H., Appavou, F., Brown, A., Epp, B., Leidreiter, A., et al. (2015). Renewables 2015 global status report. Paris: REN21 Secretariat.
Ahmed, H. M., Sindi, H. F., Azzouz, M. A., and Awad, A. S. (2021). Optimal sizing and scheduling of mobile energy storage toward high penetration levels of renewable energy and fast charging stations. IEEE Trans. Energy Convers. 37, 1075–1086. doi:10.1109/tec.2021.3116234
Baran, M. E., and Wu, F. F. (1989). Optimal capacitor placement on radial distribution systems. IEEE Trans. Power Deliv. 4, 725–734. doi:10.1109/61.19265
Chen, J., Qi, B., Peng, K., Li, Y., and Zhao, Y. (2020). Conditional value-at-credibility for random fuzzy wind power in demand response integrated multi-period economic emission dispatch. Appl. Energy 261, 114337. doi:10.1016/j.apenergy.2019.114337
Chen, J., Wu, Q., Ji, T., Wu, P., and Li, M. (2016). Evolutionary predator and prey strategy for global optimization. Inf. Sci. 327, 217–232. doi:10.1016/j.ins.2015.08.014
Chen, J., Zhao, Y., Peng, K., and Wu, P. (2017a). Optimal trade-off planning for wind-solar power day-ahead scheduling under uncertainties. Energy 141, 1969–1981. doi:10.1016/j.energy.2017.11.125
Chen, J., Zhuang, Y., Li, Y., Wang, P., Zhao, Y., and Zhang, C. (2017b). Risk-aware short term hydro-wind-thermal scheduling using a probability interval optimization model. Appl. energy 189, 534–554. doi:10.1016/j.apenergy.2016.12.031
Cortés-Caicedo, B., Avellaneda-Gómez, L. S., Montoya, O. D., Alvarado-Barrios, L., and Álvarez-Arroyo, C. (2021). An improved crow search algorithm applied to the phase swapping problem in asymmetric distribution systems. Symmetry 13, 1329. doi:10.3390/sym13081329
Demirok, E., Gonzalez, P. C., Frederiksen, K. H., Sera, D., Rodriguez, P., and Teodorescu, R. (2011). Local reactive power control methods for overvoltage prevention of distributed solar inverters in low-voltage grids. IEEE J. Photovoltaics 1, 174–182. doi:10.1109/jphotov.2011.2174821
Divshali, P. H., and Söder, L. (2017). Improving hosting capacity of rooftop PVs by quadratic control of an LV-central BSS. IEEE Trans. Smart Grid.
Gao, J., Chen, J., Qi, B., Zhao, Y., Peng, K., and Zhang, X. (2021). A cost-effective two-stage optimization model for microgrid planning and scheduling with compressed air energy storage and preventive maintenance. Int. J. Electr. Power & Energy Syst. 125, 106547. doi:10.1016/j.ijepes.2020.106547
Hashemi, S., and Østergaard, J. (2018). Efficient control of energy storage for increasing the PV hosting capacity of lv grids. IEEE Trans. Smart Grid 9, 2295–2303.
Jeon, S., and Choi, D.-H. (2022). Joint optimization of volt/var control and mobile energy storage system scheduling in active power distribution networks under pv prediction uncertainty. Appl. Energy 310, 118488. doi:10.1016/j.apenergy.2021.118488
Jiao, P., Chen, J., Cai, X., Wang, L., Zhao, Y., Zhang, X., et al. (2021). Joint active and reactive for allocation of renewable energy and energy storage under uncertain coupling. Appl. Energy 302, 117582. doi:10.1016/j.apenergy.2021.117582
Jiao, P., Chen, J., Qi, B., Zhao, Y., and Peng, K. (2019). Electricity price driven active distribution network planning considering uncertain wind power and electricity price. Int. J. Electr. Power & Energy Syst. 107, 422–437. doi:10.1016/j.ijepes.2018.12.005
Kabir, M., Mishra, Y., Ledwich, G., Dong, Z. Y., and Wong, K. P. (2014). Coordinated control of grid-connected photovoltaic reactive power and battery energy storage systems to improve the voltage profile of a residential distribution feeder. IEEE Trans. Industrial Inf. 10, 967–977. doi:10.1109/tii.2014.2299336
Kwon, S.-Y., Park, J.-Y., and Kim, Y.-J. (2019). Optimal v2g and route scheduling of mobile energy storage devices using a linear transit model to reduce electricity and transportation energy losses. IEEE Trans. Industry Appl. 56, 34–47. doi:10.1109/tia.2019.2954072
Li, Y., Sun, Y., Li, K., Zhuang, J., Liang, Y., and Pang, Y. (2021). Analysis and suppression of voltage violation and fluctuation with distributed photovoltaic integration. Symmetry 13, 1894. doi:10.3390/sym13101894
Liu, X., Aichhorn, A., Liu, L., and Li, H. (2012). Coordinated control of distributed energy storage system with tap changer transformers for voltage rise mitigation under high photovoltaic penetration. IEEE Trans. Smart Grid 3, 897–906. doi:10.1109/tsg.2011.2177501
Prabpal, P., Kongjeen, Y., and Bhumkittipich, K. (2021). Optimal battery energy storage system based on var control strategies using particle swarm optimization for power distribution system. Symmetry 13, 1692. doi:10.3390/sym13091692
Preda, S., Oprea, S.-V., Bâra, A., and Belciu, A. (2018). PV forecasting using support vector machine learning in a big data analytics context. Symmetry 10, 748. doi:10.3390/sym10120748
Qu, Z., Chen, J., Peng, K., Zhao, Y., Rong, Z., and Zhang, M. (2021). Enhancing stochastic multi-microgrid operational flexibility with mobile energy storage system and power transaction. Sustain. Cities Soc. 71, 102962. doi:10.1016/j.scs.2021.102962
Saboori, H., and Jadid, S. (2022). Capturing curtailed renewable energy in electric power distribution networks via mobile battery storage fleet. J. Energy Storage 46, 103883. doi:10.1016/j.est.2021.103883
Shayani, R. A., and de Oliveira, M. A. G. (2011). Photovoltaic generation penetration limits in radial distribution systems. IEEE Trans. Power Syst. 26, 1625–1631. doi:10.1109/tpwrs.2010.2077656
Sun, X., Qiu, J., Yi, Y., and Tao, Y. (2021). Cost-effective coordinated voltage control in active distribution networks with photovoltaics and mobile energy storage systems. IEEE Trans. Sustain. Energy 13, 501–513. doi:10.1109/tste.2021.3118404
Tonkoski, R., Lopes, L. A., and El-Fouly, T. H. (2011). Coordinated active power curtailment of grid connected PV inverters for overvoltage prevention. IEEE Trans. Sustain. Energy 2, 139–147. doi:10.1109/tste.2010.2098483
Tonkoski, R., Turcotte, D., and El-Fouly, T. H. (2012). Impact of high PV penetration on voltage profiles in residential neighborhoods. IEEE Trans. Sustain. Energy 3, 518–527. doi:10.1109/tste.2012.2191425
von Appen, J., Stetz, T., Braun, M., and Schmiegel, A. (2014). Local voltage control strategies for PV storage systems in distribution grids. IEEE Trans. Smart Grid 5, 1002–1009. doi:10.1109/tsg.2013.2291116
Wang, Y., Zhang, P., Li, W., Xiao, W., and Abdollahi, A. (2012). Online overvoltage prevention control of photovoltaic generators in microgrids. IEEE Trans. Smart Grid 3, 2071–2078. doi:10.1109/tsg.2012.2222679
Weckx, S., Gonzalez, C., and Driesen, J. (2014). Combined central and local active and reactive power control of PV inverters. IEEE Trans. Sustain. Energy 5, 776–784. doi:10.1109/tste.2014.2300934
Xiang, Y., Han, W., Zhang, J., Liu, J., and Liu, Y. (2018). Optimal sizing of energy storage system in active distribution networks using Fourier–legendre series based state of energy function. IEEE Trans. Power Syst. 33, 2313–2315. doi:10.1109/tpwrs.2017.2779042
Keywords: multiple dispersed resources, mobile energy storage, flexibility improvement, demand response, voltage regulation
Citation: Cai Y and Luo W (2023) Coordinated active and reactive power operation of multiple dispersed resources for flexibility improvement. Front. Energy Res. 11:1133768. doi: 10.3389/fenrg.2023.1133768
Received: 29 December 2022; Accepted: 03 January 2023;
Published: 17 January 2023.
Edited by:
J. J. Chen, Shandong University of Technology, ChinaReviewed by:
Feng Liang, Shandong University of Technology, ChinaLixiao Wang, South China University of Technology, China
Copyright © 2023 Cai and Luo. This is an open-access article distributed under the terms of the Creative Commons Attribution License (CC BY). The use, distribution or reproduction in other forums is permitted, provided the original author(s) and the copyright owner(s) are credited and that the original publication in this journal is cited, in accordance with accepted academic practice. No use, distribution or reproduction is permitted which does not comply with these terms.
*Correspondence: Ying Cai, c2RjaGVuamVycnlAMTI2LmNvbQ==