- 1School of Energy and Environmental Engineering, Hebei University of Technology, Tianjin, China
- 2Hebei Provincial Key Laboratory of Thermal Science and Energy Clean Utilization Technology, Tianjin, China
District heating has always been regarded as a convenient and environmentally friendly heating method. However, the district heating process involves a considerable amount of wasted energy. To improve the operational strategies of heating networks and heating quality, reduce energy waste, promote the sustainable development of resources and cities, it is necessary to investigate the dynamic characteristics of pipe networks. This paper describes the dynamic characteristics of a pipe network in which the intermittent operation of the primary pipe network were adjusted. The effects of the dynamic characteristics of the pipe network on the indoor temperature of households are numerically analyzed. When the primary network stops and the secondary network continues working, the indoor temperature begins to decrease, slowly at first, and then more quickly. The indoor temperature of households in the system remains unchanged for a short period before starting to drop with the increase of the time. It takes about 150–245 min for the indoor temperature in the heating system to drop to 16°C. The smaller the room area, the larger the area of the envelope structure, and the faster the room temperature drops. The higher the intermittent heating temperature, the longer it takes for the indoor temperature to drop to 16°C. An intermittent heating temperature of 5°C or above ensures that every household in the heating system retains an indoor temperature above 16°C after 2 h.
1 Introduction
District heating has always been regarded as a convenient, economical and environmentally friendly form of heating, and it has gradually developed into an important feature of cities and society (He et al., 2009; Zhu et al., 2015; Zheng et al., 2020; Wang and Zhao, 2022). However, the development of operation management and control strategies of district heating systems has been relatively slow, due to complex heating system structures, changes in household demand, seasonal considerations, and other factors which lead to changeable operating conditions of heating networks. Operating a heating system in a non-optimal manner not only affects the comfort of end-users but also increases the energy consumption of the system. Ideally, any operating strategy should reflect the characteristics of the heating system itself. In addition, the economic rationality of heating systems and the optimal use of non-renewable energy are matters of great importance for the sustainable development of resources and cities. To this end, researchers have investigated adjustment strategies for district heating network systems (Shafieian et al., 2019; Rehman and Ali, 2020; Sommer et al., 2020; Zhong et al., 2020; Hering et al., 2021; Wei et al., 2021; Zhang et al., 2021). Pirouti et al. (2013) reported a method of minimizing energy consumption and cost in the case of a district heating network in South Wales, United Kingdom. An operating strategy was adopted in which overall operating conditions of the network were adjusted and optimized based on research results, to obtain an optimal flow rate and supply temperature. Kuosa et al. (2013) described a method of mass flow control and proposed its performance with that of traditional techniques. The new technology delivered a pipeline flow rate of 46%, a pressure loss of 25%, a pumping power of 12%, and a return water temperature lower than that obtained by traditional methods. A dynamic heat transfer model is established by Li and Zhang (2018). The results are that the delay time of the ordinary wall is higher than the wall implanted with heat pipes by 1.38 h. A novel hybrid stochastic/interval optimization for an integrated heating and power system (IHPS) day-ahead scheduling is proposed by Li et al. (2022). To further improve the system economic, the price-based integrated demand response (IDR) under the background of multi-energy coupling is introduced and the characteristics of energy substitution and load timing transfer are modeled. Yokoyama et al. (2017) proposed an optimization method for the heating and cooling systems of an exhibition center space and found that the method was effective in terms of the optimality of the solution and the calculation time. Canet et al. (2021) described a method that takes into account natural gas and electricity prices, as well as local characteristics of heating demand, and which can be used to estimate the heat demand of different types of residential buildings. This method has already been adopted in some European cities, though its application remains limited to residential buildings at present. Redko et al. (2021) investigated the effects of network design and operating parameters on the optimal temperature and flow selection of loop water in a district heating system. Their results demonstrated that the cost of quantitative adjustment is lower than that of qualitative adjustment. However, a combination of qualitative and adjustments resulted in a decrease in consumption of up to 50% during the transition period of the heating season. Olympia and Anastassios (2007) proposed a new type of dual-source energy supply system for buildings involving heat pump energy storage which successfully solved the problem of the unstable operation of single-energy systems, and also addressed issues of low reliability, and high investment and operating costs associated with existing multi-source systems. The operating cost of their proposed system was 55% of the cost of a conventional–air–source heat pump system. Yin et al. (2012) developed an SAHP (single air source heat pump) system that uses a three-medium composite heat exchanger as an evaporator and makes full use of solar and wind energy. Their reported results show an effective reduction in system energy consumption. The electronic cooling are experimentally investigated by Rehman and Ali (2018). The experimental results revealed that base temperature of the heat sink is reduced as the volume fraction of PCM is increased.
The above literature focused on the overall improvement of the energy supply system and the conversion of heating energy by means of changes in the operation management and control strategies of the heating system. There are few studies to date on adjusting the heating network operation strategy to achieve twin goals of reduced energy consumption and sustainable urban development. For small district heating networks, the improvement method of the pipe network operation strategy has practical application value. In this study, the dynamic changes in the indoor temperature of household are investigated. The conclusions are of great significance for the sustainable development of resources and cities.
2 Engineering model
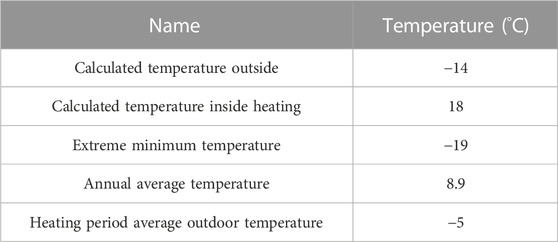
The dynamic characteristics of the pipe network were investigated in Chengde, Hebei province, China. The heating period was 150 days, from October 30th to March 30th. The main heating parameters are shown in Table 1.
2.1 Parameters of the heating station
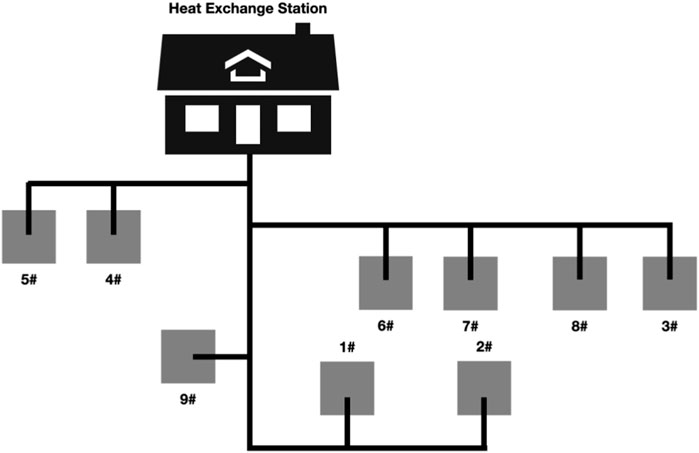
Yinduhaitang Garden District in Chengde was this research. The district contains nine high-rise buildings. The heating system in each building consists of three independent systems. The research area comprises households on the first to ninth floors. Household information for the low loop is shown in Table 2. The system is arranged as a directly buried branched pipe network. The heating system of the outdoor pipe network was illustrated in Figure 1.
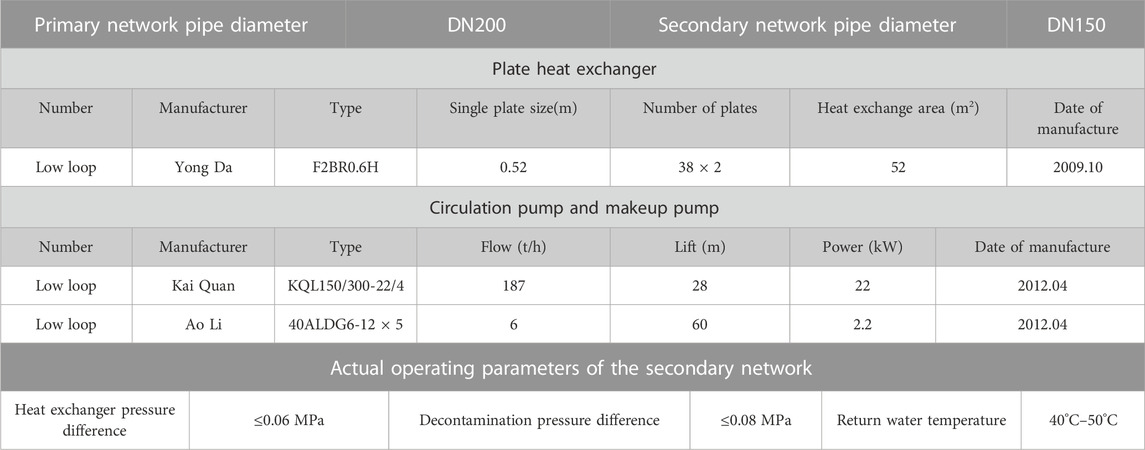
The equipment details and operating parameters of the heating substation are shown in Table 3.
2.2 Mathematical model of heating system
The thermal dynamic characteristics of the heating system were based on dynamic mathematical models (Roy et al., 2022). An existing, indirectly-connected, district heating system in Chengde City was used as a research object. The secondary-side pipe network between the outlet of the heating substation and the inlet of the heating system was analyzed.
2.2.1 Dynamic mathematical model of heating substation
A mathematical model of the heating substation was established (Wang and Dong, 2021). For the purposes of this study, a plate heat exchanger was used in the heating substation, and the thermal characteristics of the plate heat exchanger were described by a heat balance equation expressing both sides of the heat exchanger. The heat dissipation from the warped fins of the heat exchanger was ignored, because the heat capacity of the heat exchanger fins itself is small and the overall performance of heat preservation measures was good. According to the lumped heat capacity method, it is assumed that the internal temperature gradient of the heat exchanger remains negligible during the transition process, and the temperatures of the primary and secondary sides of the heat exchanger are considered to be uniform. The heat flowing into the primary side of the heat exchanger is equal to the sum of the heat flowing out of the secondary side and the heat stored on the secondary side. The mathematical equation for the secondary side of the heat exchanger can now be obtained.
The heat input from the primary side of the heat exchanger is:
The heat output from the secondary side of the heat exchanger is:
The heat stored on the secondary side of the heat exchanger is:
According to the heat balance equation:
where,
2.2.2 Radiator model
According to the radiator mechanism, a radiator model of the dynamic heat transfer can be mathematically established. The model is simplified as follows: radiator model is considered in a state of hydraulic equilibrium and all radiators in every household are considered (Rehman and Ali, 2018). The radiator equation can now be written as
where,
Through the actual period of operation, the daily adjustment mode of the heating system was as follows:
When the outdoor temperature was higher than 8
The supply water temperature of the secondary pipe network was determined by the weather forecast and the daily average outdoor temperature. The supply water temperature adjustment interval of the secondary network was 1 day, and the flow adjustment interval was 7 days.
3 Results and discussion
The dynamic characteristics of the heating system were numerically investigated by adjusting the primary and secondary pipe networks. The indoor temperatures of buildings 4#, 9#, and 3# were recorded, to reveal any effects of distance from the heating system. The proximal-end, mid-end and distal-end households are 4#, 9#, and 3#, respectively.
3.1 Dynamic characteristics of indoor temperature in proximal-end households
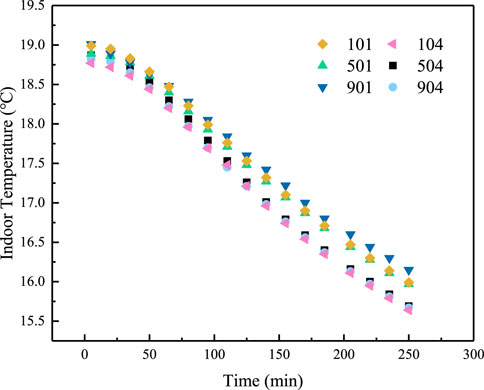
Figure 2 shows variations in indoor temperature over time in building 4#. When the primary network stops, households continue to maintain a thermal equilibrium state for a time period of about 20 min. The reason is that the higher-temperature hot water in the secondary pipe network still provides heat for the households. In addition, household interior items such as furniture act as a heat storage mechanism and forms a new heat source to dissipate the indoor heat. Therefore, the indoor temperature does not drop immediately. However, as time passes, the heat supply is less than the heat dissipation. The indoor temperature begins to decrease, gradually at first, and then more quickly, so that the indoor temperatures of households 104, 504, and 904 dropped to 16
The indoor temperature change trend is basically the same households. The reason is that the exterior structure and indoor area of households on different floors of the same building are similar. The heat load and heat capacity of the households are also similar. The heat dissipation from the radiator and its room location to the outside is the same, when the effect of heat transfer between rooms is ignored. However, there are differences in the indoor temperatures of different households on the same floor.
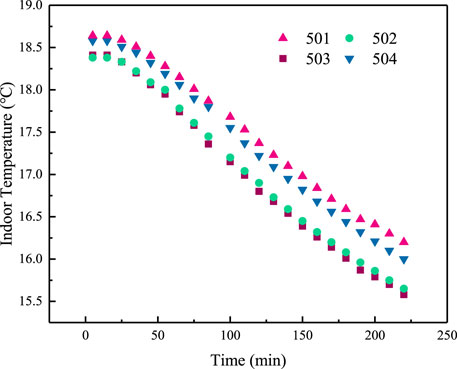
Variations in indoor temperature over time in households on the same floor are illustrated in Figure 3. Households 501–504 in building 4# were chosen. Households 501 and 504 are situated on the south side of the building, and have areas of 150 and 133 m2, respectively. Households 502 and 503 are on the north side, with areas of 123 and 120 m2, respectively.
Differences in the indoor temperature drop rate of different households can be seen in Figure 3. For north-side households 502 and 503, the room temperature drop rate is similar. The locations, indoor areas and external surface areas of these two households are similar. So their heat capacities are also similar. The indoor temperature drops from the initial temperature to 16
3.2 Dynamic characteristics of indoor temperature in mid-end households
Figure 4 shows indoor temperature changes for all study households on the fifth floor of building 9# when the primary network was disconnected and the secondary network continued to operate.
The indoor areas of households on the fifth floor are different. The area of household 501 is 126 m2, and the areas of households 502–504 are 90 m2. Figure 4 shows that the indoor temperature of all households first remains constant for a period of about 20 min. The indoor temperature then gradually decreases with time. The indoor temperature reduction rates of households are also different. The larger heat capacity of 501 results in a slower indoor temperature reduction rate. The indoor temperature of this household drops to 16
3.3 Dynamic characteristics of indoor temperature in distal-end households
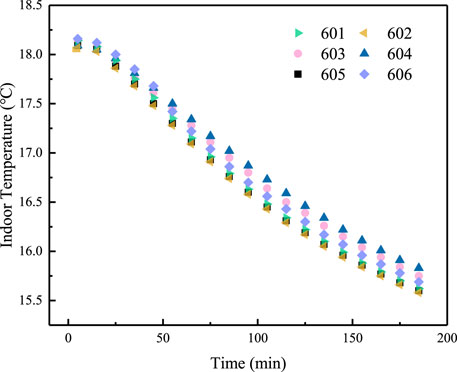
Figure 5 shows the dynamic characteristics of indoor temperature for every household in the distal end. For study purposes, the sixth floor of building 3#, which is furthest from the heating station, was chosen. Table 4 presents the parameters for households 601–606.
Figure 5 shows that the indoor temperature of every household on the 6th floor of building 3# remains unchanged for 15 min. Compared with proximal-end and mid-end households, the time is shortened by about 5 min. The indoor temperature of every household gradually decreases with the increase of the time. The area of every household is small, and the heat capacity of the more proximal households is also smaller. The household heat capacities are the same, and those households exhibit a similar trend of room temperature change. The reason is that households have similar exterior structure area. In those households, the smallest room area—602 and 605—the indoor temperature falls to 16
3.4 Effects of intermittent heating temperature on time of indoor temperature
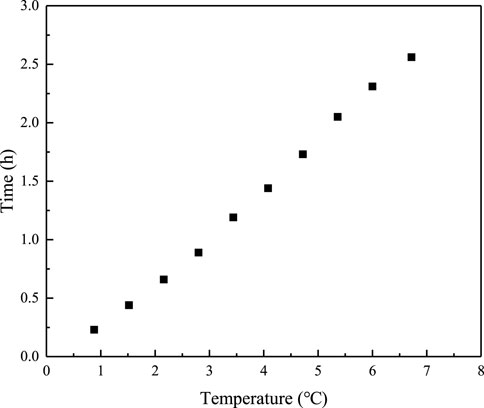
Figure 6 shows effects of intermittent heating temperature on the time of the indoor temperature of households to drop to 16
As the indoor temperature of the household increases, the time it takes for the indoor temperature of the household to drop to 16
Based on the above analysis, when the primary network of the heating system stops, but the secondary network continues to work, the indoor temperature reduction rate of every household is gradually decreased, and each household can maintain indoor temperature for longer period. Different households in terms of the heat capacities of their radiators, as well as their interior furniture, and it results in different indoor temperature reduction rates during the heat dissipation. The smaller the heat capacity, the higher the rate of indoor temperature reduction.
In the applications, the intermittent heating of the circulating water pump of the secondary network is often used to ensure that the heating temperature is not less than 8
4 Conclusion
The dynamic characteristics of the secondary pipe network under the conditions of the intermittent operation adjustments of the primary pipe network are theoretically investigated in this paper. Some conclusions are as follows:
1) When the primary network stops and the secondary network continues working, the indoor temperature of the households falls, gradually at first, and then more quickly. It took between 150 and 245 min for the indoor temperature of every household in the heating system to drop to 16
2) The smaller the room area, the faster the room temperature declines. When the areas of households are on the same floor, the room temperature drops to 16
3) The higher the intermittent heating temperature, the longer it takes for the indoor temperature to drop to 16°C. When the difference of the intermittent heating temperature is 1°C, the time of household temperature to fall to 16
Data availability statement
The original contributions presented in the study are included in the article/supplementary materials, further inquiries can be directed to the corresponding authors.
Author contributions
YC: methodology, Software, Validation, Writing—review, editing, Writing—original draft, Investigation. XW: Methodology, Software, Validation, Writing—review. RD and HY: Methodology, Software, Validation, Writing—review and editing, modifying—original draft, Investigation, Funding acquisition. SL: Writing review and editing, Writing original draft, Investigation.
Funding
We gratefully acknowledge the financial support of China National Nature Science Funds (Support No. 12042211), the Hebei National Nature Science Funds (No. A2022202010), Tianjin Science and Technology Project (No. 22YDTPJC00200, No. 19YFZCSF00850), Key Research Program Projects of Hebei Province (No. 19274502D) and Industrial Technology Research of Hebei University of Technology (No. ZBYJY201902).
Conflict of interest
The authors declare that the research was conducted in the absence of any commercial or financial relationships that could be construed as a potential conflict of interest.
Publisher’s note
All claims expressed in this article are solely those of the authors and do not necessarily represent those of their affiliated organizations, or those of the publisher, the editors and the reviewers. Any product that may be evaluated in this article, or claim that may be made by its manufacturer, is not guaranteed or endorsed by the publisher.
References
Canet, A., Qa Dr Dan, M., and Jenkins, N. (2021). Heat demand mapping and assessment of heat supply options for local areas-the case study of neath port talbot. Energy 217, 217119298. doi:10.1016/j.energy.2020.119298
Hering, D., Cansev, M. E., Tamassia, E., Xhonneux, A., and Müller, D. (2021). Temperature control of a low-temperature district heating network with model predictive control and mixed-integer quadratically constrained programming. Energy 224, 120140. doi:10.1016/j.energy.2021.120140
Kuosa, M., Kontu, K., Lampinen, M., and Lahdelma, R. (2013). Static study of traditional and ring networks and the use of mass flow control in district heating applications. Appl. Therm. Eng. 54 (2), 450–459. doi:10.1016/j.applthermaleng.2013.02.018
Li, Y., Wang, J., Zhang, Y., and Han, Y. (2022). Day-ahead scheduling strategy for integrated heating and power system with high wind power penetration and integrated demand response: A hybrid stochastic/interval approach. Energy 253, 124189. doi:10.1016/j.energy.2022.124189
Li, Z., and Zhang, Z. (2018). Dynamic heat transfer characteristics of wall implanted with heat pipes in summer. Energy Build. 170, 40–46. doi:10.1016/j.enbuild.2018.03.071
Olympia, Z., and Anastassios, S. (2007). Optimization of thermal performance of a building with ground source heat pump system. Energy Convers. Manag. 48 (11), 2853–2863. doi:10.1016/j.enconman.2007.07.012
Pirouti, M., Bagdanavicius, A., Ekanayake, J., Wu, J., and Jenkins, N. (2013). Energy consumption and economic analyses of a district heating network. Energy 57 (8), 149–159. doi:10.1016/j.energy.2013.01.065
Redko, I., Ujma, A., Redko, A., Pavlovskiy, S., and Burda, Y. (2021). Energy efficiency of buildings in the cities of Ukraine under the conditions of sustainable development of centralized heat supply systems. Energy Build. 247 (15), 110947. doi:10.1016/j.enbuild.2021.110947
Rehman, T., and Ali, H. (2018). Experimental investigation on paraffin wax integrated with copper foam based heat sinks for electronic components thermal cooling. Int. Commun. Heat Mass Transf. 98, 155–162. doi:10.1016/j.icheatmasstransfer.2018.08.003
Rehman, T., and Ali, H. (2020). Thermal performance analysis of metallic foam-based heat sinks embedded with RT-54HC paraffin: An experimental investigation for electronic cooling. J. Therm. Analysis Calorim. 140, 979–990. doi:10.1007/s10973-019-08961-8
Roy, A., Chakravarty, P., and Roy, P. (2022). Robust control of a central heating system using a cascade controller based on quantitative feedback theory. IFAC Pap. 55 (1), 866–871. doi:10.1016/j.ifacol.2022.04.142
Shafieian, A., Khiadani, M., and Nosrati, A. (2019). Strategies to improve the thermal performance of heat pipe solar collectors in solar systems: A review. Energy Convers. Manag. 183, 307–331. doi:10.1016/j.enconman.2018.12.115
Sommer, T., Sulzer, M., Wetter, M., Sotnikov, A., Mennel, S., and Stettler, C. (2020). The reservoir network: A new network topology for district heating and cooling. Energy 199, 117418. doi:10.1016/j.energy.2020.117418
Wang, J., and Zhao, T. (2022). Medium dynamic diffusion characteristics in the pipeline network of variable flow HVAC system towards online decoupling control oriented. Energy Build. 258, 111827. doi:10.1016/j.enbuild.2021.111827
Wang, W., and Dong, Z. (2021). Economic benefits assessment of urban wind power central heating demonstration project considering the quantification of environmental benefits: A case from northern China. Energy 225 (15), 120246. doi:10.1016/j.energy.2021.120246
Wei, W. A., Wu, J. W., Mu, Y. F., Wu, J. Z., Jia, H. J., Yuan, K., et al. (2021). Assessment of the solar energy accommodation capability of the district integrated energy systems considering the transmission delay of the heating network. Int. J. Electr. Power and Energy Syst. 130, 106821. doi:10.1016/j.ijepes.2021.106821
Yin, L., Zhou, G., and Jing, M. (2012). Experimental investigation on a solar air heat pump by heat source. Energy Procedia 14, 1590–1594. doi:10.1016/j.egypro.2011.12.1137
Yokoyama, R., Kitano, H., and Wakui, T. (2017). Optimal operation of heat supply systems with piping network. Energy 137, 888–897. doi:10.1016/j.energy.2017.03.146
Zhang, M. F., Gong, G. C., and Zeng, L. W. (2021). Investigation for a novel optimization design method of ground source heat pump based on hydraulic characteristics of buried pipe network. Appl. Therm. Eng. 182 (5), 116069. doi:10.1016/j.applthermaleng.2020.116069
Zheng, W., Zhang, Y., Xia, J., and Jiang, Y. (2020). Cleaner heating in northern China: Potentials and regional balances. Resour. Conservation Recycl. 160 (15), 104897. doi:10.1016/j.resconrec.2020.104897
Zhong, W., Chen, J., Zhou, Y., Yu, Z., and Lin, X. (2020). Investigation of optimized network splitting of large-scale urban centralized heating system operation. Energy Rep. 6, 467–477. doi:10.1016/j.egyr.2020.02.012
Zhu, J. L., Hu, K. Y., Lu, X. L., Huang, X. X., Liu, K. T., and Wu, X. J. (2015). A review of geothermal energy resources, development, and applications in China: Current status and prospects. Energy 93, 466–483. doi:10.1016/j.energy.2015.08.098
Nomenclature
Keywords: district heating, dynamic characteristics, numerical calculation, indoor temperature, pipe network
Citation: Chen Y, Wang X, Yang H, Duan R and Li S (2023) Effects of dynamic characteristics of a pipe network on indoor temperature of households. Front. Energy Res. 11:1120184. doi: 10.3389/fenrg.2023.1120184
Received: 09 December 2022; Accepted: 06 February 2023;
Published: 15 February 2023.
Edited by:
Xiaohu Yang, Xi’an Jiaotong University, ChinaReviewed by:
Yabo Wang, Tianjin University of Commerce, ChinaNadezda Slavinskaya, Society for Plant and Reactor Safety (GRS), Germany
Hongxin Wang, Technical University of Munich, Germany, in collaboration with reviewer NS
Copyright © 2023 Chen, Wang, Yang, Duan and Li. This is an open-access article distributed under the terms of the Creative Commons Attribution License (CC BY). The use, distribution or reproduction in other forums is permitted, provided the original author(s) and the copyright owner(s) are credited and that the original publication in this journal is cited, in accordance with accepted academic practice. No use, distribution or reproduction is permitted which does not comply with these terms.
*Correspondence: Hua Yang, eThoOEAxNjMuY29t; Runze Duan, ZHVhbnJ1bnplQGhlYnV0LmVkdS5jbg==
 Yadong Chen1
 Runze Duan