 Heyang Sun1
 Chao Yang
 Yingli Zhang
94% of researchers rate our articles as excellent or good
Learn more about the work of our research integrity team to safeguard the quality of each article we publish.
Find out more
ORIGINAL RESEARCH article
Front. Energy Res., 03 February 2023
Sec. Smart Grids
Volume 11 - 2023 | https://doi.org/10.3389/fenrg.2023.1118109
This article is part of the Research TopicTransactive Energy and Blockchain Approaches to Integrate Distributed Energy ResourcesView all 5 articles
With the proposal of the two-carbon goal, energy conservation and emission reduction will become the focus of China’s energy system in the future for a long time to come. The establishment of a complete and efficient carbon traceability system will play an important role in promoting carbon emission reduction in the power system. Based on blockchain, this paper uses the consensus mechanism, time stamp, decentralization features, smart contract and other functions of blockchain, combined with the power flow calculation and the characteristics related to carbon emission and active power of the generator set, to obtain the corresponding carbon emission intensity of the generator set and carbon flow rate. It realizes the calculation and tracing of carbon emission flow in power distribution network and ensures the reliability of carbon traceability results, high efficiency of information transmission and transparency of traceability process. Firstly, based on the characteristics of the master-slave multi-chain structure in the consortium chain, In this paper, high-voltage substation nodes are the main chain nodes, and carbon flow tracing and calculation are carried out for the associated low-voltage substations, and the information of high-voltage or low-voltage substation nodes is guaranteed to be tamper-free through the hash anchoring method. The master-slave multi-chain model adopted in this paper is that the main chain adopts EA-DPoS (Evaluation and Agent-DPoS) algorithm, the slave chain adopts improved PBFT algorithm, and the comprehensive evaluation and reward and punishment mechanism are introduced to complete the consensus. Secondly, considering the security requirements of the power system data and the fact that some nodes of the distribution network do not have powerful computing resources comparable to those of the power grid company or major nodes, this paper encrypts and decrypts relevant data in the main chain node by combining the smart contract of blockchain. Meanwhile, cloud service providers with computing resources are responsible for generator power distribution combined with power flow calculation and carbon emission intensity calculation of the generator set. The power grid company adopts the cloud computing framework based on the double check mechanism to calculate the carbon flow rate while verifying the correct calculation results of the cloud service provider, and finally realizes the safe and accurate tracing of the carbon flow of the distribution network.
Global warming is a major environmental problem facing mankind in the 21st century. With the rapid economic development and increasing demand for energy, the environmental problems caused by energy consumption are becoming more and more prominent. Currently, more than 80% of global energy consumption relies on fossil energy sources such as coal, oil and natural gas, and greenhouse gas (mainly carbon dioxide) emissions from fossil energy combustion are the most important cause of global warming (Khamis and Chen, 2022), posing a great threat to the sustainable development of human society.
Driven by “carbon peaking and carbon neutrality goals,” the research on carbon emission (carbon emission for short) of energy system has been attached great importance (Apergis and Payne, 2010; Lippke et al., 2012; Choi et al., 2013; Yan et al., 2017; Sun et al., 2018; Chen et al., 2021). China, as a major energy country, has taken the lead in the international community to actively develop clean energy, increase the proportion of clean energy in energy consumption, take active measures to promote energy conservation and emission reduction, promote low-carbon economic development, and achieve energy diversification and sustainable development, etc. In September 2020, China formally proposed the “carbon peaking and carbon neutrality goals” at the 75th session of the UN General Assembly. The “double carbon” target is time-critical and tasking, and also faces problems and challenges in terms of policy regulation, industry, market and trading system. In this context, the power system, as an important energy sector, must accurately analyze and trace the carbon emissions in the power production process in order to promote the “double carbon” target and achieve the energy saving and emission reduction targets of the power system.
The development of communication technology has promoted the possibility of rational utilization and scientific regulation of energy, among which blockchain technology has unlimited potential and plasticity in the electric energy industry. In recent years, many scholars have carried out rich research work on energy blockchain (Chen et al., 2022). In terms of application value analysis, existing literatures demonstrate the trust value of blockchain in energy system scenarios such as distributed energy trading (Ai et al., 2019), EV charging management (Ping et al., 2021) and distributed scheduling (Luo et al., 2021). In terms of application scheme design, some scholars have developed energy blockchain applications such as distributed power trading (Esmat et al., 2021; Yang et al., 2021), comprehensive energy trading, and virtual power plant energy management (Luo et al., 2019). Literature (Li et al., 2018; Jian et al., 2019) establishes the alliance blockchain for energy trading, proposes the credit risk management method of distributed energy trading market based on blockchain, and designs the distributed power trading system of active distribution network based on blockchain. The literature (Ke et al., 2020) analyzes the applicability of blockchain technology in the energy and power industry, and then proposes an energy blockchain application system architecture, where the blockchain core technology platform layer can realize the interconnection of multiple blockchains with the support of cross-chain interaction and other technologies, analyzes the current technical barriers in the implementation of blockchain technology in the energy industry, and puts forward targeted development suggestions. The literature (Yuan et al., 2021) utilizes the cryptographic algorithm, multicenter peer-to-peer architecture, and distributed multi-party consensus protocol of blockchain technology to realize the security, transparency, traceability, and immutable property of electricity data transaction business with the framework of Fabric consortium blockchain of Super Ledger project, which shows comprehensive functional and security advantages compared with the traditional data transaction system. The literature (Hui et al., 2022) suggests that blockchain is decentralized, tamper-evident, open and transparent, and traceable, which can empower the digital transformation of traditional industries, optimize business processes, reduce operational costs, and improve collaborative efficiency, provide a regulatory environment for carbon peaking and carbon neutrality, and build a credible and efficient carbon trading platform and market, which is important to help achieve the goals of carbon neutrality and carbon peaking and the green and high-quality development of China’s economy and society. It is of great significance. The literature (Yin et al., 2019) proposed a blockchain network model for carbon emissions trading and established a smart contract model combined with carbon emissions trading mechanism to realize automatic measurement of carbon emission rights and currencies, which can better reflect the carbon emission trading demands of market participants, and the blockchain technology can guarantee the secure storage and interaction of information, further restrain market participants and promote the goal of carbon emission reduction. In the literature (Wei and Xue, 2023), in response to the problems that traditional electricity trading generates excessive carbons and does not follow China’s low-carbon goals, the cross-chain trading model of electricity carbon emission rights in microgrid is proposed by counting and energy blockchain, which significantly reduces carbon emissions while saving operational costs and improving trading efficiency, and provides theoretical support and decision support for optimizing the stability of carbon trading. In order to strengthen the vitality of China’s carbon market and help promote the achievement of carbon peaking and carbon neutrality goals, literature (Su et al., 2022) proposed a two-level hybrid blockchain carbon emission trading framework, which carries out the allocation of government carbon quotas in the public blockchain and shares carbon emission data in the coalition blockchain to protect private data, and realizes the information transmission between the public blockchain and the coalition blockchain based on the Polkadot protocol, which can reduce the system operation cost, improve the efficiency and information transparency of the transaction, and provide reference and reference for accelerating the marketization of carbon trading.
The macro amount of carbon emission in energy side (Hua et al., 2017) is too large to support the deep study of low-carbon (Sun et al., 2017; Zhi et al., 2021). As a fundamental application of power network analysis, relatively mature power flow calculation models and methods have been formed, and the use of power flow analysis for carbon emission flow calculation already has a certain research foundation. The paper (Kang et al., 2012) proposed the concept of “carbon emission flow” based on the carbon emission transfer generated by power trade in local areas. Literature (Wei et al., 2012; Li et al., 2013) established a carbon flow model based on electric quantity distribution, and the loss was processed according to the electric quantity distribution ratio of lossless network, realizing the complete distribution of carbon emission from source to charge. In reference (Zhou et al., 2012a), key indicators and concepts related to carbon emission calculation were put forward in combination with network analysis technology, and the basic system and framework of carbon flow analysis theory were preliminarily established, bringing new ideas and means for carbon emission calculation of power system. Literature (Zhou et al., 2012b) further analyzed the relationship between carbon emission flow and power flow on the basis of literature (Zhou et al., 2012a), and proposed the basic calculation method of carbon emission flow in power system under the condition of ignoring network loss. Literature (Zhou et al., 2012c) defined three kinds of correlation matrices, corresponding the injected carbon flow of the generator set to the carbon flow of nodes and branches, and revealed the distribution characteristics and transmission and consumption mechanism of carbon emission flow in the power network. Considering that the methods in literature (Zhou et al., 2012a; Zhou et al., 2012b; Zhou et al., 2012c) are all based on lossless networks, they cannot be applied to the actual lossless networks. In view of this, literature (Qun et al., 2022) proposes a precise calculation method of carbon emission flow in power system taking into account network loss. Based on the principle of proportional distribution, power flow distribution matrix is constructed to solve the problem that existing methods are too extensive and cannot accurately realize the allocation of power and carbon flow. In order to make the obtained power flow tracking results more comprehensive and accurate, based on the basic circuit theory, literature (Wen et al., 2022) considers the power flow caused by the parallel admittance of transmission lines and busbars in the process of power flow tracking, and uses node admittance matrix operation to realize the carbon flow tracking of power system.
However, the above studies on carbon flow tracing do not consider that some nodes of the distribution network in the power system do not have enough computing resources to be responsible for the calculation of carbon flow tracing. Distribution network enterprises can outsource distribution network scheduling decision analysis business to cloud service providers, which can effectively solve the problem of inadequate professional technology and save operating costs in hardware and software purchase, system maintenance, site manpower and other aspects (Shun et al., 2011). However, cloud computing requires users to upload data related to computing tasks to the cloud, which makes it possible for cloud service providers to snoop on sensitive information of incremental distribution network enterprises, leading to potential information disclosure risks (Guo et al., 2011). If the leaked information is used for malicious attacks by other subjects, it may cause power safety accidents or direct economic losses (Xie et al., 2010; Choi and Xie, 2016; Hua et al., 2016). Therefore, the first problem that cloud computing technology application needs to solve is privacy protection. Moreover, as an independent interest subject, cloud service providers may negatively treat computing tasks in order to reduce costs (Wang et al., 2011). Therefore, it is necessary to design a verification mechanism for cloud computing results.
Therefore, this paper proposes a distribution network carbon power flow tracing system based on block chain and power flow calculation. It relies on the computing resources of third-party cloud service providers, combines with smart contracts to encrypt and decrypt relevant power data required for power flow calculation, and adopts a cloud computing framework based on double check mechanism. The proposed system can safely and accurately track and trace the carbon emissions from “source” to “load” in the power system, so as to provide data basis for the carbon reduction work of the power system. At the same time, accurate calculation of carbon emissions in the power system is crucial to the reasonable allocation of carbon quota under the current ETS mechanism in China, which will help improve the current ETS mechanism in China and ultimately achieve the goal of carbon peaking and carbon neutrality.
According to statistics, the electric power industry is the main source of carbon emissions in China, and its carbon dioxide emissions account for about 50% of the total carbon emissions of the whole society, and an important direction for the future development of the electric power industry is low-carbon power. In order to further reduce carbon emissions and realize the low carbon development of power system, it is very important to carry out carbon emission statistics. In the power system, the distribution network system is very complex and has a large network topology, and these characteristics bring great challenges to carbon emission tracing.
Based on the above background, this paper proposes a carbon flow traceability system for distribution network based on blockchain and power flow calculation, which is a new type of power network form generated by the deep integration of power flow calculation and Internet technology. The carbon flow traceability system combines the security, transparency and decentralization of blockchain, and uses the interconnection and interoperability between blockchain nodes to record the load, active power output of generators, network topology and other related technical parameters of each node at any moment. In the distribution network of the power system, low-voltage substations cannot obtain the relevant data information of high-voltage substations. Therefore, when we map the substations of the distribution network to the blockchain nodes, the blockchain nodes do not have the same status. In this case, this paper adopts the master-slave multi-chain structure to build the overall architecture. In this paper, the high voltage substation is the main chain node, and the associated low voltage substation is the slave chain node. The data information of low voltage substation is transferred from high voltage substation. For the master-slave multi-chain model, different consensus algorithms are used for the master and slave chains, with the EA-DPoS algorithm selected for the consensus of the master chain and the PBFT algorithm for the slave chain. The main chain node, cloud service provider and power grid company carry out relevant calculation after triggering the preset conditions of the smart contract. The cloud service provider uses the encrypted data provided by the main chain node to apportion the active power output of generator through the power flow calculation to obtain the power component of the generator set corresponding to the node load, branch power and network loss. It calculates the real-time carbon emission intensity of each generator set by using the characteristics that carbon emission is strongly related to the active power output of generator. Finally, after the decryption calculation of the main chain nodes and the verification of the double check mechanism, the power grid company calculates the carbon flow rate component corresponding to each node load, branch power and network loss by combining the power allocation and carbon emission allocation of the generator set, and obtains the final carbon flow tracing result.
Blockchain is divided into public blockchain, private blockchain and consortium blockchain. Public chain is a blockchain with strong openness, which allows anyone to participate in reading, trading and writing. It is completely decentralized, with open and transparent data, and is not controlled by any institution. But the public chain has the disadvantages of high transaction delay, high cost and low efficiency. The transaction speed of private chain is very fast, which is characterized by high efficiency, excellent privacy and low transaction cost. However, private chain is restricted by centralized management, only a few internal people can use it, and the information is not public. The consortium chain absorbs the advantages of both public chain and private chain. Its characteristics between the public chain and the private chain, semi-public ledger, transaction confirmation speed is fast, low cost of accounting, data has a certain privacy. Consortium chain refers to the blockchain which is determined in advance by the participating nodes, and only opens all or part of its functions to the internal members of the alliance. Since the carbon power flow tracing of power distribution network in the power system requires the retrieval and interaction of relevant data, and the public chain with strong openness has the characteristics of data easy to be stolen, and the private chain information is not public to prevent data interaction, this paper adopts the consortium chain to build the carbon traceability blockchain architecture. It can realize “partial decentralization” and certain privacy of data while ensuring fast transaction speed and low transaction cost.
Blockchain technology provides a technical platform for carbon traceability, and this paper adopts a master-slave multi-chain structure for carbon traceability, using a hash-based anchoring method to ensure the tamper-evident information. If the master-slave chain is not adopted, each node needs to store data and encrypt and decrypt calculations, which will increase the computing pressure of some nodes lacking computing resources and reduce the speed of carbon traceability. The some nodes here refer to the slave node corresponding to the low voltage substation in the blockchain. Compared with high-voltage substation, the allocation of resources in low-voltage substation is more limited. Therefore, this paper assigns the task of encryption and decryption of relevant data to high-voltage substation, that is, the calculation task of slave chain node is delivered to the main chain node by using the master-slave chain. The master chain block is responsible for receiving the carbon traceability demand and collecting the load of each node, active power output of generators, network topology and other related technical parameters from the leading slave chains at the current moment, and then calculating the power flow to get the carbon traceability result after triggering the pre-set conditions of smart contract. The slave chain block sends the above data packaged to the master chain node according to the indexing instruction issued by the master chain block, and only the relevant data on the slave chain it is on are packaged into a chain. The slave chain nodes are divided into functional nodes and encryption nodes, and the encryption nodes mainly provide security for the data exchange of the master and slave chains. Smart contracts and consensus mechanisms in the blockchain can establish trust relationships to ensure that the data of carbon traceability is highly credible.
The power flow calculation of carbon tracing is placed in the contract layer, and the power flow distribution matrix can obtain the transmission active power and loss of each node and branch after the decomposition of power generation. The carbon emission flow of the power system is directly related to the power flow. The power of a generating unit and its carbon emission are generated simultaneously, and they are consistent. If the carbon emission corresponding to the generating power is known, it can be apportioned in the same proportion by the active component, so as to obtain the distribution characteristics of unit carbon emissions in each node and branch of the power system and the corresponding component of the carbon flow rate and the carbon flow rate of the part of the network loss borne by the generator set.
Since some nodes in the distribution network do not yet have powerful computing resources comparable to those of the grid company or major nodes, the carbon traceability business of the distribution network is outsourced to a cloud service provider to solve the problem of insufficient computing power of some of its own nodes. Before the carbon flow calculation, the load of each node in the blockchain nodes, the active power output of generators and the network topology need to be determined in advance. After obtaining the traceability-related data, in order to ensure the privacy of the data, the carbon flow traceability data needs to be encrypted and calculated before it can be handed over to the cloud service provider.
In the smart contract, after the condition a of the smart contract is met, the encryption work in response to a is executed. The data involved in encryption are: (n + m)×(n + m) order power flow distribution matrix
In this paper, based on the power system energy saving and emission reduction service scenario and the necessity of carbon traceability requirements under the two-carbon target, the blockchain traceability architecture is divided into five layers: data layer, network layer, consensus layer, contract layer and application layer, as shown in Figure 1.
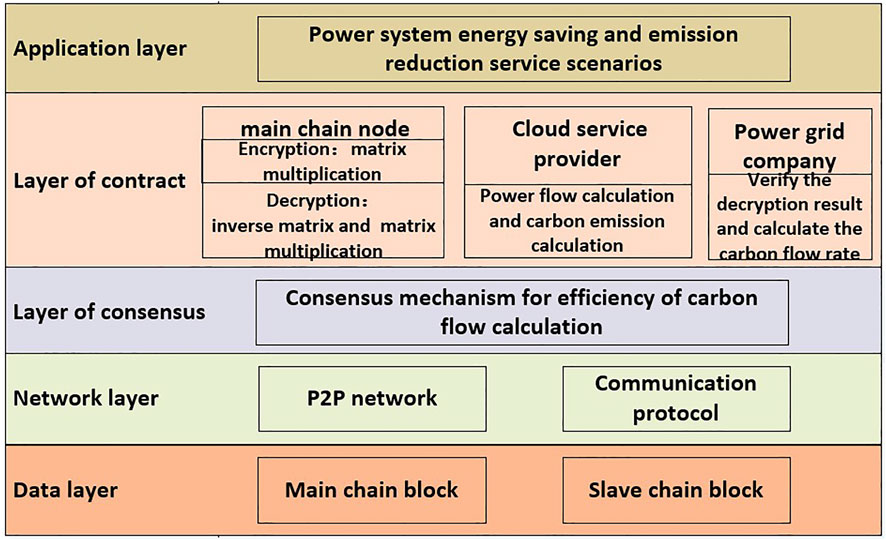
FIGURE 1. Carbon flow tracing system.
In order to ensure that the data on the blockchain can’t be tampered with, bitcoin introduces a single-layer chain structure in blocks. The header is used to store the hash of the preceding block, the Merkle root of the transaction set, etc. And block storage transaction. However, with the expansion of the application scope of blockchain and the heavy tasks handled, every transaction needs to reach a consensus among all nodes, resulting in low efficiency and low credibility, and the task handling capacity per unit time will be greatly limited.
Due to the complexity of power system and the diversity of node types, this paper adopts the master-slave multi-chain structure to build the overall architecture, so as to simplify the model as much as possible, improve the tracing efficiency, and reduce the pressure of the nodes participating in the consensus. The high-voltage substation node is the master chain node, and the low-voltage substation is the slave chain node. The master chain stores the information digest of the slave chain, and traces and calculates the carbon flow of the associated slave chain nodes. In this paper, the method based on hash anchoring is used to ensure the information can’t be tampered with.
The verification block is located on the master chain and is the index block of the slave chain block. Verification blocks are linearly connected in time sequence, and link multiple slave chains to form a master-slave multi-chain model. In order to ensure that the data cannot be tampered with, the master-slave multi-chain model guarantees that for any micro-block in the slave chain, the hash value of the block can always be found in the master chain. This method makes Byzantine nodes need to modify all blocks anchored with a block when modifying a block or transaction. However, if the verification block is saved in the whole network, modifying the verification block almost requires modifying the data of the whole network, and the tampering cost is huge.
For the data layer, the master chain block is mainly responsible for collecting relevant technical parameters from the slave chain after receiving the carbon traceability requirements. The related technical parameters include the load of each node at the current moment, the active and reactive output of the generator, the network topology, resistance and reactance, etc. After triggering the preset conditions of the intelligent contract, the main chain block performs power flow calculation to obtain the carbon flow tracing result. The slave chain block packages the above data to the master chain node according to the index instruction issued by the master chain block, and only packages the relevant data on the slave chain into a chain. Slave chain nodes are divided into functional nodes and security nodes, and security nodes mainly provide security for data exchange between master and slave chains.
In the network layer, information is sent to multiple nodes under the background of the demand of tracing carbon power flow in the power grid. UDP is a connectionless protocol, so it does not need to maintain the connection state. The throughput is not regulated by the congestion control algorithm, and the program structure is relatively simple. The UDP packet has only 8 bytes, and the overhead of the 20-byte packet of TCP is very small. In this paper, UDP protocol is more suitable than TCP protocol, which requires three handshakes to establish a complex connection.
At present, the mainstream consensus algorithms are mostly consensus mechanisms based on single-chain model, and there are many performance bottlenecks, such as PoW. With the increase of computing power, the waste of computing resources will become more and more serious, and the throughput of 7 transactions per second cannot meet the requirements of application scenarios. With the increase of the number of consensus nodes, PBFT algorithm will lead to problems such as excessive communication burden on the network, which will directly affect transaction throughput and lead to transaction delay in the case of bad network conditions. DPoS algorithm is relatively balanced among several mainstream algorithms, which can not only meet the throughput requirements, but also have low requirements for broadband, which is more energy-saving, and can increase the block output speed to the second level.
Aiming at the master-slave multi-chain model, this paper adopts different consensus algorithms for master chain and slave chain. Comprehensive security, reliability and consensus efficiency, the master chain adopts DPoS algorithm for consensus, and the slave chain adopts PBFT algorithm. DPoS consensus mechanism is a consensus algorithm based on voting. Under the DPoS consensus system, the currency holders vote for a certain number of representatives based on the tokens they hold to be responsible for producing blocks and operating the network. The disadvantage of it is that the power is easy to be controlled by a few people, the voting initiative of the currency holders is not high, and it will become “weak center” or “partial decentralization.” Aiming at the shortcomings of DPoS, this paper uses the EA-DPoS consensus algorithm with the following improvements. Compared with the traditional DPoS algorithm, EA-DPoS algorithm adds additional agent nodes and supervisor nodes which are closely related to comprehensive evaluation. Since there is no token in the power system distribution network, we use the agent node under EA-DPoS as the token holder under DPoS. To increase the reliability of the agent nodes, the agent node cluster is built according to the reliability of the main chain nodes and the number of blocks successfully generated. The supervisor node is selected from the consensus node to supervise the block production and verification process of the consensus node. In the distribution network of power system, not only low-voltage substations cannot obtain the same status as high-voltage substations, but also different high-voltage substations are not completely equal. Therefore, we can only select nodes from high-voltage substations to realize traceability. Firstly, the agent node is selected through the PoW “mining” mechanism. The significance of replacing a PoS-like mechanism with a PoW mechanism is that the agent node under the PoW mechanism is filtered and updated each time, as opposed to the unchanged token holder under the previous PoS-like mechanism. Agent nodes under PoW mechanism are constantly updated and changed, thus solving the problem of “partial decentralization” to a certain extent. Then the agent node selects the node set that finally participates in the consensus through the voting mechanism, which is the consensus node. In the end, the selection of supervisor nodes is combined with the comprehensive evaluation of consensus nodes. The comprehensive evaluation includes the consensus node’s credit score, the reliability of the data and the number of successful blocks. The consensus node with high comprehensive evaluation will obtain higher supervisor rights, and the more likely it is to be elected as the supervisor node.
Comprehensive evaluation CA is determined according to the calculation accuracy C, credit score D and the number of successful blocks of the consensus node’s historical carbon emission intensity T. As shown in Formula 1.
There are
Where,
The equity
Reward score
The supervisor right
Because the network nodes of PBFT algorithm are fixed, it can’t adapt to the dynamically built node cluster, and when the network nodes change, the system needs to be restarted, which seriously reduces the efficiency. Therefore, PBFT algorithm should be optimized to adapt to the above-mentioned optimized PoW algorithm. The optimized PBFT algorithm omits the request and reply phases in the consistency protocol of PBFT algorithm, and changes the communication mode to P2P network topology mode; Nodes are divided into consensus nodes and reserve nodes, and a reward and punishment mechanism is introduced. Points are added and deducted according to the performance, and the members of consensus node cluster and reserve node cluster are dynamically adjusted while the rewards and punishments are settled.
The design of smart contract based on power flow calculation is mainly because the carbon flow analysis method of power system carbon emission calculation is usually combined with power flow analysis. By introducing concepts such as carbon flow rate and emission intensity, carbon flow analysis can accurately track and locate the specific direction of carbon emissions. It can not only accurately obtain the overall carbon emissions of the system, but also fairly distribute the emissions of power plants to each node load and each branch power.
Considering the current development status of the distribution network, it is still difficult for some distribution network nodes to achieve the computing and communication capabilities required by blockchain nodes, and the financial and material resources required for upgrading are too large. With the help of computing resources provided by the cloud service provider, the data is packaged and sent to the cloud service provider, and then returned to the node after calculation and processing.
In order to maintain the privacy of data and calculation results, nodes on the chain need to encrypt and protect data into virtual data before delivering it to cloud service providers. The main chain node encryption formula is (10–11), (23), and (28). The cloud service provider obtains virtual computing results through (12–14), (24–26) and (29–33). The main chain node decrypts the virtual computing results delivered by the cloud service provider through formulas (17–19), (34–35) and (36). In order to verify the correctness of the virtual calculation results of the cloud service provider, the power grid company adopts the cloud computing framework based on the double check mechanism to verify the virtual calculation results. After determining that the virtual calculation results provided by the cloud service provider are correct, the power grid company calculates the carbon flow rate according to the decrypted data provided by the main chain node. The calculation formulas involved in the power grid company are (37–39) and (40–44).
Some nodes in the distribution network do not have the powerful computing resources comparable to those of grid companies or major nodes, so it is difficult to obtain the carbon traceability value based on power flow calculation.
At present, public cloud service providers such as Huawei Cloud and Alibaba Cloud have provided commercial cloud computing solutions for scenarios such as intelligent microgrid and distributed new energy grid-connected management. The application potential and prospect of cloud computing technology in power system have also attracted attention, forming a number of instructive research results. In this context, outsourcing the carbon traceability business of distribution network enterprises to cloud service providers can effectively solve the problem of insufficient computing power of some nodes.
As shown in Figure 2, after the node obtains the relevant data required by the traceability, it executes the encryption work in response to a under the condition a of the smart contract, and delivers the encrypted generated block to the cloud service provider. After the node obtains the calculation result of the cloud service provider, it executes the decryption in response to b under the condition b of the smart contract, and returns the generated block after decryption to the data owner, namely the power grid company.
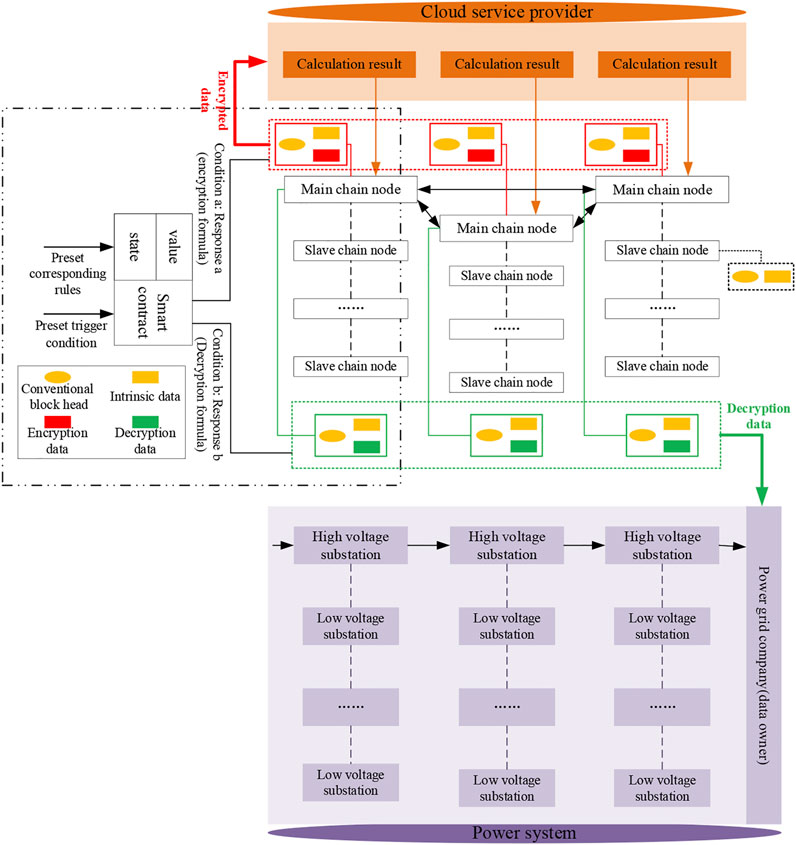
FIGURE 2. Smart contract and block generation.
The nodes on the main chain encrypt data and send the encrypted data to the cloud service provider. The cloud service provider outputs the virtual calculation results in combination with the power flow calculation, and the nodes on the main chain decrypt the virtual calculation results. The power grid company collects the decryption results of each node on the chain, and verifies the correctness of the decryption results. For cloud service providers and power grid companies, smart contracts are just tools to trigger them simply. For the encryption and decryption of nodes on the master chain, smart contracts are not only tools to trigger, but also contain relevant formulas for encryption and decryption. The formula for node encryption on the master chain includes: (10–11), (23), (28). The calculation formula of cloud service provider includes: (12–14), (24–26), (29–33). The formula for node decryption on the master chain includes: (17–19), (34–35), (36). The formula calculated by the power grid company includes: (37–39), (40–44).
Considering that cloud service providers may negatively treat computing tasks in order to reduce costs, power grid companies need to adopt the cloud computing framework based on double check mechanism to verify the correctness of the decrypted calculation results to ensure the correctness of the final carbon traceability results. If the cloud service provider fails the verification, it will have to pay the relevant computing service fee or be put on the blacklist for a certain period of punishment. The cloud computing framework based on the double check mechanism means that the user designs two different matrices, vectors or values, and sends them to two different cloud service providers for solving, and then compares the solution results of different cloud service providers to verify the correctness of the calculation results.
A virtual node is added to the branch, and the loss of the branch is equivalent to the virtual load. The transmission active power and loss of each branch are calculated by reverse power flow, and the power generation is decomposed by power flow distribution matrix. According to the countercurrent tracking method, the load of node
Since the branch loss is equivalent to a virtual load, that the power supply
In the equation,
The power grid company uses a random non-singular matrix and a random vector to encrypt
The real active power of the generator of each node is scaled by a diagonal matrix-
After the parameter transformation of Eqs 10, 11, the digital expression of the virtual load
In the equation,
The formula for the transformation of the power flow distribution matrix
The conversion formula of generator power parameters matrix
The power of the generator set is generated synchronously with its carbon emissions, which is consistent. When the carbon emissions corresponding to the power generation power are known in advance, they can be distributed in the same proportion according to the active components, so as to obtain the distribution characteristics of the carbon emissions of the generator set in the power network (Qun et al., 2022). Carbon emissions from the power system are mainly derived from exhaust gases generated by fossil fuel combustion power generation (thermal power, gas and oil-fired units), which can generally be expressed by carbon emission intensity indicators. Therefore, the carbon emissions of the electric energy per unit of hydroelectric generator set and new energy generator set production are approximately 0.
According to the current operating state and real-time power of the coal-fired generator set, the calculation formula of the PECC is as follows.
The PECC of the coal-fired generator set
The carbon emission intensity
The carbon content rate and carbon oxidation rate of coal-fired generator set
The
The transpose matrix of PECC curve characteristic parameter matrix of coal-fired generator set
Zoom in or out
The formula representation of the virtual PECC of the coal-fired generator set
Since
According to Eq. 21, the coefficient value in the carbon emission intensity
After conversion by Formula (26), the
Zoom in or out
The virtual carbon emission intensity of coal-fired generator set
In the case where
The
Thus Eq. 30 can be transformed as follows.
According to the
In the case of
Combined with Eqs 27–33,
The cloud service provider obtained the virtual load
The distribution network can effectively solve the problem of insufficient computing capacity of some nodes by outsourcing the computing business involving a large amount of data to the cloud service provider. However, as an independent stakeholder, the cloud service provider may treat the computing task negatively in order to reduce costs. Therefore, for users who do not know the correct solution, it is difficult to independently verify the correctness of the results returned by the cloud service provider. Therefore, this paper constructs a double-check mechanism, and outsources the virtual load
The implementation of comparison verification under the cloud computing framework based on the double check mechanism is as follows: if the two cloud service providers solve the task honestly and return the real
Cloud service provider I or II receives the virtual data encrypted using encryption method 1 or 2. Encryption method 1 includes matrix
Cloud service providers I for the coal-fired power generating set
When comparing and verifying the calculation results of different cloud services, if the recalculation results of two cloud providers are still different but consistent with the original results, the grid company needs to hire a third cloud provider. If the calculation result of the third cloud service provider is the same as that of the previous two cloud service providers, the power grid company will punish the previous cloud service provider for providing the wrong result and pay the calculation fee of the third cloud service provider; If the calculation result of the third cloud service provider is different from that of the previous two cloud service providers, the data center inside the power grid system shall assume the calculation responsibility. If the calculation result of the data center inside the power grid system is the same as the calculation result of any of the three cloud service providers, the power grid company will punish the two cloud service providers that provide the wrong result to pay the calculation cost of the cloud service provider that provides the correct calculation result and the data center inside the power grid system. If the calculation result of the data center inside the power grid system is different from that provided by the three cloud service providers, the power grid company will punish the three cloud service providers for paying the calculation cost of the data center inside the power grid system. Grid companies do not pay computing fees for cloud providers that provide false results. The grid company will put the cloud service provider that provides the wrong results twice into the blacklist for three cycles.
We have adopted a 4-node system for testing, where node 1 and node 2 are connected to a thermal power unit respectively. The following table-1 shows the calculation results of real and virtual data.
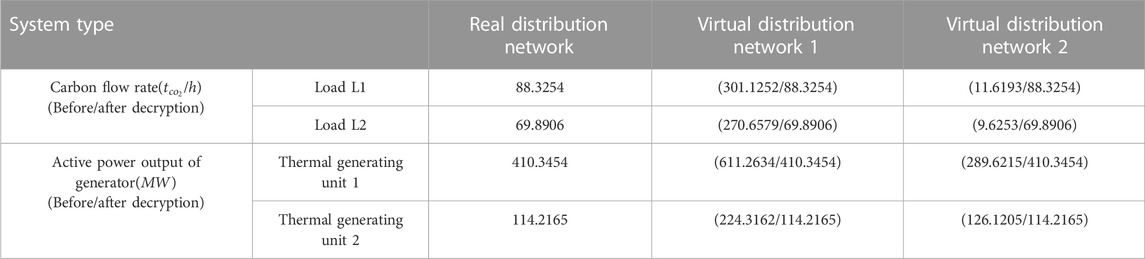
TABLE 1. Comparison of calculation results between real and virtual data.
With the increasing maturity of blockchain technology, the application of blockchain combined with other technologies is becoming more and more extensive. In this paper, the combination of blockchain and power flow calculation is applied to trace the carbon emission flow of power system. As some nodes of the power distribution network in the power system do not have powerful computing resources comparable to those of the power grid company or main nodes, this paper adopts a third-party cloud service provider to effectively solve the problem of insufficient computing capacity of some nodes.
In order to achieve accurate calculation and distribution of carbon emission flow in power system, this paper proposes a carbon flow tracing system in power distribution network based on block chain and power flow calculation. Combined with the general background of energy conservation and emission reduction of the power system and the requirements of safe operation of the power grid, this paper integrates the master-slave multi-chain model and the inverse power flow calculation method, and improves the consensus algorithm of DPoS and PBFT. In addition, the corresponding encryption and decryption operations are carried out through smart contracts to prevent the leakage of power grid data during the computing process of cloud service providers. Meanwhile, the cloud computing framework based on the double check mechanism not only reduces the computing burden of the power system, but also ensures the accuracy of the final cloud computing results obtained by the power grid companies.
The original contributions presented in the study are included in the article/supplementary material, further inquiries can be directed to the corresponding author.
Introduction, YL; fusion analysis of blockchain and power flow calculation for carbon traceability, GG; blockchain traceability system architecture resource identification initiative, JS and ZL; inverse power flow calculation and carbon emission flow calculation, HS and TL; verify the correctness of cloud computing results and conclusion, CY and YZ; funding acquisition, GG and HS. All authors have read and agreed to the published version of the manuscript.
This project was supported by the Science and Technology Project of State Grid Liaoning Electric Power Co., Ltd.: Research on traceability technology of clean energy carbon flow based on blockchain under the “Carbon Peaking and Carbon Neutrality” goal project (2022YF-82).
We are indebted to GG and HS for their insightful suggestions on the original manuscript. All the editors and reviewers are gratefully acknowledged.
Authors HS, TL, CY, JS, ZL, and YL was employed by the company State Grid Liaoning Electric Power Co., Ltd.
The remaining authors declare that the research was conducted in the absence of any commercial or financial relationships that could be construed as a potential conflict of interest.
The authors declare that this study received funding from the company State Grid Liaoning Electric Power Co., Ltd. The funder had the following involvement in the study: introduction, YL; blockchain traceability system architecture resource identification initiative, inverse power flow calculation and carbon emission flow calculation, verify the correctness of cloud computing results and conclusion.
All claims expressed in this article are solely those of the authors and do not necessarily represent those of their affiliated organizations, or those of the publisher, the editors and the reviewers. Any product that may be evaluated in this article, or claim that may be made by its manufacturer, is not guaranteed or endorsed by the publisher.
Ai, K., Wu, Y. L., Zhu, L. H., Qiu, M., and Shen, M. (2019). Privacy preserving energy trading using consortium blockchain in smart grid. Industrial Inf. IEEE Trans. 15 (6), 3548–3558. doi:10.1109/tii.2019.2893433
Apergis, N., and Payne, J. E. (2010). The emissions, energy consumption, and growth nexus: Evidence from the commonwealth of independent states. Energy Policy 38, 650–655. doi:10.1016/j.enpol.2009.08.029
Chen, S., Conejo, A. J., and Wei, Z. N. (2021). Conjectural-variations equilibria in electricity, natural-gas, and carbon-emission markets. Power Syst. IEEE Trans. 36 (5), 4161–4171. doi:10.1109/tpwrs.2021.3066459
Chen, S. J., Mi, H., Ping, J., Yan, Z., Shen, Z., Liu, X., et al. (2022). A blockchain consensus mechanism that uses Proof of Solution to optimize energy dispatch and trading. Nat. Energy 7, 495–502. doi:10.1038/s41560-022-01027-4
Choi, B. B., Lee, D., and Psaros, J. (2013). An analysis of Australian company carbon emission disclosures. Pac. Acc. Rev. 25, 58–79. doi:10.1108/01140581311318968
Choi, D. H., and Xie, L. (2016). Economic impact assessment of topology data attacks with virtual bids. Smart Grid, IEEE Trans.9 (2), 512–520. doi:10.1109/tsg.2016.2535246
Esmat, A., De, V. M., Ghiassi-farrokhfal, Y., Palensky, P., and Epema, D. (2021). A novel decentralized platform for peer-to-peer energy trading market with blockchain technology. Appl. Energy 282, 116123. doi:10.1016/j.apenergy.2020.116123
Guo, D. F., Min, Z., Yan, Z., and Zhen, X. (2011). Study on cloud computing security. J. Softw. 22 (01), 71–83. doi:10.3724/sp.j.1001.2011.03958
Hua, J. Z., Qi, G. L., Suan, F. W., and Yang, C. D. (2016). The inspiration from Ukraine incident: Preventing the fake data injection attacks against the power grid. Automation Electr. Power Syst. 40 (7), 149–151. doi:10.7500/AEPS20160203101
Hua, Y. C., Ning, Z., Qing, C. K., and Kirschen, D. S. (2017). Research framework and prospects of low-carbon multiple energy systems. Proc. CSEE 37 (14), 4060–4069. doi:10.13334/j.0258-8013.pcsee.170338
Hui, Y. Z., Shu, Y., and Kai, W. (2022). Research on the path of blockchain technology to help digital carbon neutrality. Inf. Commun. Technol. Policy 2022 (01), 81–83. doi:10.12267/j.issn.2096-5931.2022.01.013
Jian, P., Zheng, Y., Jie, S. C., Yu, Z. S., Su, Y., Jing, L., et al. (2019). Credit risk management in distributed energy resource transactions based on blockchain. Proc. CSEE. 39 (24), 7137–7145. doi:10.13334/j.0258-8013.pcsee.181888
Kang, C. Q., Zhou, T. R., Chen, Q. X., Xu, Q., Xia, Q., and Ji, Z. (2012). Carbon emission flow in networks. Sci. Rep. 2, 479. doi:10.1038/srep00479
Ke, Y., Xing, J. X., Juan, H. W., Min, G. L., and Qing, X. S. (2020). Review of research and business application of blockchain technology in energy and electric power industry. Electr. Power Constr. 41 (11), 1–15. doi:10.12204/j.issn.1000-7229.2020.11.001
Khamis, S. B., and Chen, F. (2022). The impact of carbon emission (co2) on economic growth: Evidence from sub-saharan africa. Int. J. Sci. Bus. 15 (11), 19–27. doi:10.5281/zenodo.6901564
Li, B. W., Song, Y. H., and Hu, Z. C. (2013). Carbon flow tracing method for assessment of demand side carbon emissions obligation. IEEE Trans. Sustain. Energy 4 (4), 1100–1107. doi:10.1109/tste.2013.2268642
Li, Z. T., K, J. W., Yu, R., Ye, D. D., Deng, Q. Y., and Zhang, Y. (2018). Consortium blockchain for secure energy trading in industrial internet of things. IEEE Trans. Industrial Inf. 14 (8), 3690–3700. doi:10.1109/TII.2017.2786307
Lippke, B., Puettmann, M. E., Johnson, L., Gustafson, R., Venditti, R., Steele, P., et al. (2012). Carbon emission reduction impacts from alternative biofuels. For. Prod. J. 64, 296–304. doi:10.13073/12-00021.1
Luo, F. J., Dong, Z. Y., Liang, G. Q., Murata, J., and Xu, Z. (2019). A distributed electricity trading system in active distribution networks based on multi-agent coalition and blockchain. IEEE Trans. Power Syst. 34 (5), 4097–4108. doi:10.1109/tpwrs.2018.2876612
Luo, X. Y., Xue, K. P., Xu, J., Sun, Q., and Zhang, Y. (2021). Blockchain based secure data aggregation and distributed power dispatching for microgrids. Smart Grid, IEEE Trans. 12 (6), 5268–5279. doi:10.1109/tsg.2021.3099347
Ping, J., Yan, Z., and Chen, S. J. (2021). A two-stage autonomous EV charging coordination method enabled by blockchain. J. Mod. Power Syst. Clean Energy 9 (1), 104–113. doi:10.35833/mpce.2019.000139
Qun, C. W., Yi, C., Yun, C. C., Yuan, T., Bo, X. L., and Dong, X. J. (2022). Calculation method of carbon emission flow in power system based on power flow distribution matrix. Sci. Technol. Eng. 22 (12), 4835–4842.
Shun, L. M., Zhong, L. C., and Ning, A. (2011). Research and practice of power system cloud computing center. Power Grid Technol. 35 (06), 171–175. doi:10.13335/J.1000-3673.pst.2011.06.034
Su, Q. H., Zhi, Q. H., Yuan, Z. L., and Shi, Z. Z. (2022). Research on the application of blockchain technology in carbon trading. Integr. Intell. Energy 44 (03), 23–28. doi:10.3969/j.issn.2097-0706.2022.03.004
Sun, W., Cai, H., and Wang, Y. W. (2018). Refined laspeyres decomposition-based analysis of relationship between economy and electric carbon productivity from the provincial perspective development mode and policy. Energies 11, 3426. doi:10.3390/en11123426
Sun, Y. L., Kang, C. Q., Xia, Q., Chen, Q., Zhang, N., and Cheng, Y. (2017). Analysis of transmission expansion planning considering consumption-based carbon emission accounting. Appl. Energy 193, 232–242. doi:10.1016/j.apenergy.2017.02.035
Wang, C., Ren, K., and Wang, J. (2011). “Secure and practical outsourcing of linear programming in cloud computing,” in 2011 Proceedings Ieee Infocom, Shanghai, China, 10-15 April 2011, 820–828. doi:10.1109/INFCOM.2011.5935305
Wei, B. L., Hun, Z. H., Hua, Y. S., and Hui, G. W. (2012). Principle and model for regional allocation of carbon emission from electricity sector. Power Syst. Technol. 36 (7), 12–18.
Wei, H., and Xue, X. (2023). Electric meter and energy blocks chain across the chain of carbon emissions trading models. J. Syst. Manag. 32 (01), 64–72. doi:10.3969/j.issn1005-2542.2023.01.005
Wen, H. B., Zhou, X. F., Hai, X., Huang, L. F., Cheng, F. L., and Hai, J. G. (2022). Research on node admittance matrix algorithm to support whole-link carbon flow tracking in power system. Proc. CSEE.
Xie, L., Mo, Y., and Sinopoli, B. (2010). “False data injection attacks in electricity markets Smart Grid Communications,” in 2010 First IEEE International Conference onSmart Grid Communications, Gaithersburg, MD, USA, 04-06 October 2010, 226–231. doi:10.1109/SMARTGRID.2010.5622048
Yan, D., Lei, Y., Li, L., and Song, W. (2017). Carbon emission efficiency and spatial clustering analyses in China’s thermal power industry: Evidence from the provincial level. J. Clean. Prod. 156, 518–527. doi:10.1016/j.jclepro.2017.04.063
Yang, Q., Wang, H., Wang, T. T., Zhang, S., and Wu, X. (2021). Blockchain-based decentralized energy management platform for residential distributed energy resources in a virtual power plant. Appl. Energy 294, 117026. doi:10.1016/j.apenergy.2021.117026
Yin, S. C., Yi, L., and Xiao, C. (2019). Blockchain model of electric power carbon emission trading considering credit scoring mechanism. Electr. Power Constr. 40 (01), 104–111. doi:10.3969/j.issn.1000-7229.2019.01.013
Yuan, K. W., Lei, Y., Yong, Y., and Yi, S. (2021). Design of power data assets and trading system based on blockchain. J. Northeast. Univ. Nat. Sci. 42 (02), 166–173. doi:10.12068/j.issn.1005-3026.2021.02.003
Zhi, C., Jian, Z. H., Hong, C. W., and Ge, T. L. (2021). Multi-stage planning of park-level integrated energy system based on ladder type carbon trading mechanism. Electr. Power Autom. Equip. 41 (9), 148–155. doi:10.16081/j.epae.202109012
Zhou, T. R., Kang, C. Q., Xu, Q. Y., Chen, Q. X., Xin, J. B., and Wu, Y. (2012c). Analysis on distribution characteristics and mechanisms of carbon emission flow in electric power network. Automation Electr. Power Syst. 36 (15), 39–44. doi:10.3969/j.issn.1000-1026.2012.15.007
Zhou, T. R., Kang, C. Q., Xu, Q. Y., and Chen, Q. X. (2012b). Preliminary investigation on a method for carbon emission flow calculation of power system. Automation Electr. Power Syst. 36 (11), 44–49. doi:10.3969/j.issn.1000-1026.2012.11.008
Keywords: carbon flow traceability, distribution network, blockchain, power flow calculation, cloud service provider, smart contract, double check mechanism
Citation: Sun H, Li T, Yang C, Zhang Y, Song J, Lei Z, Gong G and Liu Y (2023) Research on carbon flow traceability system for distribution network based on blockchain and power flow calculation. Front. Energy Res. 11:1118109. doi: 10.3389/fenrg.2023.1118109
Received: 07 December 2022; Accepted: 17 January 2023;
Published: 03 February 2023.
Edited by:
Sijie Chen, Shanghai Jiao Tong University, ChinaCopyright © 2023 Sun, Li, Yang, Zhang, Song, Lei, Gong and Liu. This is an open-access article distributed under the terms of the Creative Commons Attribution License (CC BY). The use, distribution or reproduction in other forums is permitted, provided the original author(s) and the copyright owner(s) are credited and that the original publication in this journal is cited, in accordance with accepted academic practice. No use, distribution or reproduction is permitted which does not comply with these terms.
*Correspondence: Yingli Zhang, emhhbmd5aW5nbGk5OEAxNjMuY29t
Disclaimer: All claims expressed in this article are solely those of the authors and do not necessarily represent those of their affiliated organizations, or those of the publisher, the editors and the reviewers. Any product that may be evaluated in this article or claim that may be made by its manufacturer is not guaranteed or endorsed by the publisher.
Research integrity at Frontiers
Learn more about the work of our research integrity team to safeguard the quality of each article we publish.