- 1NARI School of Electrical and Automation Engineering, Nanjing Normal University, Nanjing, China
- 2Jiangsu International Joint Laboratory for Integrated Energy Equipment and Integration, Nanjing Normal University, Nanjing, China
- 3Department of Electronic and Electrical Engineering, University of Bath, Bath, United Kingdom
The rapid expansion of electric vehicle charging networks (EVCNs) makes them critical infrastructures bridging power and traffic systems. The EVCN could be vulnerable during power outages at fast charging stations (FCSs), which are induced by planned maintenance or emergency load shedding. This paper proposes an approach to assess the impact of power outages on the Quality-of-service of the EVCN. The Markov decision process is utilized to model the spatial–temporal randomness of EV movement in a graph-based EVCN. The decision of charging by EV drivers is estimated by a fuzzy logic inference system. The spatial–temporal EV charging load at FCSs is formulated by a queuing-based non-linear optimization problem. Yen’s algorithm is adopted to simulate the EV redistribution phenomenon of searching adjacent healthy FCSs in response to the power outage. Quality-of-service (QoS) indices are derived to assess the potential congestions in the adjacent healthy FCSs. The case studies demonstrate that power outages may cause congestion at peripheral FCSs, exacerbating the QoS of the EVCN. Partial charging may alleviate the QoS deterioration in the event of FCS outages.
1 Introduction
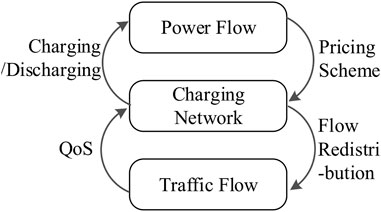
Electric vehicles (EVs) play a critical role to reduce greenhouse gas emissions. Rapid expansion of charging networks (CNs) accelerates the pace of EV penetration and the interdependency between power and traffic systems (Lv et al., 2020). From the aspect of the power system, the charging/discharging power flow stems from the EV traffic flow captured by the CN. From the aspect of the traffic system, electricity pricing schemes could be an essential way to manage the EV traffic flow (Huang et al., 2015), which in turn alter the EV charging power flow. As shown in Figure 1, such interdependency forms a closed loop with the EVCN as the nexus between power and traffic flows.
The past decade has witnessed substantial research efforts devoted to studying the interdependency between power and traffic systems. The impact of traffic flow on power flow comes from the stochastic charging/discharging of massive EVs through CNs. Due to the spatial–temporal random movement of EVs, the impacts vary in both space and time domains (Tang and Wang, 2016). Peak charging demand may impose congestion (Liu et al., 2018) and reliability (Hou et al., 2018) issues on the power system. A recent study implies that ultra-fast charging may cause cascade failure of the transmission system (Mao et al., 2019). On the other hand, the power flow affects the traffic flow indirectly by price-based charging strategies, which economically incent the drivers to make profits by charging EVs at low price hours and locations (Cui et al., 2021). The power flow is then altered by the spatial–temporal redistribution of EV as an energy carrier (Yu et al., 2016). It can be concluded that the power-traffic interdependency should not be ignored because the spatial-randomness of EVs should be captured.
Although significant attention has been paid to the interdisciplinary study on the power-traffic coupled EVCN, the exploration of the interdependency during system failure, such as power outages, is still in the early stage. Extreme weather may damage both roads and transmission lines (Zhang et al., 2020). The impacts of system failure on power–traffic interdependency are two-fold. First, road damages may cause adverse impacts on power systems due to the spatial–temporal movement of EV traffic flow. Wang et al. (2022) assessed the risk of a power system in terms of voltage drop and line overload due to traffic incident and road capacity reduction. Voltage violation may occur as a result of road capacity degradation attacks (Wei et al., 2016). Second, extreme weather may induce power system failures. EVs are mobile energy storages that provide flexible vehicle-to-grid (V2G) support during power outages. Shin and Baldick (2017) investigated vehicle-to-home (V2H) operation that provides backup power. Yao et al. (2020) proposed a service restoration strategy to optimize the routing and scheduling of mobile energy storage fleet among different microgrids.
Substantial efforts have been contributed to V2G-based power system resilience enhancement. However, the impacts of power system failure on the electrified traffic system are overlooked. Power system faults may cause traffic light outages and traffic congestion (Wang B. et al., 2019), which may further delay the restoration process (Wang et al., 2020). The planned power outages implemented in 2019 to prevent wildfires in Northern California highlighted a critical issue that the functionality of the EVCN would be interrupted by power outages, undermining the Quality-of-service (QoS) of EV charging (Ucer et al., 2019). EVs are interruptible loads, which are prone to power outages, leaving stranded in the fast charging station (FCS). The EV charging service reliability could be a major concern for estimating the probability of charging service completion (Cheng et al., 2014). Furthermore, the phenomenon of EV redistribution may occur. The depleted EVs leave the outage area and randomly detour to the healthy FCSs. Long queues might emerge, impairing the QoS of the healthy FCSs. Shenzhen, a city in south China, experienced EVCN outage on 19 May 2018 due to power system load shedding. Nearly 2,700 electric taxis and 4,000 drivers could not be recharged. The congestions at the peripheral CSs worsen the charging QoS (Wei et al., 2019). Such autonomous spatial–temporal redistribution of EVs may further affect the power flow, which might cause power system overloading.
Increasing attention has been paid to the continuous operation of the EVCN during power outages. Wang et al. (2019) evaluated the electrical safety of EVCNs for risk management and control mechanisms considering power outages. Wu et al. (2021) analyzed the response characteristics of EVs during the power system outage. The optimal size of the energy storage system in a fast charging station is determined to ensure the charging resilience of EVs (Hussain et al., 2020). Price-based regulation (Sheng et al., 2019) prevents the regional overloading caused by EV redistribution. Vulnerability analysis should be traced to identify the key power system component (Liu et al., 2022) for cascade failure prevention (Wu et al., 2022).
EV drivers may not accept the risks of driving and finding stations out of service, if FCSs are unreliable and susceptible to power outages. Load redistribution may create congestion effects, resulting in wait times and reduced QoS at popular FCSs. Recent literatures focus on the price-based QoS guarantee. Sun et al. (2018) developed an optimal charging policy to minimize the charging cost with the service loss probability as the QoS of a battery swapping station. An evaluation method is proposed in Zenginis et al. (2018) by incentivizing EVs to reduce charging and wait time during peak periods. Network calculus theory is used to formulate the QoS as the minimum departure energy curve (Li et al., 2020). The QoS impact analysis under FCS outage is in the nascent stage.
To summarize, the interdependency between traffic flow and power flow manifests itself in both normal and failure states. The stochastic modeling process of EV charging load redistribution is significant to the key FCS identification and service restoration. However, the spatial–temporal randomness of EV redistribution is considered deterministic in previous studies. This assumption decouples the correlation between the stochastic FCS selection and routing. In addition, previous works focused on power system resilience, while neglecting the pivotal role of the EVCN for charging service guarantee. In this paper, we endeavored to connect the nexus between power outage and its impacts on the QoS of EV charging. A QoS assessment framework of the EVCN outage is proposed, considering the spatial–temporal randomness of EV load redistribution. The major contributions of this study are as follows.
1) We model the stochastic process of EV load redistribution in both spatial and temporal domains. The Markov decision process and fuzzy-logic inference are utilized to model the probabilistic behavior of EV charging. Yen’s algorithm is deployed to model the EV redistribution of choosing among multiple healthy FCSs.
2) Spatial–temporal QoS assessing methods are proposed to reveal the nexus between FCS outages and the QoS of EV charging by capturing the traffic congestions of FCSs. The aftermath impacts of EV load redistribution on the power system is investigated as well.
3) Partial charging is proposed as a possible mitigation strategy, which could be helpful for utilities taking proactive and reactive countermeasures for charging service guarantee during FCS power outages.
The rest of this paper is organized as follows. Section 2 introduces the system architecture of the proposed method. The spatial–temporal modeling of random EV movements is given in Section 3. The phenomenon of EV load redistribution is modeled in Section 3. The spatial–temporal QoS assessment and case studies are, respectively, proposed in Sections 4, 5. Finally, Section 6 concludes the proposed method.
2 System architecture
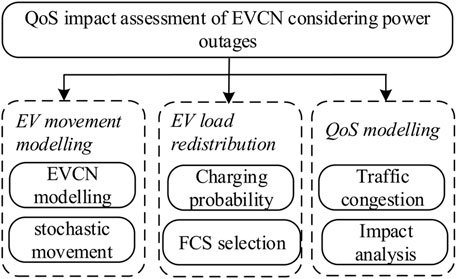
This section presents the framework of the QoS-oriented impact assessment of the EVCN, considering the power outages of FCSs. In this paper, we establish an EVCN coupled with power systems in a metropolitan area. The city is divided into several regions based on the geographic locations of power system substations. The regions are classified into residential (H), industrial (I), and commercial (C) areas based on the local load types. FCSs are installed at each region and electrically connected to the substations. Bi-directional streets geographically link the regions and FCSs, forming an EVCN. EVs are moving and charging among different regions and FCSs in the EVCN. As shown in Figure 2, the system architecture consists of three modules: EV movement modeling, EV load redistribution modeling, and QoS assessment.
In an EVCN, EVs move among different FCSs in different regions, with randomness in both space and time. The spatial–temporal modeling of the stochastic EV movement is the primary task for QoS assessment of the EVCN. We model the EVCN by a graph connecting the FCSs. The EV movements are modeled by daily trips in both space and time domains.
The second module focuses on EV load redistribution during FCS outages. The randomness of load redistribution is based on the charging decision and FCS selection. The charging probability is derived based on the battery SOC to determine the random en route charging. EVs could be charged at any en route FCSs during the trip. When the FCS outage occurs, EVs are forced to make a detour and seek a healthy FCS, which is randomly simulated by the FCS selection algorithm.
The last module assesses the QoS impact of an FCS outage from the perspectives of both the EVCN and power system. Several indices are proposed to assess the underlying traffic congestion in the FCSs due to EV load redistribution. The impact on the power system is analyzed by considering the potential overloading caused by EV load redistribution.
3 Stochastic modeling of daily EV movement
The modeling of the EV movement is essential to capture the spatial–temporal randomness. The daily EV movement can be regarded as a chain of trips made among different regions. The daily EV movement is a spatial–temporal stochastic process. When an EV moves, the battery state-of-charge (SOC) decreases with the increase in driving distance. The EV driver may charge the battery at the FCS in any region and at any time for different durations based on the SOC level, traveling schedule, and preference charging stations, which means the EV charging load is moving during 24 h in the coupled EVCN–power system. This section intends to model the daily chain of locations/regions in terms of spatial randomness and the corresponding charging durations in terms of temporal randomness.
3.1 EV charging network modeling
EVCN modeling is the first-cut for the stochastic modeling of EV movement, by which the trip distance plays a significant role. First, the trip distance bridges the spatial and temporal movements because it determines not only the origin-destination regions but also the trip duration and arrival time. The integrated modeling of the EVCN and power systems is significant for simulating EV driving and charging with spatial and temporal randomness. Graph theory (Murty and Bondy, 2008) is adopted in this study for EVCN modeling by considering the trip distance.
A graph is composed of sets of vertices V(G) and edges E(G). Graph theory has been widely used to describe the relationships between entities, by which the vertices represent the entity and the edges represent the relationship between the two entities. A graph structure can effectively model and solve various practical problems, such as social relations, traffic network, grammar structure, and paper citation, where inter-entity relationships are considered. The graph can be expressed as
where V(G) = {v1, …, vM}, E(G) = {e1, …, eN}, with M and N being the number of vertices and edges, respectively. ψG is the incidence function, which represents the mapping from the edge set to vertex pair.
The sequence of x and y indicates the edge direction, e.g., {x, y} indicates the direction of the edge is from the vertex x to y. In a directed graph, a set of vertices can model the city regions and the FCS clusters in the regions, while the vertices can represent the power system buses. A set of directed edges can model the two-way streets and the traffic flow direction between the FCS clusters between regions. A two-dimensional Cartesian coordinate system is established to link the regional FCS clusters in the EVCN and the substations in the power system. Euclidean distance is used to calculate the distances between the neighboring regions. By assigning the distances to each edge of the graph, the coupled EVCN and power system can be modeled as a weighted graph.
A walk in a graph G is a finite sequence of alternate vertices and edges, given by
where the endpoints of ek are vk-1 and vk. If the vertices of the walk are distinct, then the W is called a path in the graph. A path can be used to model a trip of the EV driver, which consists of the origin, destination, and the regions/streets traversed. The trip distance can be modeled by the weight of a path, which is the sum of its edge weights. The Dijkstra algorithm is an acknowledged approach for finding the shortest path, which is deployed in this paper for deriving the trip path. For a given region of the city as the trip source, the algorithm produces the distance of the shortest weighted path from the source region to each other region. By applying graph theory, the spatial–temporal randomness can be captured by modeling the trip distance.
3.2 Stochastic modeling of a trip chain
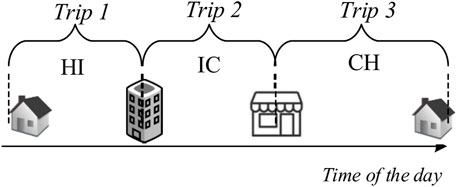
In traffic planning, trip chain has been widely applied for analyzing the travel characteristics. In this paper, trip chain is adopted to model the spatial randomness of EV movement in a coupled EVCN–power system. Trip chaining is a time-ordered sequence of trips in the form of the spatial changes of regions. The trip chain may comprise three trip segments, i.e., HI–IC–CH. Figure 3 illustrates a typical daily trip chain of going to work (I) from home (R) in the morning and returning home (H) with a stopover for shopping (C).
In this paper, we generate the daily trip chain of each EV driver by two steps. First, we randomly generate the daily number of trips. According to the National Household Travel Survey (NHTS) (Zhou and Wang, 2014), two and three trips per day account for most of the total daily trip number. We assume the number of daily trips is two or three, with the probability of p(Ntr). Ntr is the total number of trips in a trip chain.
Second, the daily trip chain is generated. By enumeration, we can generate the combinations of different daily trip chains, which reflect the daily travel pattern of EVs. The probability of each type of trip chain can be calculated by the conditional probability p(C|Ntr), which represents the probability of a specific trip chain C on the condition of Ntr number of trips. The joint probability of the trip chain C with Ntr trips can be calculated and expressed as
By utilizing the trip chain, each trip can be recorded with the key information such as source, destination, the departure and arrival times, trip duration, the initial SOC, and energy consumptions.
3.3 Stochastic modeling of trip destination
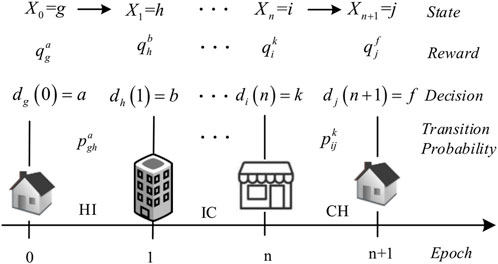
To derive the specific region as the destination for the next trip, we adopt the Markov decision process (MDP) to mimic the EV driver’s decision on choosing the next destination (Sheskin, 2016). The MDP is a mathematical description of sequential decision problem. The general framework of the MDP is defined by a five-tuple {T, J, A, P, and R}. Set T denotes the set of epochs in a planning horizon. An MDP produces a sequence of Markov chains with a set of states J and the associated rewards R. The states and rewards evolve over time for each epoch in a planning horizon. Set A denotes the decision set. At the beginning of every epoch, a decision is made by selecting one of several actions with rewards in every state. The state is then transited by following the transition probabilities P. A policy in an MDP is a rule that prescribes a set of ordering decisions for all states. The objective of an MDP is to determine an optimal policy that maximizes the vector of expected total rewards received until the end of the horizon.
The stochastic process of determining the daily chain of destinations can be modeled by an MDP. Figure 4 shows the MDP for modeling the trip chain. The daily trip chain of Ntr trips can be modeled by Ntr+1 epochs. Epoch n represents the end of trip n and the beginning of trip n+1. At each epoch, the EV can be in one of the regions in the city. The set of state J denotes the total L regions in an EVCN. The EV is in region J at the end of trip n, which can be expressed as Jn. The decision set A includes all the possible destinations based on the region type generated by the trip chain. At every epoch, the EV decides the next trip destination. Let A denote the decision set, which encompasses all the possible trip destinations according to the random trip chain. A daily trip chain will generate a set of ordered decisions from epoch 1 to Ntr-1, which can be modeled by the Markovian policy π, expressed by π = {πi(n), n = 0, 1, …, Ntr-1, i∈J, n∈T}, where πi(n) = a: J→A, a∈A. A transitional probability will be received when a decision is made at an epoch. Let P denote the set of transitional probability. The transitional probability from state i to state j is expressed as
According to the Markov property, it is assumed that the transitional probability of driving from region i to j depends only on the region where the EV is currently parked.
At epoch n and in state i, the EV driver receives a reward
The coefficients ε1 and ε2 (ε1+ε1=1) can be set to the value from 0 to 1, which is the influence of the driving distance d and RP on the reward. Given a policy π, a trip chain with the expected total reward received from initial region i is
Backward recursion is utilized to calculate the expected total reward received at epoch n, which is
The probability of an EV driver choosing the policy π is
Finally, the policy is randomly generated in the form of a chain of destinations. The shortest paths with all the regions traversed in the trip chain can be generated and the trip distances. Given the speed, the driving time can be calculated. The parking duration tp can be obtained by normal distribution tp ∼ N (µp, σp2), and µp and σp are the mean and the standard deviation, respectively. The parameters can be generated by data, considering the parking location and time.
4 Spatial–temporal modeling of EV load redistribution during outages
The spatial–temporal modeling of EV load redistribution is the key for QoS assessment of the EVCN. When power outage occurs, the depleted EVs may reroute to other healthy FCSs for charging. Due to the driving distance of detour, higher energy consumption may cause increased charging demand at the destination FCS. Charging queues could be formed at the destination FCSs to accommodate the overwhelming charging demands from other offline FCSs. The EV drivers may randomly choose any FCS, which means the arrival SOC and the charging demand are random. This section models the stochastic processes of EV redistribution, including FCS selection, detour, and charging.
4.1 Spatial–temporal modeling of EV load redistribution
EV load redistribution is the phenomenon of the reroute of depleted EVs to the healthy FCS during the regional FCS outage. The stochastic process of FCS selection and detour should be comprehensively modeled by considering the residual SOC, the destination, and the possible paths for the detour route. The residual SOC not only determines whether the EV goes for charging at an FCS but also affects the selection of alternative healthy FCSs. The EV may be driven to the nearest healthy FCS if the residual SOC is low. On the other hand, en route charging on the way to the next destination is preferred. Given the origin and destination, there could be multiple paths for route selection. Generally, the shortest path is the first choice. However, the FCSs traversed within the path could be non-accessible due to the low residual SOC, power outage, or long queue by the overwhelming charging demand. If the EV cannot find the alternative FCS when all the FCSs of the shortest path have been traversed, the FCSs within the other paths to the destination could be the alternative. It is similar to mobile navigation applications that provide multiple paths to the destination. Therefore, multiple paths should be provided for the route and FCS selection to guarantee en route charging.
The finding of multiple paths can be formulated as a k shortest path problem, which is the extension of the shortest path problem. Yen’s algorithm provides an approach to find k shortest paths from one origin to a destination in a network.
Yen’s algorithm is a recursion method that adopts the idea of deviation path. It is suitable for directed acyclic graphs with non-negative edge weight, such as the EVCN. The pseudocode of Yen’s algorithm (Zhang et al., 2019) is shown in Table 1. The algorithm can be divided into two parts. First, the shortest path W(1) is obtained using the Dijkstra algorithm, and then other k-1 shortest paths W(2), …, W(i), …, W(k), i = 2, …, and k are calculated successively. When calculating W(i+1), all nodes on W(i) except the destination node are regarded as spur nodes q. The shortest path from each spur node to the destination node is calculated. The candidate path is formed by splicing the path from the origin node to the spur node on the previous W(i), and the shortest deviation path is obtained. The output of Yen’s algorithm is the k shortest paths from the origin to the destination. The lengths of these paths are incremental.

TABLE 1. Pseudocode of Yen’s algorithm for k shortest paths (Zhang et al., 2019).
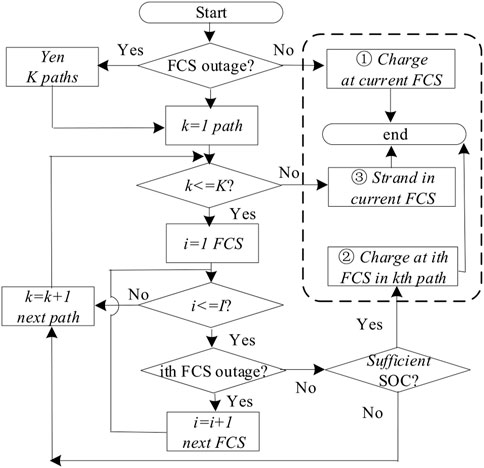
Figure 5 shows the flowchart of the procedure for the selection of the FCS and route. When a charging decision is made, the EV driver should judge the functionality of the desired FCS. Yen’s algorithm is conducted for calculating the k shortest paths to the destination of the next trip. The functionality of the nearest FCS for en route charging and the residual SOC is checked to guarantee the accessibility of the FCS. If the FCS is not accessible, the second nearest en route FCS could be the alternative. If all the FCSs of the shortest path are not accessible, the second shortest path is selected. This procedure is repeated until the en route FCS is found. The EV will proceed to the nearest FCS if all the FCSs within the k paths are not accessible.
4.2 Spatial–temporal modeling of the arrival rate at FCSs
Another key factor for EV redistribution modeling is the derivation of the FCS charging load. The stochastic FCS selection and detour randomly affect the spatial and temporal characteristics of the arrival and service rates of FCSs.
EVs arrive at FCSs in a random manner. The arrival rate is defined as the mean number of arriving EVs per unit time for charging in a regional FCS cluster. In an EVCN, the arrival rates of the FCS in different regions depend on the EV driver’s decisions of whether charging the EV at the region. The advantages of an FIS (fuzzy-logic inference system) lie in its simplicity and generality. The Mamdani-type FIS is applied to determine the charging probability. The concept of the FIS is close to human thinking because it uses fuzzy terms rather than crisp values. Different cases of each input’s fuzzy sets are evaluated according to if–then rules and membership functions. Due to its generalization, the FIS has been widely applied to emulate the decision-making process.
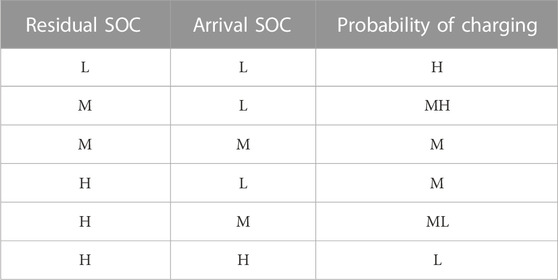
It is assumed that the residual battery SOC and the arrival SOC at the destination are the key factors influencing the charging decision. The crisp value of the residual and the arrival SOC is resolved into linguistic fuzzy sets described as low (L), medium (M), and high (H). The probability of charging (PC) is fuzzified as low (L), medium low (ML), medium (M), medium high (MH), and high (H). The fuzzy rule is shown in Table 2 with an “AND” operator. Generalized bell-shaped membership function is utilized to quantify the fuzzified residual SOC, arrival SOC, and charging probability. The center of gravity method is deployed in defuzzification.
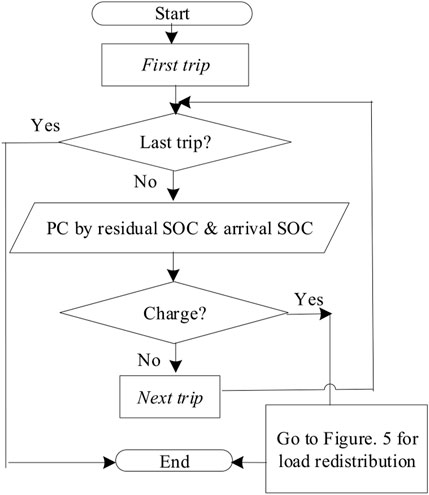
Figure 6 shows the flowchart for deducing the charging decision of an EV driver. The deduction of charging decision is iterated from the first trip to the last trip. The residual and arrival SOC is calculated as the inputs for obtaining the PC by the FIS. If a charging decision is made, the EV may consider whether the FCS is offline due to power outage and proceeds to the procedure shown in Figure 5.
In order to estimate the expected arrival rate of each region, Monte Carlo simulation (MCS) is employed to randomly obtain the arrival time t of multiple EVs at the sth FCS. The arrival pattern at a regional FCS cluster is simulated in Nd −1 days because the battery is assumed to be full before the first trip of the first simulation day. When Nd is sufficiently large, the probability of the single EV e’s arrival at the FCSs in region s and time t is
where
where λs,t is the arrival rate of the FCS of region s at time t; Ne is the total number of EVs;
4.3 Spatial–temporal modeling of the service rate at FCSs
Service rate is defined as the mean number of EVs that can be served by each charger per unit time in the region. A high service rate indicates the short charging duration and results in the low probability of congestion at the FCS. In order to determine the service rate of a regional FCS cluster, the arrival time, arrival SOC, and charging duration should be calculated.
The arrival time at the FCS can be calculated by the sum of departure time and driving time. We assume dumb charging because EVs charge immediately after arrival and stop charging until the battery is full. It is to be noted that partial charging is considered in this study to simulate the desired SOC, which may not be 100%. Let t1, t2, and tc denote the departure time, arrival time, and charging duration, respectively. Let u, d, and b be the specific energy consumption in kWh/km, trip distance in kilometer, and battery capacity in kWh, respectively. The arrival SOC is calculated by
The depleted EV is recharged to the desired SOC level in the FCS. The charging duration can be calculated by
where η and r are the charging efficiency of a DC fast charger and the fast charging rate in kW. It is noted that partial charging is modeled by parameter
4.4 Spatial–temporal estimation of EV charging load at FCSs
EV load redistribution may cause traffic congestion at FCSs, where the unacceptable long queues could be generated. For the continuous charging service provision, the number of fast chargers in the regions of an EVCN should be planned to satisfy the EV charging demand. The probability of queuing is defined as the index to measure the QoS of a regional FCS. The EV charging process can be formulated using the M/M/c queuing system, a multi-server Markov system based on first-come, first-served (FCFS). The service facility consists of c identical DC fast chargers, where the inter-arrival time and customer service time are assumed to follow an exponential distribution. To minimize the investment costs and ensure an acceptable QoS level, the number of chargers should be minimized, while limiting the probability of queuing to acceptable levels. The capacity planning of a regional FCS can be formulated as a non-linear integer programming (NLIP) problem (Yao et al., 2014).
The objective function is to minimize the number of chargers at region s (cs), which subjects to the probability of queuing being within an acceptable value
where n is the number of charging EVs. Usmax represents the maximum utilization factor at region s during 1 day, which usually happens in rush hours. After obtaining the number of chargers, the EV charging power of each region in the EVCN can be calculated by
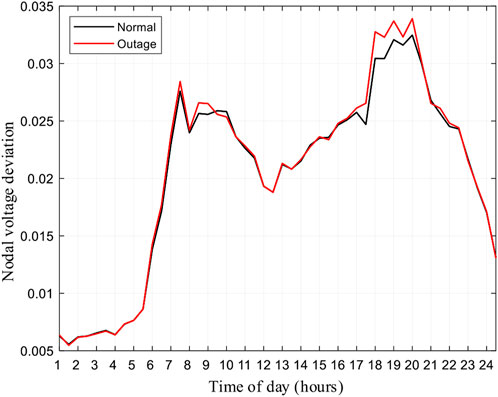
The redistribution of power flow originates from the redistribution of traffic flow and the charging demand. The local distribution system has to accommodate both the local and EVs from other systems, which may cause power system overloading such as voltage drop. Therefore, we proposed the index “nodal voltage deviation (NVD)” to evaluate the voltage drop caused by the redistribution of power flow.
5 Spatial–temporal QoS assessment of the EVCN
EV load redistribution alters the spatial–temporal distribution of the traffic flow and power flow of the coupled EVCN and power system. The impact of the redistribution of traffic flow and power flow should be considered in the QoS assessment. This section proposes the QoS indices that assess the spatial–temporal variation of congestions in both the EVCN and power system.
5.1 Spatial–temporal QoS indices
The redistribution of traffic flow stems from the power outage of the FCS. Generally, the number of chargers of an FCS is designed for capturing the local EV traffic flows. We use traffic intensity (TI) to obtain the minimum number of chargers required. In other words, to absorb the local traffic flow, we need TI chargers at least.
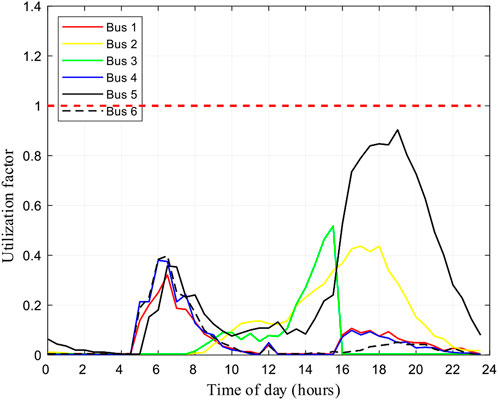
However, when power outage happens, the FCSs have to accommodate the traffic flow from other FCSs. The redistributed EV charging demands could be overwhelming for the FCS. The healthy FCSs may experience traffic congestion due to the extra charging demand from the offline FCS. Therefore, utilization factor is used to assess how busy the FCS is during the power outage.
1) Traffic intensity
Queuing theory provides an analytical method to evaluate the level of congestion in the FCSs. In queuing theory, TI is commonly used in traffic engineering, which is a measure of the total arrival traffic presented to a regional FCS cluster. A TI value greater than 1 indicates that EVs arrive faster than they are served. The physical meaning of the TI is the minimum number of chargers required to achieve a stable system. The TI of the sth regional FCSs at time t is defined by the average arrival rate divided by the service rate.
2) Utilization factor
The stable operation of the FCS could be assessed by queuing theory. Queuing theory provides a theoretical insight into the dynamics of the shared resources for better utilization and Quality-of-service. Utilization factor is an important measure for how busy the FCS are, which is defined as the fraction of time a charger is engaged in providing service. In a time interval (t, t + T), if there are N EVs in an FCS with c chargers, each charger will serve (λT)/c EVs. Given the service rate, the utilization factor of the sth regional FCSs at time t is defined by
The higher the utilization level, the longer the wait time is. As the utilization factor approaches unity (U = 1), the queue continues to grow without limit, and the system becomes unstable. The value of the utilization factor should be less than unity to satisfy the charging demand. The queuing system will not be stable if the utilization factor is greater than 1, which indicates potential congestion.
3) Nodal voltage deviation
The impact of EV load redistribution on the power system is analyzed by performing a power flow. The safety limit of the power system can be measured by the occurrence of overloading. We propose nodal voltage deviation (NVD) for the assessment of voltage drop. The NVD is designed to represent the voltage drop at node i and time t due to EV charging as
where Vi is the minimum voltage magnitude of node i, which is 1 p.u. In general, the voltage should be limited in the range between 0.97 and 1.03 p.u. So, the accepted NVD range is 0–0.03 with 1 p.u. as the minimum voltage magnitude.
5.2 Procedure of spatial–temporal QoS assessment of the EVCN considering power outage
The procedure of the modeling technique assesses the spatial–temporal QoS of the EVCN during power outage. The following steps are implemented:
1) Establish the coupled EVCN and power system. Determine the location and time of the power outage;
2) Randomly generate the daily trip chain, including the driving, parking, and charging patterns of Ne EVs in Nd-1 days by using MCS;
3) Randomly generate the detour and FCS selection for EV redistribution under power outage;
4) Calculate the arrival rate, service rate, and the charging load at region s and time t;
5) Calculate QoS indices for spatial–temporal impact assessment.
6 Results and discussions
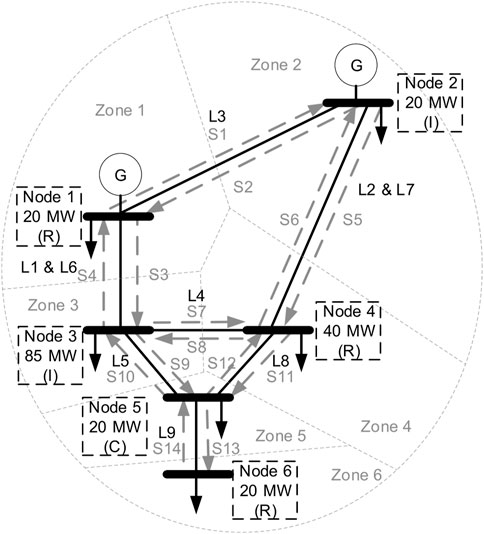
As shown in Figure 7, a coupled EVCN and power system is proposed based on the modified Roy Billinton test power system (RBTS) with a 20-MW peak base load at node 1. Six regions and nodes in the RBTS are proposed to represent the types of customers in different geographic areas such as residential (R), industrial (I), and commercial (C). The transmission lines and streets are represented by solid and dash lines, respectively. The free-flow velocity is assumed to be 28.5 km/h. The free-flow density of the streets is 34 veh/km/lane. A 30-min time resolution with 48 discrete time segments is simulated in a day.
According to the data of the RBTS system and NHTS, 35000 EVs are simulated in 100 days. The EV battery capacity is 16 kWh, and the charging power is 36 kW with 90% charging efficiency provided by the SAE J1772 standard. The specific energy consumption is 16.78 kWh/100 km due to EPA rated city fuel economy.
6.1 The minimum number of chargers required
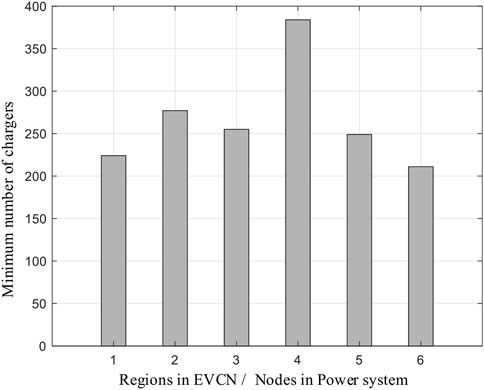
The traffic intensity reflects the minimum number of chargers required to meet the charging demands. Due to the spatial–temporal movement of EVs, the TI varies at different regions and times. The TI reaches its maximum value during rush hours. To prevent the traffic congestion at FCSs during rush hours, minimum number of chargers required for each region is designed to keep the queuing probability below 0.2. Figure 8 shows the number of DC fast chargers at different regions. It is observed that region 4 requires the highest number of chargers, where more households are located. The number of chargers is not proportional to the power demand of base load. The spatial–temporal movement of EVs among different types of regions is important for estimating the number of required chargers.
6.2 Spatial–temporal distribution of FCS loads in normal operation
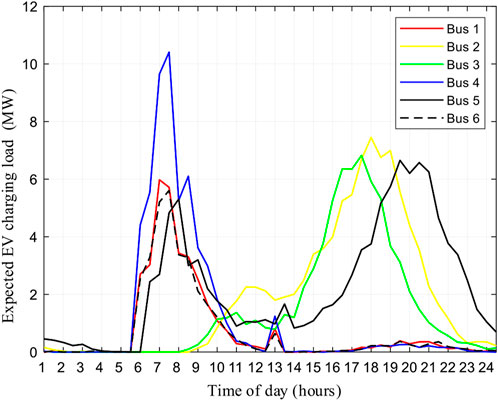
Figure 9 shows the expected EV loads in different buses/regions. High morning peaks of EV loads can be found in the residential areas of buses 1, 4, and 6. The reason is the SOC was depleted for the driving in the previous day. The EVs need to get recharged to carry out the daily trips. The highest peak is observed in bus 4 where most households are located. High peaks at the industrial areas can be found in the evening rush hour for the trips made from workplaces to home or commercial areas. Morning and evening peaks of EV loads at bus 5 are observed due to commuting trips. It can be summarized that the nodal EV loads vary in different regions and times. Different region types show distinct patterns of EV load distributions, which is strongly related to the spatial–temporal movement of EVs.
6.3 Spatial–temporal distribution of FCS loads considering power outage
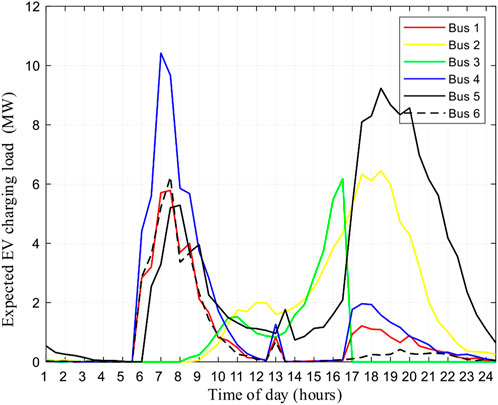
Figure 10 illustrates the spatial–temporal distribution of the regional EV load by imposing a power outage at node 3 from 16:30 to 24:00. Due to the EV load redistribution, the EV loads are moving from the industrial area at bus 3 to the residential area at bus 1 and 4 and the commercial area at bus 5. The EV loads of bus 1 increased from 0.21 to 1.2 MW, while an increment from 0.22 to 1.96 MW can be found at bus 4. The highest load increment from 6.2 to 9.2 MW is observed at bus 5. The reason is the depleted EVs detour to buses 1, 4, and 5 for en route charging. This phenomenon reveals that the power outage may significantly change the spatial–temporal EV load redistribution, which affects the service provision of healthy FCSs.
6.4 Impact of power outage on the EVCN and power system
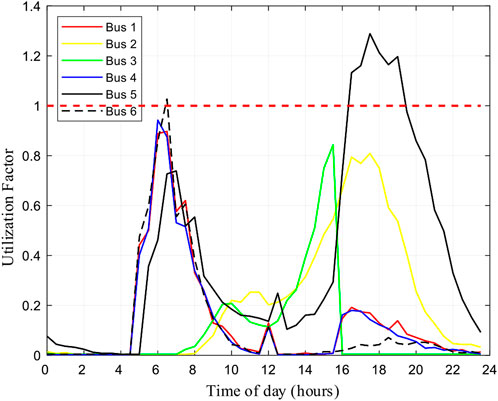
EV load redistribution may affect both the QoS of the EVCN and the nodal voltage level of the power system. As shown in Figure 11, the utilization factor of bus 5 becomes greater than 1 after the power outage. Potential traffic congestion and queues can be formed at the FCSs in bus 5, which may not be able to accommodate the overwhelming EV charging demand from the FCSs in bus 3.
Figure 12 compares the NVD of bus 6 in normal operation and during power outage. It is observed that EV load redistribution worsens the voltage drop at the bus with the remotest electrical distance such as bus 6. Both the EVCN and power system operators should pay more attention on EV load redistribution caused by power outage proactively and preventatively.
6.5 Penitential impact alleviation by partial charging
Partial charging could alleviate the impacts of an FCS power outage on the operations of the EVCN. In the simulation, we set the partial charging percentage to 50%, which indicates that the EV drivers will charge half of the energy required when he/she detours to the healthy FCS. As shown in Figure 13, it is evident that the surge of charging demand occurs at bus 5. However, the utilization factor is less than unity for the whole day by the adoption of partial charging during FCS outage.
7 Conclusion
This paper proposes an approach for the QoS assessment and alleviation of EV load redistribution caused by power outage in a coupled EVCN and power system. We modeled the daily trip chain by the MDP and MCS. Yen’s algorithm is adopted to simulate the multiple FCS and detour selections for en route charging at healthy FCSs. The FIS is utilized to model the decision-making process of charging. The spatial–temporal variation of EV load redistribution is evaluated by QoS indices for traffic congestion assessment. EV load redistribution may jeopardize the operation of coupled EVCN and power systems in the form of FCS traffic congestion and voltage drop. This could be the major concern for EVCN and power system operators during power outage. Proactive and preventative countermeasures such as partial charging should be implemented for impact alleviation of load redistribution. In the future work, the relationship among extreme weather, power system load shedding, and EV load redistribution should be investigated to identify the vulnerable components in the coupled EVCN and power system.
Data availability statement
The original contributions presented in the study are included in the article/Supplementary Material; further inquiries can be directed to the corresponding author.
Author contributions
DT wrote the first draft of the manuscript, including conceptualization, methodology, and simulation. XL completed the data analysis, including the data validation and visualization. TZ adjusted the structure and contributed to the polishing and revision of the manuscript. QW supervised the whole process of conceptualization, writing, and revision of the manuscript.
Funding
This work was supported by the National Natural Science Foundation of China under Grant 52277105.
Conflict of interest
The authors declare that the research was conducted in the absence of any commercial or financial relationships that could be construed as a potential conflict of interest.
Publisher’s note
All claims expressed in this article are solely those of the authors and do not necessarily represent those of their affiliated organizations, or those of the publisher, the editors, and the reviewers. Any product that may be evaluated in this article, or claim that may be made by its manufacturer, is not guaranteed or endorsed by the publisher.
References
Cheng, L., Chang, Y., Wu, Q., Lin, W., and Singh, C. (2014). “Evaluating charging service reliability for plug-in EVs from the distribution network aspect,” in IEEE Trans. Sustain Energy (IEEE), 1287–1296. doi:10.1109/TSTE.2014.2348575
Cui, Y., Hu, Z., and Duan, X. (2021). “Optimal pricing of public electric vehicle charging stations considering operations of coupled transportation and power systems,” in IEEE Trans. Smart Grid (IEEE), 3278–3288. doi:10.1109/tsg.2021.3053026
Hou, K., Xu, X., Jia, H., Yu, X., Jiang, T., Zhang, K., et al. (2018). “A reliability assessment approach for integrated transportation and electrical power systems incorporating electric vehicles,” in IEEE Trans. Smart Grid (IEEE), 88–100. doi:10.1109/TSG.2016.2545113
Huang, S., Wu, Q., Oren, S. S., Li, R., and Liu, Z. (2015). “Distribution locational marginal pricing through quadratic programming for congestion management in distribution networks,” in IEEE Trans. Power Syst. (IEEE), 2170–2178. doi:10.1109/TPWRS.2014.2359977
Hussain, A., Bui, V. H., and Kim, H. M. (2020). Optimal sizing of battery energy storage system in a fast EV charging station considering power outages. IEEE Trans. Transp. Electrification 7782 (20192010106750), 453–463. doi:10.1109/tte.2020.2980744
Li, Y., Ni, Z., Zhao, T., Zhong, T., Liu, Y., Wu, L., et al. (2020). Supply function game based energy management between electric vehicle charging stations and electricity distribution system considering quality of service. IEEE Trans. Industry Appl. 9994, 5932–5943. doi:10.1109/tia.2020.2988196
Liu, N., Hu, X., Ma, L., and Yu, X. (2022). Vulnerability assessment for coupled network consisting of power grid and EV traffic network. IEEE Trans. Smart Grid 13 (1), 589–598. doi:10.1109/TSG.2021.3112464
Liu, Z., Wu, Q., Oren, S. S., Huang, S., Li, R., and Cheng, L. (2018). Distribution locational marginal pricing for optimal electric vehicle charging through chance constrained mixed-integer programming. IEEE Trans. Smart Grid 9 (2), 644–654. doi:10.1109/TSG.2016.2559579
Lv, S., Wei, Z., Sun, G., Chen, S., and Zhang, H. (2020). “Power and traffic nexus: From perspective of power transmission network and electrified,” in IEEE Trans. Transp. Electrification (IEEE), 1–12. doi:10.1109/TTE.2020.3030806
Mao, D., Yuan, C., Gao, Z., Wang, J., and Zhao, R. (2019). Online prediction for transmission cascading outages induced by ultrafast PEV charging. IEEE Trans. Transp. Electrification 5 (4), 1124–1133. doi:10.1109/TTE.2019.2957098
Sheng, Y., Guo, Q., Yang, T., Zhou, Z., and Sun, H. (2019). “A potential security threat and its solution in coupled urban power-traffic networks with high penetration of electric vehicles,” in CSEE Journal of Power and Energy Systems (CSEE). doi:10.17775/CSEEJPES.2020.01460
Sheskin, T. J. (2016). Markov chains and decision processes for engineers and managers. Boca Raton: CRC Press.
Shin, H., and Baldick, R. (2017). Plug-in electric vehicle to home (V2H) operation under a grid outage. IEEE Trans. Smart Grid 8 (4), 2032–2041. doi:10.1109/TSG.2016.2603502
Sun, B., Tan, X., and Tsang, D. H. K. (2018). “Optimal charging operation of battery swapping and charging stations with QoS guarantee,” in IEEE Trans. Smart Grid (IEEE), 4689–4701. doi:10.1109/TSG.2017.2666815
Tang, D., and Wang, P. (2016). Probabilistic modeling of nodal charging demand based on spatial-temporal dynamics of moving electric vehicles. IEEE Trans. Smart Grid 7 (2), 1–636. doi:10.1109/TSG.2015.2437415
Ucer, E., Koyuncu, I., Kisacikoglu, M. C., Yavuz, M., Meintz, A., and Rames, C. (2019). Modeling and analysis of a fast charging station and evaluation of service quality for electric vehicles. IEEE Trans. Transp. Electrification 5 (1), 215–225. doi:10.1109/TTE.2019.2897088
Wang, B., Dehghanian, P., Wang, S., and Mitolo, M. (2019a). Electrical safety considerations in large-scale electric vehicle charging stations. IEEE Trans. Industry Appl. 55 (6), 6603–6612. doi:10.1109/TIA.2019.2936474
Wang, H., Abdin, A. F., Fang, Y., and Zio, E. (2022). Resilience assessment of electrified road networks subject to charging station failures. Computer-Aided Civ. Infrastructure Eng. 37 (3), 300–316. doi:10.1111/mice.12736
Wang, X., Shahidehpour, M., Jiang, C., and Li, Z. (2019b). Resilience enhancement strategies for power distribution network coupled with urban transportation system. IEEE Trans. Smart Grid 10 (4), 4068–4079. doi:10.1109/TSG.2018.2848970
Wang, Y., Yu, Y., Li, J., He, J., Liu, J., Zhang, Q., et al. (2020). Dynamic load restoration considering interdependency between power distribution system and urban transportation system. CSEE J. Power Energy Syst. 6 (4), 772–781. doi:10.17775/CSEEJPES.2020.02250
Wei, W., Wang, J., and Wu, L. (2016). Quantifying the impact of road capacity loss on urban electrified transportation networks: An optimization based approach. Int. J. Transp. Sci. Technol. 5 (4), 268–288. doi:10.1016/j.ijtst.2017.03.003
Wei, W., Wu, D., Wu, Q., Shafie-Khah, M., and Catalao, J. P. S. (2019). Interdependence between transportation system and power distribution system: A comprehensive review on models and applications. J. Mod. Power Syst. Clean Energy 7, 433–448. doi:10.1007/s40565-019-0516-7
Wu, F., Yang, J., Jialng, H., Zhang, X., Liao, S., Xu, J., et al. (2022). Cascading failure in coupled networks of transportation and power grid. Int. J. Electr. Power Energy Syst. 140, 108058. doi:10.1016/j.ijepes.2022.108058
Wu, F., Yang, J., Zhan, X., Liao, S., and Xu, J. (2021). The online charging and discharging scheduling potential of electric vehicles considering the uncertain responses of users. IEEE Trans. Power Syst. 36 (3), 1794–1806. doi:10.1109/TPWRS.2020.3029836
Yao, S., Wang, P., Liu, X., Zhang, H., and Zhao, T. (2020). Rolling optimization of mobile energy storage fleets for resilient service restoration. IEEE Trans. Smart Grid 11 (2), 1030–1043. doi:10.1109/TSG.2019.2930012
Yao, W., Zhao, J., Wen, F., Dong, Z., Xue, Y., Xu, Y., et al. (2014). A multi-objective collaborative planning strategy for integrated power distribution and electric vehicle charging systems. IEEE Trans. Power Syst. 29 (4), 1811–1821. doi:10.1109/TPWRS.2013.2296615
Yu, R., Zhong, W., Xie, S., Yuen, C., Gjessing, S., and Zhang, Y. (2016). Balancing power demand through EV mobility in vehicle-to-grid mobile energy network. IEEE Trans. Industrial Inf. 12 (1), 79–90. doi:10.1109/TII.2015.2494884
Zenginis, I., Vardakas, J., Zorba, N., and Verikoukis, C. (2018). Performance evaluation of a multi-standard fast charging station for electric vehicles. IEEE Trans. Smart Grid 9 (5), 4480–4489. doi:10.1109/TSG.2017.2660584
Zhang, H., Wang, P., Yao, S., Liu, X., and Zhao, T. (2020). Resilience assessment of interdependent energy systems under hurricanes. IEEE Trans. Power Syst. 8950, 3682–3694. doi:10.1109/tpwrs.2020.2973699
Zhang, X., Li, P., Hu, J., Liu, M., Wang, G., Qiu, J., et al. (2019). Yen’s algorithm-based charging facility planning considering congestion in coupled transportation and power systems. IEEE Trans. Transp. Electrification 5 (4), 1134–1144. doi:10.1109/TTE.2019.2959716
Zhou, Y., and Wang, X. C. (2014). Explore the relationship between online shopping and shopping trips: An analysis with the 2009 NHTS data. Transp. Res. Part A: Policy Pract. 70, 1–9. doi:10.1016/j.tra.2014.09.014
Nomenclature
G Graph
V Set of vertices
E Set of edges
W Walk/path in a graph
T Set of epochs
J Set of states
A Set of actions
P Set of transition probabilities
R Set of rewards
Keywords: electric vehicle, charging network, power outage, Quality-of-service, Markov decision process, queuing theory
Citation: Tang D, Liu X, Zhao T and Wang Q (2023) Spatial–temporal QoS assessment of the EV charging network considering power outages. Front. Energy Res. 11:1112169. doi: 10.3389/fenrg.2023.1112169
Received: 30 November 2022; Accepted: 01 March 2023;
Published: 21 March 2023.
Edited by:
Jinhao Meng, Sichuan University, ChinaReviewed by:
Mohammad Amir, Jamia Millia Islamia, IndiaAziz Rachid, University of Hassan II Casablanca, Morocco
Copyright © 2023 Tang, Liu, Zhao and Wang. This is an open-access article distributed under the terms of the Creative Commons Attribution License (CC BY). The use, distribution or reproduction in other forums is permitted, provided the original author(s) and the copyright owner(s) are credited and that the original publication in this journal is cited, in accordance with accepted academic practice. No use, distribution or reproduction is permitted which does not comply with these terms.
*Correspondence: Xiaofeng Liu, bGl1eGlhb2ZlbmdAbmpudS5lZHUuY24=
 Difei Tang
 Xiaofeng Liu
 Tianyang Zhao3
 Qi Wang