 Haifeng Zhang1
 Bingjie Xiu
 Benxin Li
- 1State Grid Jilin Electric Power Research Institute, Changchun, China
- 2School of Electrical Engineering, Northeast Electric Power University, Jilin, China
The accurate condition assessment of wind turbines greatly influences the refined asset management and maintenance scheduling of wind farms. To address the challenges of existing assessment methods in selecting the reliability value and determining wind turbine status levels of being in transition, this study proposes a wind turbine condition evaluation method based on asymmetric proximity. Firstly, the state evaluation index system consisting of the wind turbine performance and output state indices is constructed, and the weighting factors are calculated comprehensively by integrating the subjective and objective weights. Then, the membership function of the index layer is established based on the set pair analysis, and the membership of the target layer is deduced by the weighted average operator. Finally, the proximity degrees between status levels and target membership degrees are calculated, and the wind turbine state is determined based on the proximity principle. Case studies demonstrate that the accuracy rate of the proposed method is up to 97%, which is 6% and 8% higher than the maximum membership principle and the reliability criterion, respectively.
1 Introduction
The amount of installed wind power generation is growing substantially in order to reduce the fossil fuel consumption and carbon emission. In 2021, the global cumulative wind power capacity has reached 837 GW (GWEC, 2022). However, the wind power generations often operate in harsh environments and the maintenance and replacement costs are high. Therefore, how to accurately evaluate the health condition of wind turbines to meet the refined operation and maintenance needs of wind farms has become a hot issue (Peng et al., 2022).
The research on the condition evaluation of wind turbines is mainly divided into two categories: single-component condition evaluation and the whole wind turbine unit evaluation. The condition evaluation of a single component of a wind turbine is mainly focused on the fault diagnosis or life prediction of the component. Du et al. (2015) and Huang et al. (2021) proposed fault diagnosis methods for wind turbine gearbox based on sparse feature recognition and convolutional neural network respectively. To address the bearing fault diagnosis, the methods based on current-demodulated signals and SCADA data respectively were proposed in Gong et al. (2013) and Encalada-Dávila et al. (2021). In Li et al. (2022), an Improved Anti-Noise Residual Shrinkage Network was proposed to bearing fault diagnosis issue. Li et al. (2021) proposed a data-driven approach to monitor and identify the wind turbine generator bearing faults. Zhang et al. (2022) proposed a converter fault diagnosis method based on the relative current residuals and adaptive thresholds. Based on SCADA data, Wei et al. (2022) proposed an information-fusion method for pitch system aging evaluation, and Peter et al. (2022) proposed a novel wind turbine generator prognostics method. In Effi et al. (2022), a failure detection model for wind turbine gearbox was proposed based on cumulative sum of multivariate time series data. The above literatures have made an in-depth study on the state assessment of each single component of wind turbines, and benefits the operation and maintenance of the wind turbine components. However, the wind turbine is a complex system with multiple components coupled, and the overall state of the wind turbine cannot be reflected comprehensively rely solely on a single component condition assessment.
The whole wind turbine condition evaluation is to get approximately reasonable or reasonable wind turbine state based on SCADA data by using fuzzy inference, evidence theory, matter-element theory, cloud theory or other evaluation methods. Gonzalez et al. (2019) proposed a method for wind turbine performance monitoring using high-frequency SCADA data. Ding et al. (2021) presented a space-time analysis to quantify changes in power production performance of several wind turbines based on covariate matching method. Astolfi et al. (2022) proposed a data-driven evaluation method of wind turbine performance decline. Subsequently, Astolfi et al. (2022) proposed a SCADA-based method to assess the wind turbine performance. Ding et al. (2022) presented a brief overview of the existing turbine performance assessment methods and highlighted several important technical issues in turbine performance assessment. The maximum membership principle was applied to evaluate the abnormal operating state of the whole wind turbine via output power correlation in Dong et al. (2017). Set-pair analysis and evidence theory were proposed to address the uncertainty of the information during the state assessment of wind turbines in Zhou et al. (2017). Zhao et al. (2017) proposed a cloud model to optimize the weight and membership of the indices for wind turbine status assessment. Li et al. (2017) proposed a health condition assessment method for wind turbines considering information uncertainty by using Spark stream processing technology. The above literature has achieved good performance in processing the information uncertainty, and the maximum membership principle and reliability criterion are usually applied in decision-making of wind turbine state. However, the maximum membership principle remains challenging to determine the wind turbine status of being in transition because it only uses the maximum membership while ignoring the second largest membership which may dominates the wind turbine status especially when the first two largest membership are close. On the other hand, the accurate of the condition assessment result based on reliability criterion depends on the selection of the reliability value, inappropriate reliability value setting may lead to inconsistent state assessment of the wind turbine.
In view of the shortcomings of the above decision-making methods, this paper introduces asymmetric proximity into the field of wind turbine state assessment. Asymmetric proximity is a measure that uses fuzzy mathematics to describe the closeness of two sets. In the field of wind turbine state assessment, it is specifically shown as the degree of mutual agreement between the membership degree of the target layer and status level divided, and can avoid the disadvantages of information loss of the maximum membership and strong subjectivity of the reliability criteria (Wang et al., 2017).
In this paper, we propose a wind turbine condition evaluation method based on asymmetric proximity. The proposed method constructs the state evaluation index system consisting of the wind turbine performance and output state indices, and calculates the weighting factors comprehensively by integrating the subjective and objective weights. Then, the membership function of the index layer is established based on the set pair analysis, and the membership of the target layer is deduced by the weighted average operator. Finally, the proximity degrees between status levels and target membership degrees are calculated, and the wind turbine state is determined based on the proximity principle.
The contributions of proposed method are summarized as follows:
1) we proposed a condition assessment method for whole wind turbine based on asymmetric proximity.
2) we take both wind turbine performance indices and output state indices into consideration to construct he state evaluation index systems, in which the advantages of the improved analytic hierarchy process (IAHP) method and the inverse entropy weighting method are applied simultaneously to calculate the weighting factors comprehensively.
The rest of the paper is organized as follows. Section 2 describes the assessment index system. Section 3 introduces the index weighting method. Section 4 proposes the model for wind turbine condition evaluation. Section 5 verifies the validity and accuracy of the proposed method through case studies. The conclusion drawn from the study is provided in Section 6.
2 Wind turbine condition assessment index system
2.1 Principle of correlation
Since the active power output status can intuitively reflect the health condition of the wind turbine (Gill et al., 2012), Pearson’s correlation principle (Yang et al., 2016) is applied to analyze the correlation of power outputs between two wind turbines and the correlation related to wind speed and power output time series for the same wind turbine to construct the wind turbine condition assessment index system.
Cross-correlation coefficient refers to quantitatively describing the correlation of the power output variation between two wind turbines, which can effectively reflect the health condition of wind turbine to some extent. The cross-correlation coefficient between wind turbine i to be evaluated and the adjacent wind turbine j can be described as
Self-correlation coefficient refers to quantitatively describing the correlation between time series of the same variable. The difference between the self-correlation coefficients of power output and wind speed can reflect the operating conditions of wind turbines. As shown in formula (2).
Where
2.2 Establish an evaluation index system
In accordance with the principles of index independence, applicability and appropriateness, indices of leading wind turbine operation status are screened based on the historical sample data of typical wind turbine condition and monitoring projects. As shown in Figure 1, the evaluation index system consists of two project layers: component performance and power output status. The performance of important components of the wind turbine is reflected by the selected index layer of the status of the generator, gearbox, nacelle and pitch control system, and is applied to mapped the overall state of the wind turbine from the intrinsic component characteristics. The power output status indices are applied to reflect the overall state from the external overall characteristics. The constructed evaluation index system is shown in Figure 1, in which indices R111-R143, wind speed and unit output power are obtained by the wind farm SCADA system, and indices R211-R222 is obtained by analyzing wind speed and unit output power based on Pearson correlation principle.
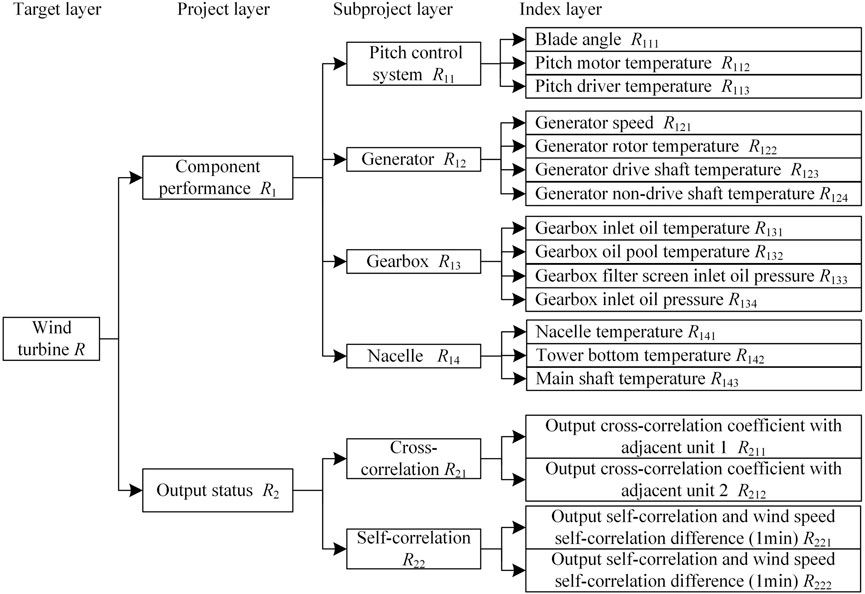
FIGURE 1. Hierarchical structure of wind turbine evaluation index.
Since the units and magnitudes of indices are different. In order to effectively analyze the mapping relationship between indices and the overall state of wind turbine, the data of indices are pre-processed by Max-Min normalization (Nan et al., 2021), and all the indices are discrete distributed into the interval [0,1]. The closer the normalized data is to 1, the better the reflected state is.
2.3 Status classification of wind turbine
There is no basis for the classification of wind turbine condition state in the existing wind turbine state evaluation models. Therefore, referring to Zhou et al. (2017), this paper divides the condition of wind turbines into four status levels, i.e., Z = [ z1, z2, z3, z4]. Where z1 indicates “normal state”, z2 indicates “attention state”, z3 indicates “abnormal state”, and z4 indicates “fault state”. The state descriptions and corresponding index thresholds are shown in Table 1.

TABLE 1. Wind turbine state levels and the normalized index interval thresholds.
3 Weighting of the condition evaluation indices
The existing methods on determining index weights are generally divided into subjective weighting method and objective weighting method. The subjective weighting method is generally based on expertise to calculate index weights to reflect the decision maker’s intention but is more subjective. The objective weighting method has strong mathematical theoretical support based on high data quality, however, the poor data will result in unreasonable weights. Aiming at the lack of the single index weighting method, this paper applies a comprehensive weighting method which takes expert experience and mathematical theory simultaneously into consideration.
3.1 Subjective weighting of index layer
In this paper, IAHP (Ge et al., 2019) is applied to subjective weighting for index layer as follows. Firstly, the indices of Rx,y,1,Rx,y,2, … ,Rx,y,n at Rx,y layer are ranked in descending order of importance. Then the relative importance of Rx,y,i and Rx,y,i+1 is compared to determine the scale value gi (Zhao et al., 2019). and so on to obtain the scale values g1, g2, .., gn-1 between all neighboring indices. Finally, the judgment matrix X as shown in (5) is obtained according to the transferability of the importance. Since the judgment matrix constructed by the scale values satisfies the consistency check, the subjective weights of the indices are calculated by (6).
3.2 Objective weighting of index layer
After the normalization of index data pretreatment, this paper uses the inverse entropy weighting method to calculate the objective weights of the indices. The basic steps are as follows.
1) Calculating inverse entropy.
For the evaluation index matrix
2) Determine objective weight
3.3 Calculation of the comprehensive weight
Based on the subjective weight
The comprehensive weight value is equal to the optimal solution of (9) as follows.
4 The proposed model for wind turbine condition evaluation
4.1 Set pair analysis
Set pair analysis is a method for quantitative analysis of uncertainty. The basic idea is to study the certainty and uncertainty of two objects from three aspects of identity, difference and contrary to describe the relationship between the two objects (Zhang et al., 2019).
For the set pairs H= (B1, B2) composed of two sets B1 and B2, the correlation degree of B1 and B2 can be expressed as (11).
In order to meet the multiple correlation requirements in some cases, coefficient b is expanded to obtain D-element correlation degree as (12).
4.2 Calculation of state membership based on set pair analysis
In this paper, the set pair analysis is used to quantify the degree to which each index belongs to the state level, and then the weighted average operator is used to push forward the degree to which the whole wind turbine belongs to the state level, i.e., the degree of membership of the target layer. Suppose a certain subproject layer set is Rx,y = {rx,y,1, rx,y,2,..., rx,y,n}, and the status level set Z = {z1, z2, z3, z4}. If a set pair H = {Rx,y, Z}is composed of the set Rx,y and set Z, then the 4-element correlation degree μx,y,l between the lth index in Rx,y and Z can be expressed as (13).
If the relationship between the status level and the threshold value of the index interval is shown in Table 2. The correlation degree between the normalized values of rx,y,l and the 4-level status, i.e., the membership degree between the index layer and the status levels, can be determined based on the fuzzy attribute rule as (14).
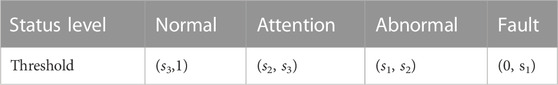
TABLE 2. Relationship between status level and interval threshold.
After obtaining the comprehensive weights and the membership of the indices, the membership of the subproject layer can be calculated by using the weighted average operator as (15). The schematic diagram of the membership degree of the indices is shown in Figure 2. Similarly, the membership degree of subproject layer and target layer in Figure 1 can be calculated.
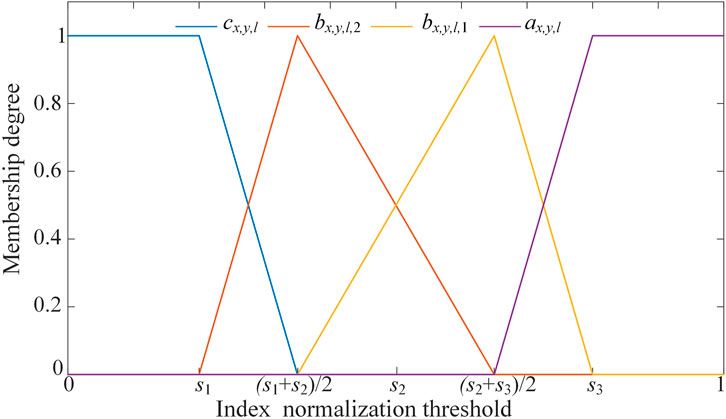
FIGURE 2. Schematic diagram of correlation degree and threshold.
4.3 Overall status level decision of wind turbine based on asymmetric proximity
Different from the maximum membership principle that only the maximum membership component is used to evaluate the wind turbine status, the asymmetric proximity method takes all membership components into consideration to evaluate wind turbines comprehensively. In addition, the asymmetric proximity method can avoid the setting of the reliability value which may lead to failure in wind turbine evaluation based on reliability criterion. Therefore, this paper applies he method of asymmetric proximity to calculate the closeness of status level and membership, and the wind turbine condition is determined according to the proximity principle.
Define the fuzzy sets Kp (∀p = 1,2,3,4) representing status levels of wind turbine as K1= (1, 0, 0, 0), K2= (0, 1, 0, 0), K3= (0, 0, 1, 0), K4= (0, 0, 0, 1), respectively. Then the membership degree μ = {μ1, μ2, μ3, μ4} of the target layer and the fuzzy set Kp corresponding to the status level should be standardized. The standardization process of μ is shown in Figure 3, and the following steps to evaluate wind turbine condition based on asymmetric proximity are as follows.
1) Given Q = {q1,q2, q3,q4} = {1,2,3,4} and initialize p = 1.
2) ∀i,j∈Q and i≠j, reorder the elements of μ according to the size of | qi-p | and | qj-p | to construct a new vector μ p.
3) Compare whether the current p satisfies p = 4. If yes, the standardization process ends, and output μ1, μ2, μ3, μ4. If not, make p = p+1, and return to step 2).
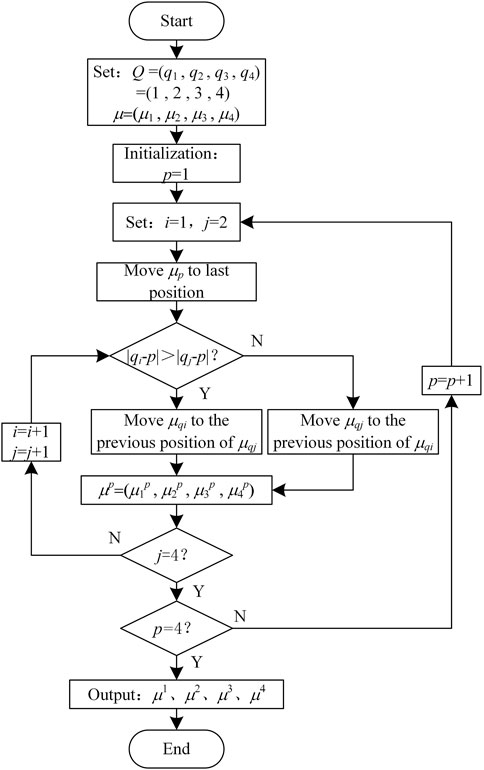
FIGURE 3. Standardization process of membership degree of target layer.
Similarly, Kp is standardized to obtain Kp'.
Based on the standardized result above, the asymmetric proximity between the membership degree of the target layer and the status level zp can be expressed as (18).
After obtaining the asymmetric proximity degree between the membership degree of the target layer and all status levels through (18), the status level zp corresponding to max N (μp, Kp’) is the status level evaluation result of the overall wind turbine (Li et al., 2008). If the evaluated wind turbine status level is abnormal or fault, the component of wind turbine to be maintenance could be found by the fuzzy fault Petri net model (Huang et al., 2022) according to the condition monitoring information of pitch system, generator and gearbox, et al.
The state evaluation process of the whole wind turbine is shown in Figure 4.
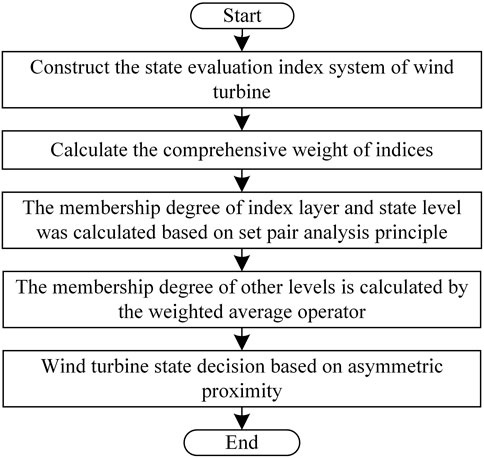
FIGURE 4. Diagram of wind turbine state evaluation process.
5 Case studies
In this section, the validity of the proposed method was verified by using SCADA data from a wind farm built in December 2011. There are 32 wind turbines with the type of 1.5 MW double-fed induction generator in this wind farm. The SCADA system collects data every minute from May 2016 and has accumulated a big data to assess the wind turbines up to now.
5.1 Correlation analysis of wind turbine output
Figure 5 shows the output cross-correlation coefficients of the four adjacent wind turbines in normal or attentional state for 7 days from 1 October2021 to 7 October2021. It can be found that the cross-correlation coefficient of adjacent wind turbine power outputs in normal or attentional condition are above 0.85, and the output power correlation is very strong.

FIGURE 5. Output cross-correlation coefficients of adjacent wind turbines.
Figure 6 shows the statistical data of the difference between the self-correlation coefficients of the output and wind speed with the corresponding self-correlation delay of 1min and 5min. The statistical data is derived from the SCADA data which dates from 1 October2021 to 7 October2021. The values corresponding to 1min and 5min delay are below 0.035 and 0.04 respectively, and it can be concluded that there is a strong correlation between wind turbine power output and wind speed in normal or attentional state.
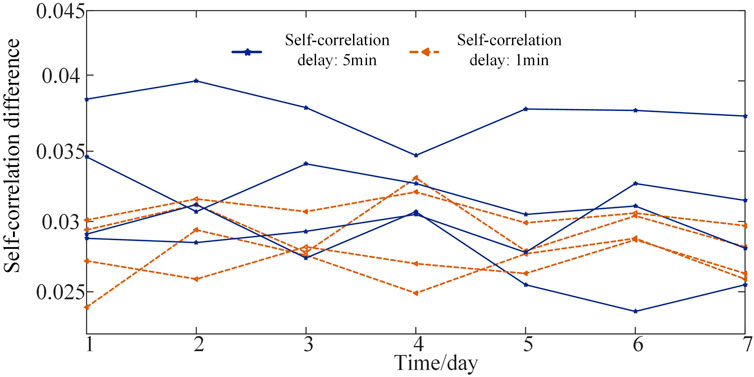
FIGURE 6. Self-correlation coefficient differences between unit output and wind speed.
The output state of wind turbine can reflect the operating state of the whole machine to a certain extent. The mapping relationship between the output characteristics of wind turbine and the operating state of wind turbine is defined based on the statistical samples from August 2019 to October 2021, as shown in Table 3 and Table 4.
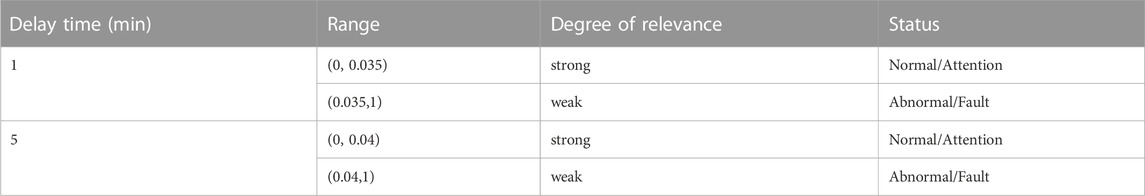
TABLE 3. Mapping between the difference of self-correlation coefficient and the state of the whole machine.
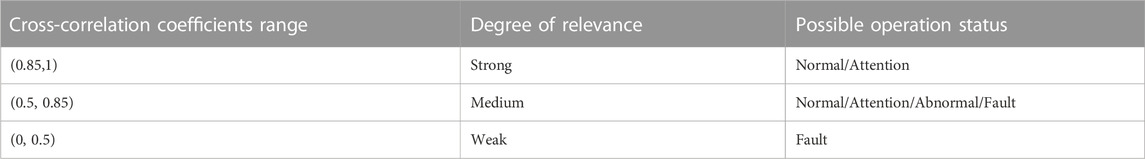
TABLE 4. Mapping of output cross-correlation coefficients and wind turbine states.
The following section combines the condition monitoring information of each subsystem and sets up different cases to accurately evaluate the wind turbine monitoring data.
5.2 The validity analysis of the proposed method for wind turbine condition evaluation
In order to verify the feasibility and advantages of the proposed wind turbine evaluation method in this paper, three groups of historical SCADA data set of a 1.5 MW double-fed induction generator in the farm (as shown in Table 5) are selected as the test data sets. From the operation and maintenance log, the actual condition of the wind turbine corresponding to data1, data2, and data3 is “attention state”, “attention state” and “fault state” respectively in which the gearbox inlet oil temperature R131 in data one deviate slightly from its benchmark, the generator rotor temperature R122 in data two is higher than that in normal state since the overload operation of the wind turbine which leads to a slightly tendency to deteriorate, and the screen inlet oil and inlet oil pressure of gearbox in data3 are too low, which lead to poor gearbox lubrication and serious gearbox gear wear. On the basis of comprehensive weighting, four cases are presented for detailed comparative analysis.
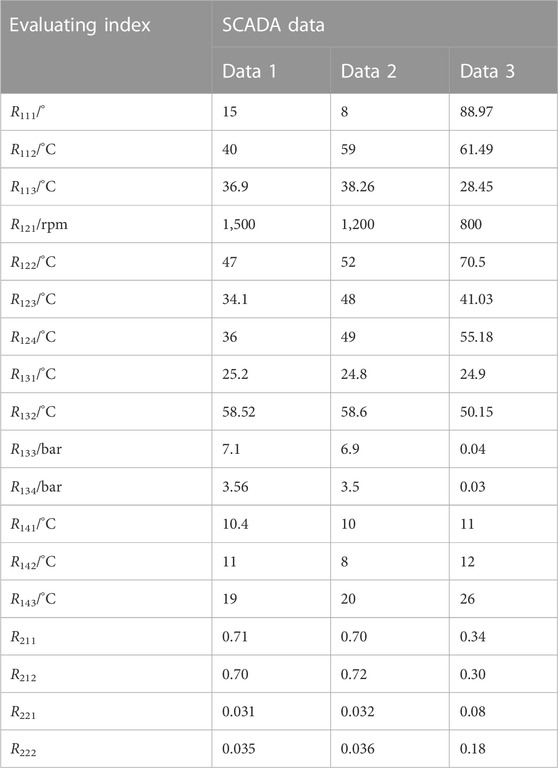
TABLE 5. SCADA data of a 1.5 MW wind turbine.
Case 1. wind turbine condition evaluation method based on the maximum membership principle (Li et al., 2013).
Case 2. wind turbine condition evaluation method based on reliability criterion, in which the reliability value is set to be 0.6 (Liao et al., 2010).
Case 3. wind turbine condition evaluation method based on reliability criterion, in which the reliability value is set to be 0.7.
Case 4. the proposed method in this paper.The comparison of wind turbine condition evaluation results in four cases are listed in Table 6.Case 1 has a good performance when evaluating the status of wind turbine based on data one and data 3. However, the evaluated status of wind turbine corresponding to data two is “abnormal” deviating from the actual status “attention”. The reason that case 1 fails to evaluate the wind turbine status corresponding to data two accurately is that the maximum membership component of data2 is 0.3336 and the sub-maximum membership component is 0.3333. The maximum and sub-maximum membership components are too close to comprehensively assess the status of wind turbines relying solely on the maximum membership component especially when the health condition of wind turbine is of being in transition.
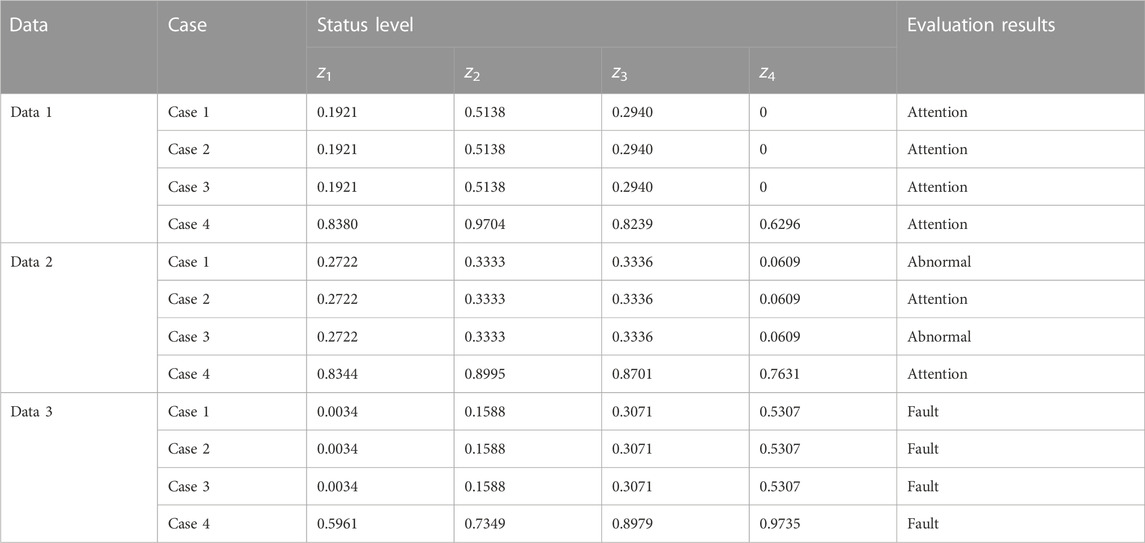
TABLE 6. Comparison of the evaluation results in different cases.
Case 2and Case 3 both apply the reliability criterion to determine the status of the wind turbine, but the reliability value settings are different. By comparing the results of case 2 with case 3, the evaluated result of case 3 on data 2 is abnormal which deviates from the actual attention state due to the improper setting of the reliability value.The evaluation results of case 4 corresponding to data 1, data 2, and data three are all consistent with the actual status of the wind turbine. Case 4 not only makes full use of the information of each component to avoid the limitations of the maximum membership principle that fail to evaluate status of wind turbine during state transition period, but also avoids the issue of the improper setting of the reliability value which may lead to the failure of the state assessment of wind turbine.We verify the effectiveness of the method proposed in this paper further by using 100 data sets similar to Table 5 from the wind farm. The data sets were collected from 32 wind turbine SCADA data in the wind farm from August 2019 to October 2021 consisting of 25 SCADA data sets for each state (normal, attention, abnormal and fault state) recorded in the operation and maintenance log. The overall state of the wind turbine is evaluated by case 1, case 2 and case 4 respectively. The comparison results of the positive judgment rates of different cases are shown in Table 7.As can be seen from Table 7, the average positive judgment rate of the case4 is 97%, which is 6% and 8% higher than case 1 and case 2, respectively. In the state of transition process, case 1 fails in some samples due to the maximum membership component approximately equaling to the second maximum component. The accurate of case 2 depends on the setting of reliability value. That is why the reliability criterion method encounters failure in assess some samples of wind turbine status. Case 4 can overcome the limitations of the subjective selection of reliability value and the maximum membership principle. Although the method proposed in this paper is relatively complex, it has a higher positive judgment rate and is more suitable for evaluating wind turbines of being in transition state. It should be pointed out that the proposed method will still face the limitations of failing to evaluate the wind turbines accurately when the maximum proximities of the evaluated sample data to different states are approximately equal.
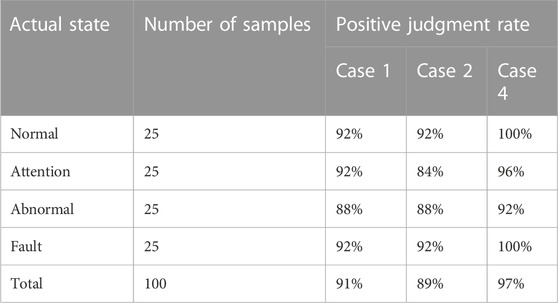
TABLE 7. Compare the positive judgment rates of different cases.
5.3 Analysis of influence of different weighting methods on wind turbine condition evaluation results
In order to illustrate the effectiveness of the weighting method used in this paper, we using the data sets in Table 5 to present a detailed analysis and comparison of the following two weighting methods to evaluate the status of wind turbine base on asymmetric proximity.
Case 1Subjective weighting based on AHP method (Liu et al., 2022).
Case 2Comprehensive weighting based on IAHP- inverse entropy method.Table 8 shows the results of the wind turbine condition assessment in two cases. Case 1 only uses AHP to calculate index weights subjectively ignoring weighting from an objective perspective. As a result, the evaluation result of data2 in case 1 deviates from its actual state. However, the evaluation results of data1∼data three in case2 are the same to the actual state. As can be seen from the comparison, the comprehensive weighting method that takes subjective and objective weights into consideration is more reasonable and effective in the weighting process of wind turbine state assessment.
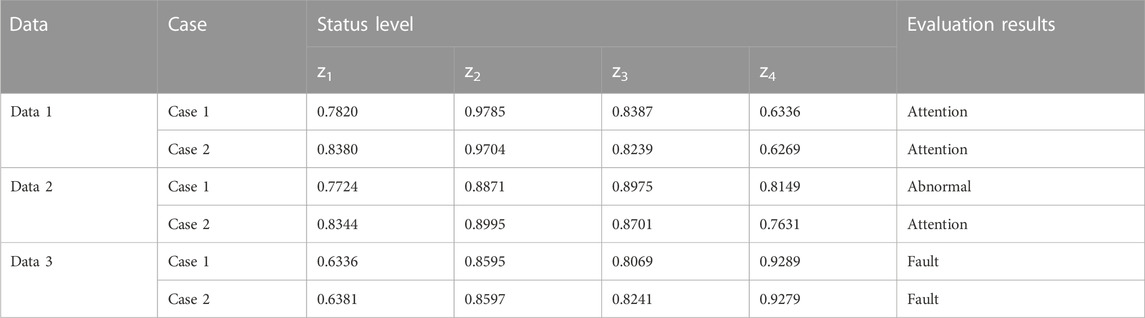
TABLE 8. Comparison results of different weighting methods.
6 Conclusion
This paper proposes a wind turbine state evaluation method based on asymmetric proximity. The correctness and effectiveness of the proposed method are verified by using 2 years data from 32 wind turbines in the same wind farm. The conclusions are as follows.
1) The comprehensive weights not only reflect the influence of experts’ subjective experience but also have a strong mathematical theory support to reflect the objectivity of the weighting process, it is more reasonable and contributes to accurate assessment of wind turbine status in the proposed wind farm.
2) The wind turbine condition evaluation method based on asymmetric proximity proposed in this paper not only makes full use of the information of each component, but also avoids the limitations of the subjective setting of the reliability value for the reliability criterion. The proposed evaluation method has a better performance in wind turbine condition assessment issue especially in the status level of being transition.
Data availability statement
The original contributions presented in the study are included in the article/supplementary material, further inquiries can be directed to the corresponding author.
Author contributions
All authors listed have made a substantial, direct, and intellectual contribution to the work and approved it for publication.
Funding
This work is supported by State Grid Jilin Electric Power Company Science and Technology Project (SGJLDK00DWJS2100019).
Conflict of interest
The authors declare that the research was conducted in the absence of any commercial or financial relationships that could be construed as a potential conflict of interest.
Publisher’s note
All claims expressed in this article are solely those of the authors and do not necessarily represent those of their affiliated organizations, or those of the publisher, the editors and the reviewers. Any product that may be evaluated in this article, or claim that may be made by its manufacturer, is not guaranteed or endorsed by the publisher.
References
Astolfi, D., Pandit, R., Celesti, L., Vedovelli, M., Lombardi, A., and Terzi, L. (2022a). Data-driven assessment of wind turbine performance decline with age and interpretation based on comparative test case analysis. Sensors 22 (9), 3180. doi:10.3390/s22093180
Astolfi, D., Pandit, R., T erzi, L., and Lombardi, A. (2022b). Discussion of wind turbine performance based on SCADA data and multiple test case analysis. Energies 15 (15), 5343. doi:10.3390/en15155343
Ding, Y., Barber, S., and Hammer, F. (2022). Data-Driven wind turbine performance assessment and quantification using SCADA data and field measurements. Front. Energy Res. 2. doi:10.3389/fenrg.2022.1050342
Ding, Y., Kumar, N., Prakash, A., Kio, A. E., Liu, X., Liu, L., et al. (2021). A case study of space-time performance comparison of wind turbines on a wind farm. Renew. Energy 171, 735–746. doi:10.1016/j.renene.2021.02.136
Dong, W., Li, Z., and Xu, L. (2017). Abnormal operational condition evaluation and fault diagnosis of wind turbine based on output power correlation. Power Syst. Prot. Control 45 (9), 18–25. doi:10.7667/PSPC160661
Du, Z., Chen, X., Zhang, H., and Yan, R. (2015). Sparse feature identification based on union of redundant dictionary for wind turbine gearbox fault diagnosis. IEEE Trans. Industrial Electron. 62 (10), 6594–6605. doi:10.1109/TIE.2015.2464297
Effi, L., Shawn, S., and Ding, Y. (2022). Wind turbine gearbox failure detection through cumulative sum of multivariate time series data. Front. Energy Res. 10. doi:10.3389/fenrg.2022.904622
Encalada-Dávila, Á., Puruncajas, B., Tutivén, C., and Vidal, Y. (2021). Wind turbine main bearing fault prognosis based solely on SCADA data. Sensors 21 (6), 2228. doi:10.3390/s21062228
Ge, Z. Q., and Liu, Y. (2018). Analytic hierarchy process based fuzzy decision fusion system for model prioritization and process monitoring application. IEEE Trans. Industrial Inf. 15, 357–365. doi:10.1109/TII.2018.2836153
Gill, S., Stephen, B., and Galloway, S. (2012). Wind turbine condition assessment through power curve copula modeling. IEEE Trans. Sustain. Energy 3 (1), 94–101. doi:10.1109/TSTE.2011.2167164
Gong, X., and Qiao, W. (2013). Bearing fault diagnosis for direct-drive wind turbines via current-demodulated signals. IEEE Trans. Industrial Electron. 60 (8), 3419–3428. doi:10.1109/tie.2013.2238871
Gonzalez, E., Stephen, B., Infield, D., and Melero, J. (2019). Using high-frequency SCADA data for wind turbine performance monitoring: A sensitivity study. Renew. Energy 131, 841–853. doi:10.1016/j.renene.2018.07.068
Huang, R., Lu, X., Liang, Z., Gao, P., and Liang, T. (2022). Modeling and simulation analysis of solar thermal electric plants based on petri net. Energy Eng. 119 (4), 1711–1728. doi:10.32604/ee.2022.019128
Huang, X., Li, Y., and Chai, Y. (2021). Intelligent fault diagnosis method of wind turbines planetary gearboxes based on a multi-scale dense fusion network. Front. Energy Res. 9. doi:10.3389/fenrg.2021.747622
Li, G., Zhang, J., and Wen, F. (2017). Evaluation of real-time health condition for wind turbines considering information uncertainty. Automation Electr. Power Syst. 41 (18), 111–117. doi:10.7500/AEPS20170210001
Li, H., Deng, J., Yuan, S., Feng, P., and Arachchige, D. (2021). Monitoring and identifying wind turbine generator bearing faults using deep belief network and EWMA control charts. Front. Energy Res. 9. doi:10.3389/fenrg.2021.799039
Li, H., Hu, Y., Yang, C., Chen, Z., Ji, H., and Zhao, B. (2013). An improved fuzzy synthetic condition assessment of a wind turbine generator system. Electr. Power Energy Syst. 45, 468–476. doi:10.1016/j.ijepes.2012.09.014
Li, J., Xu, X., and Shi, K. (2008). Rough similarity degree and rough close degree in rough fuzzy sets and the applications. J. Syst. Eng. Electron. 19, 945–951. doi:10.1016/S1004-4132(08)60180-2
Li, X. (2022). Bearing fault diagnosis method of wind turbine based on improved anti-noise residual shrinkage network. Energy Eng. 119 (2), 665–680. doi:10.32604/ee.2022.019292
Liao, R., Zheng, H., Yang, L., Zhang, Y., Huang, F., and Sun, C. (2010). A power transformer insulation condition assessment method based on set pair analysis. Automation Electr. power Syst. 34 (21), 55–60.
Liu, G., Zhang, C., Zhu, Z., and Wang, X. (2022). Power quality assessment based on rough AHP and extension analysis. Energy Eng. 119 (3), 929–946. doi:10.32604/ee.2022.014816
Nan, D., Wang, W., Zhang, L., Chen, K., Yang, G., Zhang, L., et al. (2021). Risk assessment of the operation state of power grid secondary equipment based on association rule mining and combination weighting-cloud model. Power Syst. Prot. Control 49 (10), 67–76. doi:10.19783/j.cnki.pspc.210022
Peng, J., Kiming, A., Niu, Z., Wang, J., Liu, X., Wang, D., et al. (2022). Wind turbine failure prediction and health assessment based on adaptive maximum mean discrepancy. Int. J. Electr. Power Energy Syst. 134, 107391. doi:10.1016/j.ijepes.2021.107391
Peter, R., Zappalá, D., Schamboeck, V., and Watson, S. J. (2022). Wind turbine generator prognostics using field SCADA data Journal of Physics: Conference Series. IOP Publ. 2265 (3), 032111. doi:10.1088/1742-6596/2265/3/032111
Wang, R., and Xi, X. (2017). On the safety warning to be made based on the fuzzy entropy and asymmetric proximity. J. Saf. Environ. 17 (3), 829–834. doi:10.13637/j.issn.1009-6094.2017.03.004
Website global wind energy council (GWEC) (2022). https://www.sgpjbg.com/baogao/68756.html.
Wei, L., Qian, Z., Zareipour, H., and Zhang, F. (2022). Comprehensive aging assessment of pitch systems combining SCADA and failure data. IET Renew. Power Gener. 16 (1), 198–210. doi:10.1049/rpg2.12281
Yang, X., Song, D., Liu, D., and Wang, F. (2016). “Node grouping for low frequency oscillation based on Pearson correlation coefficient and its application,” in Proceedings of the 2016 IEEE International Conference on Power System Technology (POWERCON), Wollongong, NSW, Australia, 28 September 2016. doi:10.1109/POWERCON.2016.7753976
Zhang, R., Wang, Y., Wang, K., Zhao, H., Xu, S., Mu, L., et al. (2019). An evaluating model for smart growth plan based on BP neural network and set pair analysis. J. Clean. Prod. 226, 928–939. doi:10.1016/j.jclepro.2019.03.053
Zhang, W., Ling, Q., Zhao, Q., and Wu, H. (2022). Open-circuit faults diagnosis in direct-drive PMSG wind turbine converter. Energy Eng. 118 (5), 1515–1535. doi:10.32604/EE.2021.014162
Zhao, H., Zhang, J., and Li, L. (2017). Fuzzy comprehensive assessment of wind turbines status based on optimal weight and membership cloud. Electr. Power 50 (5), 88–94. doi:10.11930/j.issn.1004-9649.2017.05.088.07
Zhao, S., and Tang, S. (2019). Comprehensive evaluation of transmission network planning case based on improved analytic hierarchy process CRITIC method and TOPSIS. Electr. Power Autom. Equip. 39 (3), 143–148. doi:10.16081/j.issn.1006-6047.2019.03.023
Zhou, Q., Xu, Q., Li, J., Wang, W., and Xiang, C. (2017). Operating state assessment based on set-pair analysis and evidential reasoning decision-making for wind turbine generator unit. Electr. Power Autom. Equip. 37 (7), 38–45. doi:10.16081/j.issn.1006-6047.2017.07.007
Glossary
Parameters
S Number of samples
rt(Pi,Pj) Output cross-correlation coefficient of wind turbine i and j
ξ(rt, rw) Difference between wind turbine output self-correlation coefficient and wind speed self-correlation coefficient
rt(Pt1,Pt2) The output self-correlation coefficient of the wind turbine to be evaluated at time t1 and time t2
rw(Vt1,Vt2) Self-correlation coefficient of wind speed at time t1 and time t2
a The identity degree of set R and set Z
bi The difference degree of set R and set Z
c The opposition degree of set R and set Z
bt The level t difference
it Composition of difference uncertainty coefficient
rx,y,l The lth index layer of the yth subproject layer in the xth project layer
ax,y,l Correlation degree between index rx,y,l and z1 state
bx,y,l,1 Correlation degree between index rx,y,l and z2 state
bx,y,l,2 Correlation degree between index rx,y,l and z3 state
cx,y,l Correlation degree between index rx,y,l and z4 state
s1 State level thresholds. In this paper, s1 = 0.2
s2 State level thresholds. In this paper, s2 = 0.5
s3 State level thresholds. In this paper, s3 = 0.8
μ Membership degree of the target layer
μp Membership degree of the standardized target layer
Kp Fuzzy set of features corresponding to the state level
Kp’ The fuzzy set of features corresponding to the standardized state level
v Adjustment factor. In this paper, v = 1
Variables
Pi,s Active output of wind turbine i at the sth sampling point
Pj,s Active output of wind turbine j at the sth sampling point
Pi,av Average value of active power output of wind turbine i during the sampling period
Pj,av Average value of active power output of wind turbine j during the sampling period
Pt1,s Output value of the sth sampling point in t1 time series of the wind turbine to be evaluated
Pt2,s Output value of the sth sampling point in t2 time series of the wind turbine to be evaluated
Pt1,av Average output value of t1 time series of the wind turbine to be evaluated
Pt2,av Average output value of t2 time series of the unit to be evaluated
Vt1,s Wind speed values at the sth sampling point of t1 time series
Vt2,s Wind speed values at the sth sampling point of t2 time series
Vt1,av Average values of wind speed in t1
Vt2,av Average values of wind speed in t2
r* ij Index value after normalization pretreatment.
Keywords: wind turbine, set pair analysis, status assessment, asymmetric proximity, comprehensive weight
Citation: Zhang H, Xiu B, Jiang D, Zhuang G, Zhang Y and Li B (2023) An evaluation method of health condition for wind turbine based on asymmetric proximity. Front. Energy Res. 11:1111355. doi: 10.3389/fenrg.2023.1111355
Received: 29 November 2022; Accepted: 11 January 2023;
Published: 01 February 2023.
Edited by:
Fouzi Harrou, King Abdullah University of Science and Technology, Saudi ArabiaReviewed by:
Davide Astolfi, University of Perugia, ItalyXingwu Zhang, Xi’an Jiaotong University, China
Copyright © 2023 Zhang, Xiu, Jiang, Zhuang, Zhang and Li. This is an open-access article distributed under the terms of the Creative Commons Attribution License (CC BY). The use, distribution or reproduction in other forums is permitted, provided the original author(s) and the copyright owner(s) are credited and that the original publication in this journal is cited, in accordance with accepted academic practice. No use, distribution or reproduction is permitted which does not comply with these terms.
*Correspondence: Benxin Li, YnhsaUBuZWVwdS5lZHUuY24=