 Dennis Keiser
  Eric Woolstenhulme
- Nuclear Fuels and Materials Division, Idaho National Laboratory, Idaho Falls, ID, United States
Low-enriched (LEU) U-ZrH fuel, with a235U content less than 20% of the total uranium, is being evaluated for possible use in different types of reactors, including space nuclear systems, light water reactors (LWRs) and micro-reactors. As a result, it is beneficial to better understand the macrostructural and microstructural changes that occur in this fuel during irradiation. This paper reports the results of the post irradiation examination of an LEU U-ZrH fuel element (30 wt.% U, <20% 235U) using neutron radiography, precision gamma scanning, chemical analysis, optical metallography and scanning electron microscopy combined with energy dispersive spectroscopy and wavelength dispersive spectroscopy, where the fuel element was irradiated in a Training, Research, Isotope, General Atomics (TRIGA) reactor. Results of microstructural characterization indicated some dehydriding and cracking of the U-ZrH fuel occurred during irradiation; an axial and radial burnup gradient existed in the fuel during irradiation, as measured by gamma scanning and chemical analysis; negligible microstructural changes transpired during irradiation, based on comparison of irradiated and as-fabricated U-ZrH fuel microstructures; and, negligible, fission product-rich, phases could be resolved in a U-ZrH fuel that was irradiated to a calculated 20% depletion of 235U.
1 Introduction
TRIGA (Training, Research, Isotope, General Atomics) reactors were developed in the 1950s to act as safe reactors that could be constructed around the world (Fouquet et al., 2003). A U-ZrH fuel was developed as the fuel for these reactors, and its chemical formula is U0.31ZrH1.6, which corresponds to a nominal Zr/U atom ratio of 3.2 and a nominal H/Zr atom ratio of 1.6 (Olander and Ng, 2005). The cladding for a TRIGA fuel element is typically Type 304 stainless steel (SS) with a graphite reflector slug at each end. A Mo diffusion disc is present at the bottom. The fuel pellets have a concentric hole in the center where a solid zirconium rod is inserted in each fuel meat during assembly. Erbium can be added to the fuel as a burnable absorber to increase the core lifetime in a high-power reactor (Simand et al., 1976). The first exported TRIGA reactor was designed for the U.S. exhibit at the Second Geneva Conference on the Peaceful Uses of Atomic Energy in 1958. Over 6,000 fuel elements of seven distinct types were fabricated for use in the first 60 TRIGA research reactors. Some of the unique safety features for this reactor type include a prompt negative temperature coefficient of reactivity, high fission product retention, chemical stability when quenched from high temperatures in water, and dimensional stability over large swings of temperature (GA Technologies, 1992).
U-ZrH fuel has been evaluated for use in different types of reactors, including space nuclear systems (Zinkle et al., 2002), light water reactors (LWRs) (Olander and Ng, 2005; Olander, 2009; Olander et al., 2012; Terrani et al., 2017), and micro-reactors such as the Microreactor Applications Research Validation and EvaLuation (MARVEL) reactor (American Nuclear Society, 2021). An evaluation of the literature shows that information from detailed microstructural characterization using techniques like electron microscopy of as-irradiated U-ZrH fuel is lacking. A few images from scanning electron microscopy (SEM) analysis are available in (Terrani et al., 2017; Meyer et al., 2020). The goal of this paper is to report the results of detailed characterization of U-ZrH fuel in an as-irradiated TRIGA fuel element using neutron radiography (NR), precision gamma scanning (PGS), optical metallography (OM), and scanning electron microscopy (SEM) combined with energy dispersive spectroscopy (EDS) and wavelength dispersive spectroscopy (WDS). Comparisons will be made to results from the microstructural characterization of an as-fabricated U-ZrH fuel element reported in another paper (Keiser et al.).
2 Experimental
Two irradiated TRIGA fuel rods (Rod 10170 and Rod 10172) (30 wt.% U and <20% 235U) were selected for characterization. These came from a batch of fuel rods that were shipped to the Idaho National Laboratory (INL) from General Atomics in San Diego, California. The fuel rods were recovered from their storage location at the Irradiated Spent Fuel Storage facility and transported to the Hot Fuels Examination Facility (HFEF). Non-destructive visual examinations performed on both fuel rods did not indicate any evidence of any defects in the cladding.
For NR, a collimated neutron beam from a TRIGA reactor housed in HFEF, was employed to penetrate the fuel (McClellan et al., 1983; Craft et al., 2015). The beam was attenuated by the uranium-zirconium hydride fuel in the rods. Attenuation is dependent on uranium density, thickness, and local neutron cross section; the remaining beam passed onto a foil made of a high-neutron cross-section material, which became activated. The activated foil was placed on industrial x-ray radiography film in a vacuum cassette and allowed to decay for a minimum of five half-lives. The activated foil subsequently decayed by beta emission, and the beta particles exposed the radiography film, thus transferring a latent image of the fuel rod from the foil to the film. The film was developed using an automatic film processor to obtain a finished neutron-radiography image.
PGS was performed to verify the burnup profile and relative burnup using the 137Cs spectra throughout the selected TRIGA rods prior to sectioning into specimens. PGS is a non-destructive examination method that records the gamma spectra emitted by irradiated items and is commonly used in post-irradiation characterization examinations (Barnes et al., 1979; Harp et al., 2014). Typical application of PGS involves recording a gamma spectrum to determine relative axial and radial fuel-burnup profiles, identifying radionuclide location, and generating other data to aid in evaluating the performance of irradiated fuels. In conducting a PGS assay on the TRIGA fuel rods, gamma rays from the irradiated fuel rod were passed through a narrow variable slit and collimator so that photons from only a small and identifiable part of the rod were counted over a particular time interval. The gamma rays struck the high-purity germanium detector, which emitted a pulse of electric charge proportional to the energy of each individual event. The pulses, after shaping and amplification, were counted. The collected data were analyzed to provide information about the isotopic composition of the area analyzed.
Additionally, a source scan of known isotopes spanning the energy range of the isotopes of interest was performed prior to each PGS measurement campaign on each TRIGA rod. To reduce uncertainty while performing assays with the smallest step size, the fuel rod was oriented such that it was centered as closely as possible in front of the collimator. This was accomplished by incrementally moving the fuel rod horizontally across the slit of the collimator, thereby determining the relative edge locations (right and left) of the sample by observing the count rate and spectra collected; by this method, the center-line coordinate of the fuel rod was determined.
Gamma scanning tomography (Parker and Joyce, 2015; Steven Hansen) was performed on cross sections taken from a fuel pellet. The scans were centered over the centerline of a cross section and were taken in 0.2 mm steps at nine different angles. Since decay counts were not high due to the long decay period of the fuel rod, improvement of the resolution of the plots and statistical noise for 137Cs and 60Co were reduced, by summing data from two step locations. Even lower counts for 154Eu necessitated summing data from five step locations.
For destructive examinations, samples were cut from an irradiated fuel rod and used for analytical chemistry in order to benchmark the PGS data by establishing the local fission-product inventories for selected test specimens. The fission-product inventory was coupled with the PGS data to determine the fission density, burnup, and fission-product inventories at specific locstions of the fuel meats. Other samples from the highest burnup region of the highest burnup fuel rod were used for OM and SEM/EDS/WDS analysis. In the SEM, both backscattered electron (BSE) and secondary electron (SE) images were collected, and EDS and WDS were employed for poin-to-point and linescan analyses, and x-ray maps were also generated.
3 Results
3.1 Neutron radiography
NR is a non-destructive characterization method used to evaluate mechanical integrity and geometric stability prior to performing destructive examinations. A loss of integrity or geometric stability would be indicated by evidence of fuel cracking, fuel relocation, or significant fuel density variations throughout the element and rod. NR images showed areas in the fuel meats that may have dehydrided or cracked.
The NR imaging of TRIGA Rods 10170 and 10172 was successful in providing data with which to assess the general condition of the fuel region of both rods. Thermal neutron and epithermal radiographs were generated, and the thermal neutron radiographs are shown in Figure 1.
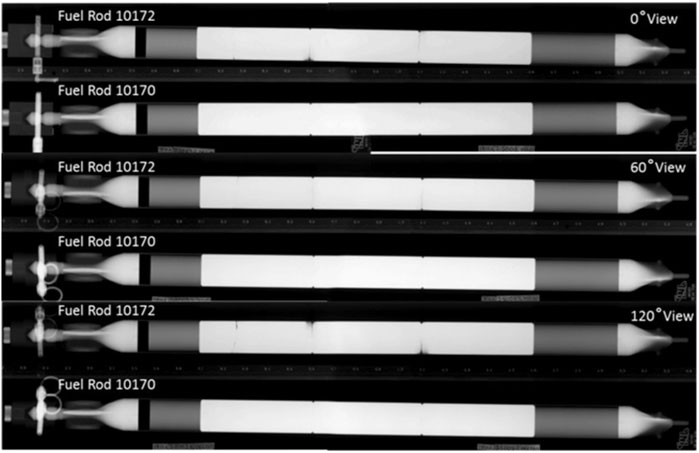
FIGURE 1. Thermal neutron radiographs for Fuel Rods 10172 and 10172 for the 0, 60- and 120-degree rotations.
Regions of possible dehydriding (or hydrogen depleted regions due to hydrogen transport) are observed in both rods (most pronounced in the 120-degree view) and are primarily located in the regions between the fuel meats. These areas were characterized by the circled darker regions on the fuel meats in the radiographs shown in Figure 2 for Fuel Rod 10170 and 10172. It is hypothesized that these were areas of higher temperatures during the operation of the reactor and the hydrogen diffused from these areas to cooler areas. The Zr rod at the center of the fuel pellets can also be seen in Figure 2A.
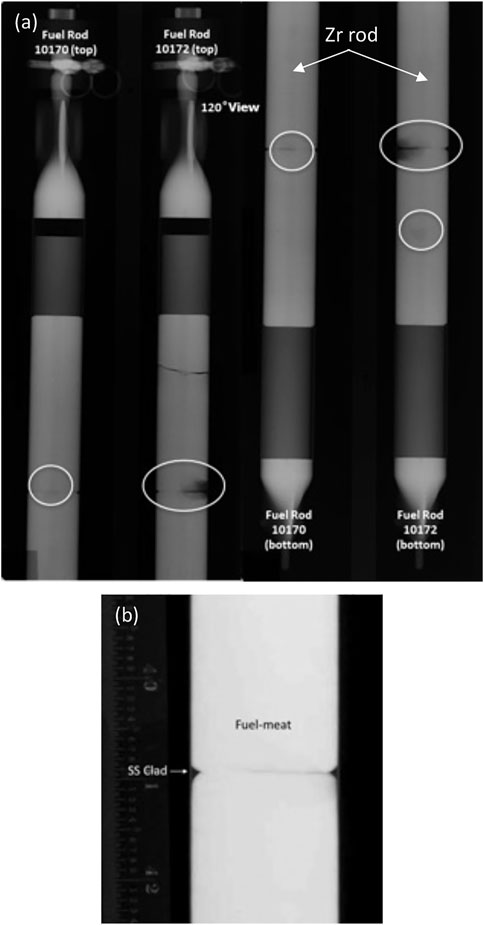
FIGURE 2. Fuel Rods 10170 and 10172 shown for the 120-degree view (A). The circled regions are possible dehydride locations in the fuel meat. In (B) is shown the fuel meat to cladding interface for a local region of fuel rod 10172.
Due to irradiation-induced fuel swelling (with some possible contribution of thermal expansion), the fuel meat expanded. Of interest was if this resulted in good contact between the fuel and the cladding such that chemical interaction transpired between the fuel and cladding during irradiation. Fuel cladding mechanical interaction is also of interest. Figure 2B shows that there may be good fuel pellet contact with the cladding for the higher burnup rod, Fuel Rod 10172, excluding the regions between the fuel pellets where the fuel pellet ends are chamfered and do not contact the cladding. Fuel Rod 10172 was selected for destructive examination because it potentially had good fuel and cladding contact, was the highest-burnup rod, and contained the highest inventory of lanthanide fission products.
All views shown in Figure 3 for Fuel Rod 10172 (higher burnup than Fuel Rod 10170) show a crack (labelled) in the top fuel meat with some potentially dehydrided regions also visible. There was no indication in the gamma-scan data or during the visual inspection of the exterior of the rods that would have indicated damage to the fuel in this region. An explanation for the crack in the fuel is not currently available. Subsequent sectioning of Fuel Rod 10172 revealed radial cracking in most regions of the fuel pellet that were not resolvable in radiography. It is conceivable that cracking could have occurred during specimen sectioning. Sectioning is performed using a slow-speed saw with water cooling. A slightly smudged region just off-center in the middle fuel meat of Fuel Rod 10172 also indicates a dehydriding location. Based on radiography results, the cracked fuel and possibly dehydrided regions of the fuel were avoided during sectioning of samples for destructive analysis.

FIGURE 3. Fuel Rod 10172 showing crack in top fuel meat.
3.2 Precision gamma scanning
3.2.1 Axial gamma scanning
Gamma-scanning results are shown in Figure 4, and 137Cs, which is a longer-lived fission product (half-life of 30.07 years), was selected to indicate burnup levels for the rods relative to each other. Spectral profiles of 137Cs for both rods indicate the peak burnup location within each rod to be in the middle (center fuel meat) region of the rods. Also indicated in the 137Cs spectra is a dip between each of the fuel meats (see Figure 4). While both Fuel Rods 10170 and 10172 have a slight dip in the 137Cs spectra located in the center fuel-meat region, neutron radiography of the fuel rods indicates that the fuel is intact. Also, the uncertainty in the data indicates that the dips were not statistically significant relative to other data points in this region. 60Co (half-life 5.27 years) is an activation product from the SS cladding of the fuel rod and end fittings. 154Eu (half-life 8.59 years) is another gamma-emitting fission product by which burnup can be benchmarked.
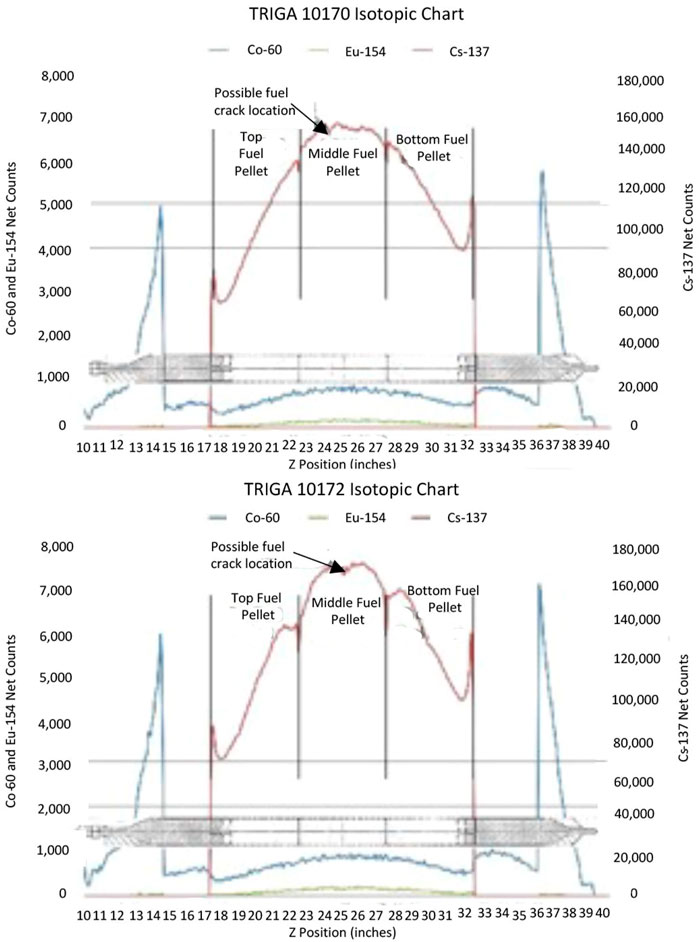
FIGURE 4. Isotopic gamma-scan profile for TRIGA fuel rods 10170 (top) and 10172 (bottom). To the right of each profile, the Y-axis is in 137Cs counts, and the red profile is for 137Cs. To the left, the Y-axis is in 60Co and 154Eu counts, and the blue and yellow profiles are for 60Co and 154Eu, respectively.
The top of the rods in the overlay on the plots are oriented toward the left side (10,0) of the x and y-axes. While absolute position on the plots is arbitrary, the relative position from point to point is absolute. As shown in Figure 4, Fuel Rod 10170 has a relatively flat profile in the center region as compared to the areas to the left and the right of the middle fuel pellet. The peak net count for Fuel Rod 10170 is 152,602, based on a 240-s count time for each 0.254 cm step down the length of the rod. The center fuel-pellet region for Fuel Rod 10172, shown in Figure 4, has a less flat profile as compared to Fuel Rod 10170s profile in this location. The peak net count for Fuel Rod 10172 is 166,745 for the same count parameters. Therefore, Fuel Rod 10172 was selected for sectioning due to its higher relative burnup, as indicated by the higher gamma activity level for 137Cs. These data also confirm the calculated physics estimates for which of the two rods had a higher burnup. Additionally, because of its higher burnup, the middle fuel-pellet region for fuel rod 10172 offers the highest fission-product inventories. Figure 5 shows the spectral profile of 137Cs for the 10,172 fuel pellets in more detail, along with a schematic cutting diagram for the middle fuel-pellet.
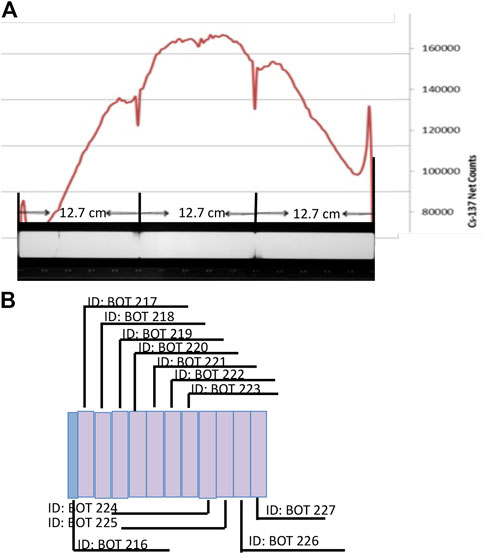
FIGURE 5. Neutron radiography image (A) showing fuel pellets in fuel rod 10172 and a gamma scanning profile for 137Cs along the length of the fuel rod, which shows how the middle fuel pellet received the highest burnup during irradiation. The schematic diagram in (B) shows how the middle fuel pellet was sectioned to produce samples for analytical chemistry, gamma scanning tomography, and microstructural characterization.
3.2.2 Gamma scanning tomography
Gamma scanning tomography was performed on three cross sections that were adjacent to the chemistry sample taken from the middle fuel pellet. The tomographic images of 137Cs, 60Co, and 154Eu from these data are shown in Figure 6 for the BOT217 specimen. Results from the tomographic reconstruction of the circumferential count locations indicate a radial gradient in the burnup in the fuel meat. The higher 137Cs count data at the perimeter indicate greater burnup relative to the center of the fuel pellet. Data for 60Co are where they would be expected, at the fuel-perimeter and cladding region. The shape of the cobalt data is an artifact of the scanning method.
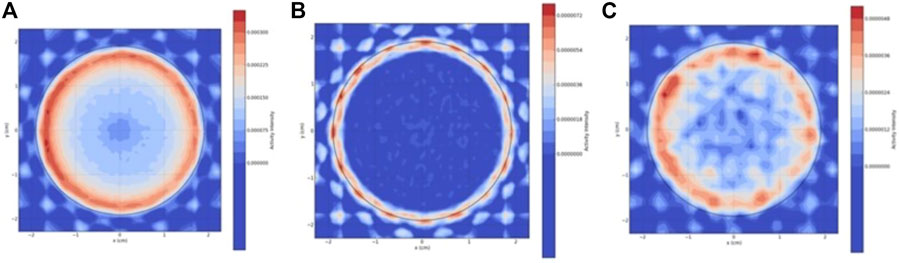
FIGURE 6. For sample BOT217, 137Cs (A), 60Co (B), and 154Eu (C) tomographic maps. The black circle is the circumference of the sample. The y-axis to the right is in counts, where the highest counts are in red.
3.2.3 Gamma spectroscopy
Cross-sections were taken from the left fuel pellet (see Figure 7), and then smaller samples were produced from these cross-sections to confirm the radial burnup profile of the tomographic data compiled from the PGS both chemically and using gamma spectroscopy. Sample IDs are ordered left to right relative to the outside edge of the cross section, moving into the center of the cross section (see Figure 7). Results from gamma spectroscopy are shown in Figure 8 for 137Cs (a) and 154Eu (b), measured in solid form and as measured in solution for Cs and Eu (c and d, respectively). Qualitatively, the four plots illustrate a radial burnup gradient and are consistent with the PGS tomographic scan data.
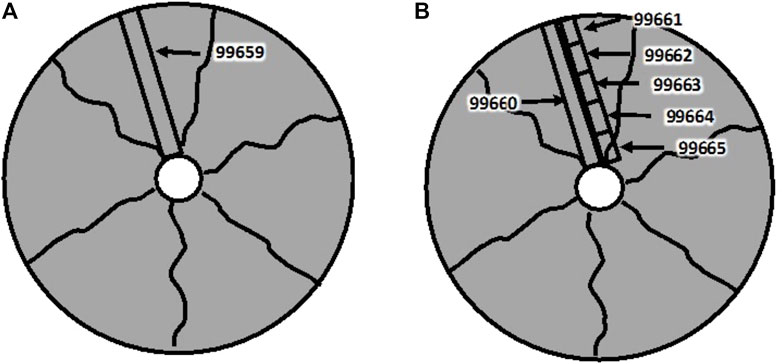
FIGURE 7. Chemistry sample-sectioning diagrams from cross-sections taken from Fuel Rod 10,172, fuel cross sections −1 (A) and −2 (B).
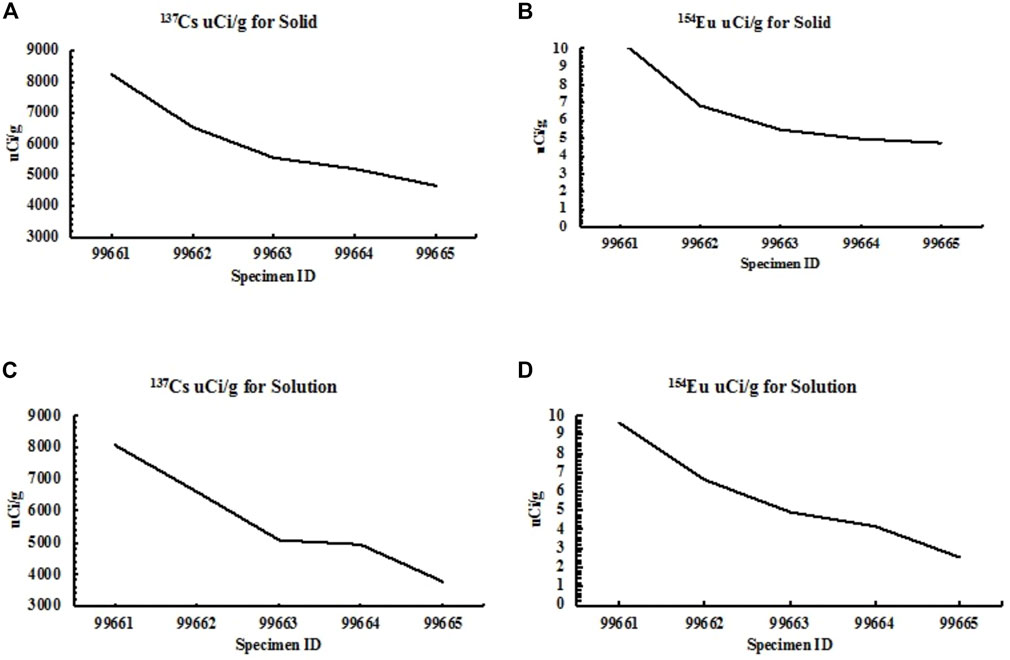
FIGURE 8. Results for 134Cs (A) and 154Eu (B) gamma spectroscopy as measured as a solid, and 134Cs (C) and 154Eu (D) as measured in solution.
3.3 Chemical analysis
Chemical analysis was performed to establish the burnup level and fission-product inventories for the different specimens. These data were coupled with the gamma-scan data to determine the fission-product density, burnup, and fission-product inventories for each specimen. Specimens were cut from each of the fuel-pellet sections to determine the fuel-rod axial burnup levels relative to gamma-scan data. Specimens had the SS cladding removed prior to chemical analysis.
The burnup results are found in Table 1 for the radial specimens that received chemical analysis. The specimen-sectioning diagram (see Figure 7) shows where a cross-section was taken from the left fuel pellet, specimen ID 99659 (a) and the specimens taken frrom a cross-section from the middle fuel pellet, specimen IDs 99660–99665 (b). Data obtained from chemical analysis and inductively coupled mass spectrometry (ICP-MS) are plotted in Figure 9 for the radial mini-sections. These results indicate a radial gradient burnup profile in the 235U, which is consistent with the tomographic gamma-scan data. The burnup value for specimen 99659 of 18% is in reasonable agreement with the results for a physics burnup calculation of 20%.
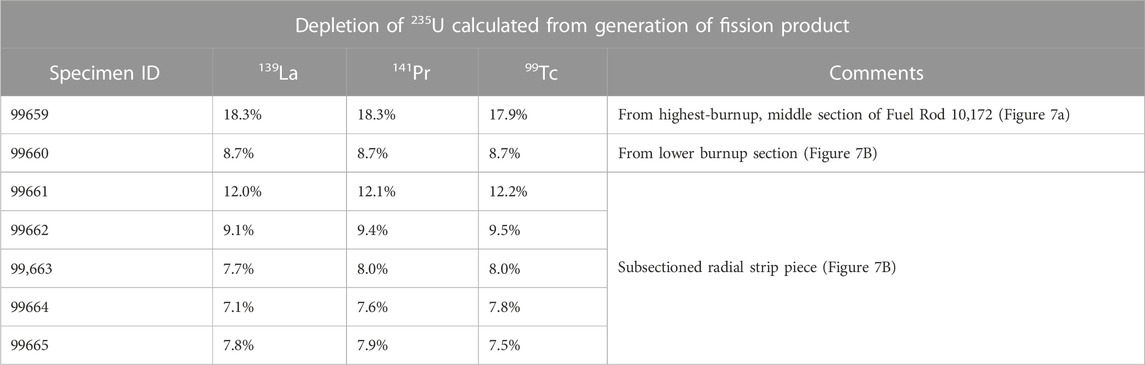
TABLE 1. Burnup percent determined from select fission-product inventories.
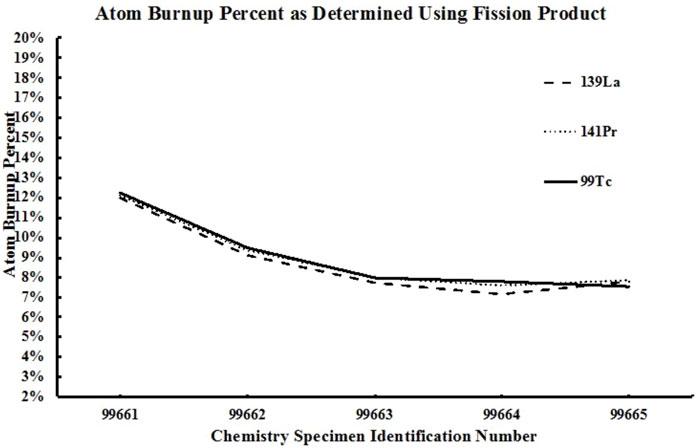
FIGURE 9. Plotted burnup values calculated via fission product measured using chemistry and ICP-MS.
3.4 Optical metallography
NR (see Figure 5A) showed that the middle and right fuel pellets did not have obvious cracks, and the gamma scanning profile for 137Cs showed the middle fuel pellet had received the highest burnup, but the left-side of the right fuel pellet also had received significant burnup. A cross-section from the left-side of the right fuel pellet was selected for microstructural characterization, and this sample was labeled as BOT229.
A montage of ×31.5 magnification optical images of the as-irradiated TRIGA fuel in this sample is shown in Figure 10A and a ×200 magnification image of the fuel and cladding interface in the specimen is presented in Figure 10B. It is not obvious from the image in Figure 10B whether the fuel pellet in this region had locations where the fuel and cladding were in contact with each other, but the gap between the fuel and cladding in this region was relatively small.
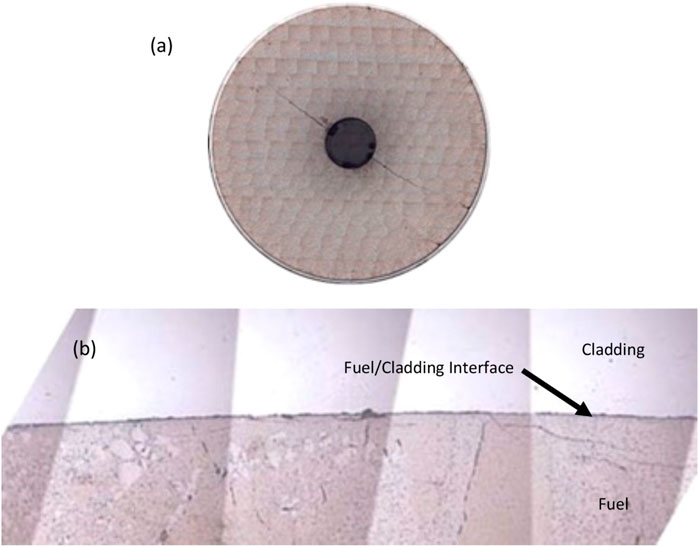
FIGURE 10. OM image montage (A) at ×31.5 magnification of the as-irradiated TRIGA fuel microstructure, and OM image (B) at ×200 magnification, showing a fuel to cladding region with the best signs of potential fuel and cladding contact.
3.5 Scanning electron microscopy
For SEM analysis, samples were produced from a cross-section taken from the left-side of the right fuel pellet in Figure 5A. This cross-section looked like the one shown in Figure 10A. Sample reduction was necessary to keep radiation levels low so that the samples could be handled in the available SEM. The samples contained the cladding, fuel/cladding interface and fuel. BSE images of the as-irradiated fuel, cladding, and fuel/cladding interface microstructures are presented in Figure 11. As depicted in Figure 11A, the as-irradiated TRIGA fuel specimen is a multiphase material that is comprised of a U-rich precipitate phase and a Zr-H matrix phase as the major phases. Figure 11B and Figure 11C show that the specimen exhibited a gap at the fuel and cladding interface, and after careful inspection of the inner surface of the cladding and fuel meat using images and compositional linescans, no evidence of any FCCI zones could be observed that may have suggested there was fuel and cladding contact at some time during irradiation so that interaction between the fuel and cladding could have transpired. This type of information is important because U-ZrH fuel has a thermal expansion coefficient that is larger than that of the Type 304SS cladding (Kim, 1975; Olander et al., 2009), making fuel-cladding contact possible during irradiation even though they are not in contact at room temperature. WDS x-ray maps were produced (see Figure 12) to confirm the partitioning behavior for the U and Zr in the TRIGA fuel. Hydrogen cannot be detected using WDS and so is not shown.
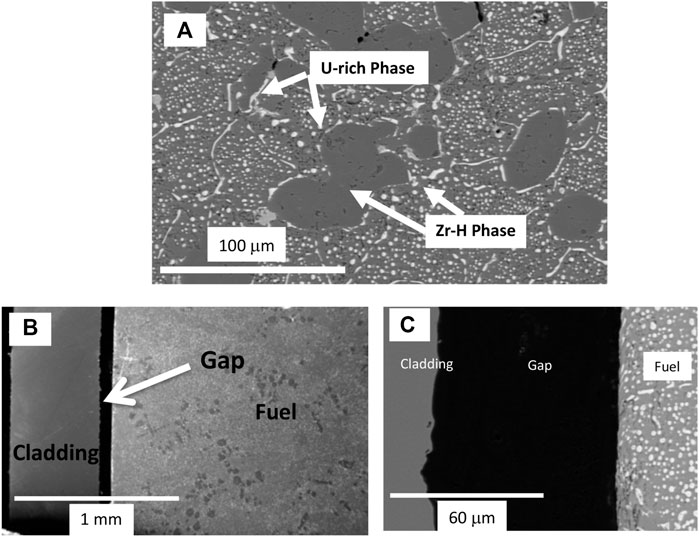
FIGURE 11. Backscattered electron images (A–C) showing the as-irradiated TRIGA fuel microstructure (A) and a gap (B,C) that was observed at the fuel and cladding interface.
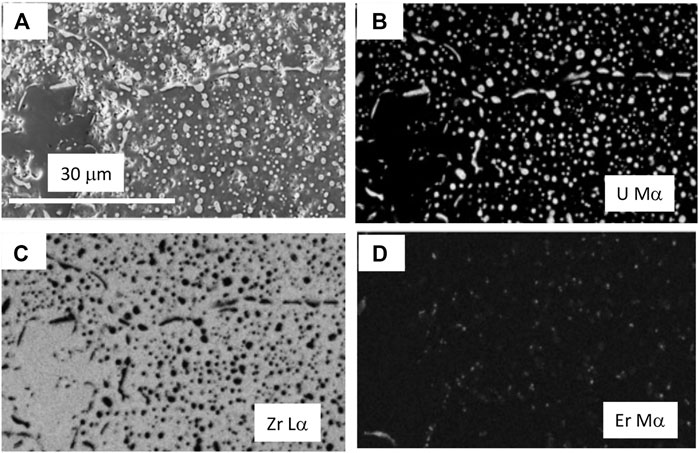
FIGURE 12. A BSE image (A) of the irradiated fuel specimen microstructure and WDS x-ray maps for (B) U, (C) Zr, and (D) Er. Hydrogen cannot be detected using WDS. Xe and Cs WDS x-ray maps did not show any enriched phases.
Point-to-point and linescan analysis were performed on the sample, but no fission-product enriched phases could be found. Fission products present in the material appeared to be in concentrations below the resolution of the EDS detector that was employed. As shown in Figure 12D, Er-enriched phases could be resolved in the fuel meat. Figure 13 shows BSE images of different locations where such phases were present in the fuel meat.
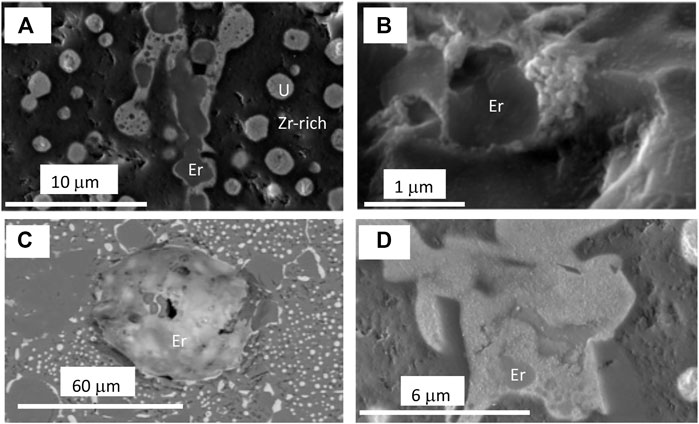
FIGURE 13. BSE images (A–D) showing examples of fuel meat phases that contain Er. The image in (B) is from a location where a fracture surface was found in the sample.
The U-rich phase appeared mostly featureless on the as-polished surface of the fuel meat sample. Fission gas porosity could not be readily observed. However, when looking at different locations that had fracture surfaces (see Figures 14A, B) the U-rich phase appeared to be fine-grained and to contain porosity. Porosity could also be found in the Zr-H matrix of the fuel pellet (see Figures 14C, D). The nature of these pores can impact the mechanical propeties, thermal conductivity and fission gas retention in the fuel pellet. Overall, the submicron pores seemed well distributed and did not appear to coalesce into large voids during irradiation.
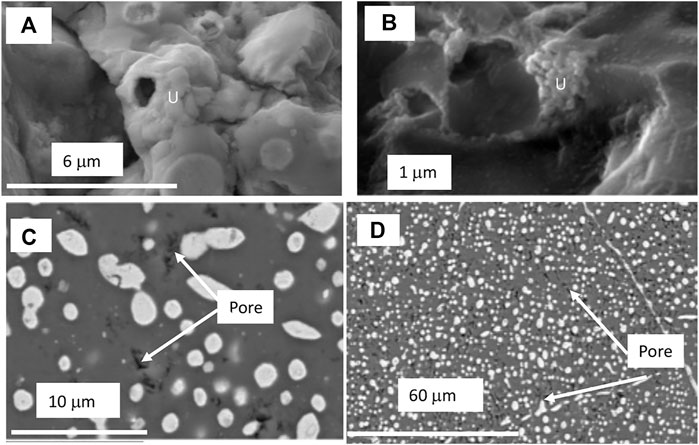
FIGURE 14. BSE images (A,B) showing fracture surfaces in the fuel pellet that expose the U-rich fuel phase that appears to be fine-grained with evidence of porosity. Porosity in the ZrH matrix can be seen in the images presented in (C) and (D).
4 Discussion
Based on the results of non-destructive characterization of irradiated U-ZrH fuel for two as-irradiated TRIGA fuel elements (up to around 20% 235U depletion) using NR, only limited cracking and dehydriding of the fuel pellet was observed. The dehydriding occurred in very localized regions of the fuel, where hydrogen may have migrated from these regions to lower temperature regions. The results of gamma scanning tomography and chemical analysis showed that the irradiated TRIGA fuel had a radial burnup gradient. The results of precision gamma scanning (PGS) showed that there was a burnup gradient along the length of the fuel rods, and the center fuel meat achieved the highest burnup. The effect of any diffusion of the measured constituents along any temperature gradients in the fuel must also be considered when interpreting these results and will need some investigation.
The results of OM and SEM analysis showed that a gas gap was present in the irradiated TRIGA fuel at room temperature. A gap was also observed for a sample from an as-fabricated TRIGA fuel element (Keiser et al.). As discussed in (Simand et al., 1976), there are three swelling mechanisms that could have contributed to gap closure during the irradiation of U-ZrH fuel: the accommodation of solid fission products, the agglomeration of fission gases, and a saturable cavity nucleation phenomenon due to the nucleation and growth of irradiation-formed vacancies into voids. Thermal expansion differences between the fuel and the cladding could have also contributed. As-fabricated TRIGA fuel reportedly has a cold gap of around 25 or 50 microns between the fuel and cladding, after slip fitting the fuel into the cladding tube (Simand et al., 1976), and based on the characterization results reported in this paper, this gap did not close completely during irradiation. With respect to the ZrH matrix, the current analysis showed that very small pores/voids were present, and they did not appear to agglomerate to form large voids. This porosity could be as-fabricated porosity and/or pores that developed during irradiation. Similar porosity has been observed in as-fabricated fuel (Keiser et al.). For the Er-containing phases observed in the as-irradiated fuel, they are very similar to what has been observed in as-fabricated fuel, where it was observed that Er2O3 was present (Keiser et al.). Overall, the microstructure of the irradiated U-ZrH fuel was very similar to that of the original as-fabricated fuel (Keiser et al.). This agrees with what has been reported by Simnad (Simnad, 1981).
The presence of fission product-rich phases was not found in this fuel using SEM/EDS/WDS. However, gamma scanning and chemical analysis did confirm some of the fission products that were present in the fuel. Based on the SEM analysis, the concentration of the various constituents appeared to be low and homogeneously distributed in the fuel. Based on calculations using the Thermo-Calc computer code, yttrium, alkaline earth metals, and most lanthanides prefer to form binary hydrides. Oxide phases that can form include Y2O3, Pr2O3, Sm2O3, and Ce2O3. Uranium and noble metals prefer to remain in their elemental state, except for the formation of URu3, URh3, and UPd3. CsI and SmTe can also form. Gaseous phases include H2, Cs, Rb, CsRb and CsI. There is little consumption of hydrogen by fission products. Solid fission products form as a function of burnup, where for 45 wt.% U fuel with ZrH1.6 matrix, it is estimated that the formation of solid fission product phases will be about 0.45% at 10,000 Mega-Watt-days-per-ton U (Huang et al., 2001).
5 Conclusion
Based on the non-destructive examination of two irradiated TRIGA fuel elements, using NR and PGS, and the destructive examination of one irradiated TRIGA fuel element, using OM and SEM, combined with EDS and WDS, the following conclusions can be drawn.
1. Some cracking and dehydriding of U-ZrH fuel was observed for a fuel rod irradiated in a TRIGA reactor where a burnup up to 20% 235U depletion was calculated, with limited closure of the original gap between the fuel and the cladding due to fuel swelling.
2. The axial and radial burnup gradient present in a TRIGA fuel element can be identified using gamma scanning and chemical analysis.
3. Negligible microstructural changes can be identified in an irradiated U-ZrH fuel when comparisons are made with as-fabricated fuel.
4. Isolated fission product-rich phases are not prevalent in the microstructure of an irradiated U-ZrH fuel, where a maximum of 20% depletion of 235U was calculated.
6 U.S. department of energy disclaimer
This information was prepared as an account of work sponsored by an agency of the U.S. Government. Neither the U.S. Government nor any agency thereof, nor any of their employees, makes any warranty, express or implied, or assumes any legal liability or responsibility for the accuracy, completeness, or usefulness of any information, apparatus, product, or process disclosed, or represents that its use would not infringe privately owned rights. References herein to any specific commercial product, process, or service by trade name, trademark, manufacturer, or otherwise, does not necessarily constitute or imply its endorsement, recommendation, or favoring by the U.S. Government or any agency thereof. The views and opinions of authors expressed herein do not necessarily state or reflect those of the U.S. Government or any agency thereof.
Data availability statement
The original contributions presented in the study are included in the article/supplementary material, further inquiries can be directed to the corresponding author.
Author contributions
DK: drafting of paper, data analysis, and work direction. FR: Paper drafting, conducted work, and data analysis. J-FJ: conducted work and data analysis. EW: Work direction, oversaw funding, and interacted with project sponsor.
Funding
This work is supported by the U.S. Department of Energy, under DOE Idaho Operations Office Contract DE-AC07-05ID14517.
Acknowledgments
This manuscript was authored by Battelle Energy Alliance, LLC, under Contract No. DE-AC07-05ID14517 with the U.S. Department of Energy. The U.S. Government retains and the publisher, by accepting the article for publication, acknowledges that the U.S. Government retains a non-exclusive, paid-up, irrevocable, worldwide license to publish or reproduce the published form of this manuscript, or allow others to do so, for U.S. Government purposes. Personnel at HFEF are recognized for completion of the neutron radiography and precision gamma scanning. Personnel at the Analytical Laboratory are recognized for completion of chemical analysis on provided samples.
Conflict of interest
The authors declare that the research was conducted in the absence of any commercial or financial relationships that could be construed as a potential conflict of interest.
Publisher’s note
All claims expressed in this article are solely those of the authors and do not necessarily represent those of their affiliated organizations, or those of the publisher, the editors and the reviewers. Any product that may be evaluated in this article, or claim that may be made by its manufacturer, is not guaranteed or endorsed by the publisher.
References
American Nuclear Society (2021). DOE touts a MARVEL of a micro-reactor project. Nucl. News. April 15, 2021. Available at: https://www.ans.org/news/article-2809/doe-touts-a-marvel-of-a-microreactor-project/.
Barnes, B. K., Phillips, J. R., Waterbury, G. R., Quintana, J. N., Netuschil, J. R., and Murray, A. S. (1979). Characterization of irradiated nuclear fuels by precision gamma scanning. J. Nucl. Mater. 81, 177–184. doi:10.1016/0022-3115(79)90076-x
Craft, A. E., Wachs, D. M., Okuniewski, M. A., Chichester, D. L., Williams, W. J., Papaioannou, G. C., et al. (2015). Neutron radiography of irradiated nuclear fuel at Idaho national laboratory. Phys. Procedia. 69, 483–490. doi:10.1016/J.PHPRO.2015.07.068
Fouquet, D. M., Razvi, J., and Whittemore, W. L. (2003). TRIGA research reactors: A pathway to the peaceful applications of nuclear energy. Nucl. News 46 (12), 46–56.
GA Technologies (1992). “Uranium-zirconium hydride TRIGA-LEU fuel,” in Research reactor core conversion guidebook, international atomic energy agency report IAEA-TECDOC-643, 161–185.
Harp, J. M., Demkowicz, P. A., Winston, P. L., and Sterbentz, J. W. (2014). An analysis of nuclear fuel burnup in the AGR-1 TRISO fuel experiment using gamma spectrometry, mass spectrometry, and computational simulation techniques. Nucl. Eng. Des. 278, 395–405. doi:10.1016/J.NUCENGDES.2014.07.041
Huang, J., Tsuchiya, B., Konashi, K., and Yamawaki, M. (2001). Thermodynamic analysis of chemical states of fission products in uranium-zirconium hydride fuel. J. Nucl. Mater. 294, 154–159. doi:10.1016/s0022-3115(01)00446-9
Keiser, D., Perez, E., Jue, J. F., Rice, F., and Woolstenhule, E. Microstructural characterization of uranium-zirconium hydride fuel in an as-fabricated TRIGA fuel element. J. Nucl. Mater. Energy. submitted for publication.
Kim, C. S. (1975). Thermophysical properties of stainless steel. Argonne National Laboratory Report. ANL-75-55 (September 1975).
McClellan, G. C., and Richards, W. J. (1983). “Neutron radiography applications and techniques at the Hot fuel examination facility,” in Neutron radiography. Editors J. P. Barton, and P. von der Hardt (Dordrecht: Springer). doi:10.1007/978-94-009-7043-4_54
Meyer, M. K., Keiser, D. D., Jue, J.-F., and Shaber, E. (2020). “Research reactor fuels,” in Advances in nuclear fuel chemistry. Editor M. H. A. Piro (Edinburgh, United Kingdom: Elsevier), 273–312.
Olander, D., Greenspan, E., Garkisch, H. D., and Petrovic, B. (2009). Uranium–zirconium hydride fuel properties. Nucl. Engr. Des. 239, 1406–1424. doi:10.1016/j.nucengdes.2009.04.001
Olander, D., Konashi, K., and Yamawaki, M. (2012). “Uranium-zirconium hydride fuel,” in Comprehensive nuclear materials. Editor R. J. M. Konings (Amsterdam, Netherlands: Elsevier), 3, 314–345.
Olander, D. (2009). Nuclear fuels: Present and future. J. Nucl. Mater. 389, 1–22. doi:10.1016/j.jnucmat.2009.01.297
Olander, D. R., and Ng, M. (2005). Hydride fuel behavior in LWRs. J. Nucl. Mater. 346, 98–108. doi:10.1016/j.jnucmat.2005.05.017
Parker, H. M. O’D., and Joyce, M. J. (2015). The use of ionising radiation to image nuclear fuel: A review. Prog. Nucl. Energy 85, 297–318. doi:10.1016/j.pnucene.2015.06.006
Simand, M. T., Foushee, F. C., and West, G. B. (1976). Fuel elements for pulsed TRIGA research reactors. Nucl. Tech. 28 (1), 31–56. doi:10.13182/NT76-A31537
Simnad, M. T. (1981). The U-ZrHx alloy: Its properties and use in TRIGA fuel. Nucl. Eng. Des. 64, 403–422. doi:10.1016/0029-5493(81)90135-7
Steven Hansen, J. Application guide to tomographic gamma scanning. Los Alamos National Laboratory Report. LA-UR-04-7014.
Terrani, K., Balooch, M., Carpenter, D., Kohse, G., Keiser, D., Meyer, M., et al. (2017). Irradiation effects on thermal properties of LWR hydride fuel. J. Nucl. Mater. 486, 381–390. doi:10.1016/j.jnucmat.2017.01.030
Zinkle, S. J., Ott, L. J., Ingersoll, D. T., Ellis, R. J., and Grossbeck, M. L. (2002) “Overview of materials technologies for space nuclear power and propulsion,” in Space technology and applications international forum--STAIF 2002. Editor M. S. El-Genk, 608, 1063–1073. 3–6 February 2002, Albuquerque, NM, USA. (Melville, NY, USA: American Institute of Physics).
Keywords: TRIGA reactor, U-ZrH, micro-reactors, characterization, post irradiation examination
Citation: Keiser D Jr., Jue J-F, Rice F and Woolstenhulme E (2023) Post irradiation examination of a uranium-zirconium hydride TRIGA fuel element. Front. Energy Res. 11:1106601. doi: 10.3389/fenrg.2023.1106601
Received: 23 November 2022; Accepted: 09 March 2023;
Published: 17 March 2023.
Edited by:
Germina Ilas, Oak Ridge National Laboratory (DOE), United StatesReviewed by:
Pavel Tsvetkov, Texas A&M University, United StatesJason Harp, Oak Ridge National Laboratory (DOE), United States
Copyright © 2023 Keiser, Jue, Rice and Woolstenhulme. This is an open-access article distributed under the terms of the Creative Commons Attribution License (CC BY). The use, distribution or reproduction in other forums is permitted, provided the original author(s) and the copyright owner(s) are credited and that the original publication in this journal is cited, in accordance with accepted academic practice. No use, distribution or reproduction is permitted which does not comply with these terms.
*Correspondence: Dennis Keiser Jr., ZGVubmlzLmtlaXNlckBpbmwuZ292