 Tianzi Shi
 Jingke She
 Pingfan Li1
95% of researchers rate our articles as excellent or good
Learn more about the work of our research integrity team to safeguard the quality of each article we publish.
Find out more
ORIGINAL RESEARCH article
Front. Energy Res. , 10 February 2023
Sec. Nuclear Energy
Volume 11 - 2023 | https://doi.org/10.3389/fenrg.2023.1099326
This article is part of the Research Topic Dynamics and Control for Nuclear Energy View all 8 articles
A deep learning-based multi-node framework is constructed in this work to provide a data-driven platform that provides predictions for the operation condition of the primary heat transfer (PHT) loop in nuclear power plants (NPPs). Several deep learning models that have been verified and demonstrated in previous researches, such as Long-Short Term Memory (LSTM), Convolutional Neural Network (CNN), and zigmoid-based LSTM (zLSTM), are applied to modeling critical system parameters at three important nodes in the PHT loop. The feature extraction and process memory are enhanced via the collaborative work of CNN and LSTM. zLSTM, on the other hand, is successfully utilized to strengthen the long-term memory, especially for predictions of a node with multivariate inputs such as the steam generator. The node prediction results are also adopted for a polynomial fitting that generates an additional input to the next node, allowing each node to select a more accurate input. According to the verification experiments based on Loss of Coolant Accident (LOCA), the Mean Squared Error (MSE) result (1.29 × 10⁻³) and the Mean Absolute Error (MAE) result (1.37 × 10⁻²) of 0.7 cm2 LOCA case demonstrate the functionality and accuracy of the proposed framework. It is found that the fitting error (MSE) in the outlet node at 0.7 cm2 case is 38.5% lower than the prediction, showing the advantage of applying both deep learning and fitting methods. The best performance, in term of MSE, is obtained at SG node in the 0.7 cm2 case, where its processing error (0.001285) is 93.2% lower than that of the baseline models. Both the validation and verification experiments successfully proved the feasibility and advantages of the proposed framework, which offers an alternative option for the operation analysis of PHT performance.
To ensure the safety and reliability of the nuclear power plants (NPPs), it is of importance for the operation condition diagnosis and prediction to be not only accurate but also efficient. However, traditional modeling methods are harder to conduct in such scenario when facing complex physical processes, non-linear parameters, and multiple operation nodes. A data-driven methodology which can bypass such hurdles has been eagerly expected. The development of artificial intelligence (AI) has made deep learning an effective method for simulation and analysis of operation data, which have attracted increasing attention from the nuclear industry over the past decades. The AI applications in nuclear safety has been widely investigated and deployed, leading to a research tide on how to improve the operational efficiency and safety of nuclear power through deep learning methods.
There have been many methods in current fault diagnosis research area, such as pattern recognition, expert systems, knowledge bases, etc., Pattern recognition has a high detection rate in identifying specific fault conditions in rolling bearings (Miao, 2022). The construction of power knowledge graphs works well in power fault analysis and retrieval recommendations (Liang et al., 2022). Within the nuclear power sector, fault diagnosis methods are also being explored, optimized, and improved for enhanced operation condition analysis.
The traditional measures of analyzing the operation condition are normally based on system modeling. It obtains a mathematical model through the physical logic to describe the operation of the monitored system (Min et al., 2019; Hu et al., 2021). An anisotropic creep model was proposed by Kim et al. (2021) to analyze the expansion and explosion processes in NPP accidents based on both the transient heat transfer and the fuel rod characteristics. Yang et al. (2019) used RELAP5/MOD3.3 code to predict the Loss of Coolant Accident (LOCA) during the Main Steam Loop Break (MSLB) on a third-generation reactor with passive safety features. The monitoring and analysis system in Daya Bay Nuclear Power Plant presented a quantitative analysis model of the secondary loop thermal system using the theory of equivalent enthalpy drop theory and cyclic functional method (Zhao et al., 2011). The mentioned simulation methods are obtained through system modeling, which faces the challenges of complex physical processes, multiple interacting devices, and non-linear variation of system parameters.
In contrast, data-driven methods can be more convenient and efficient for operation condition prediction. It simply collects input and output information from the sensors without involving the specific system details. The most studied data-driven methods include Support Vector Machines (SVM), Principal Component Analysis (PCA), and K-Nearest Neighbor (KNN) (Ayodeji et al., 2018; Meng et al., 2020). For example, Wang et al. (2021) combined SVM, PCA and clustering algorithm to predict sensor failures in NPPs. Yu et al. (2020) proposed two improvements to PCA: one is a modified algorithm to improve PCA reconstruction accuracy; another is a PCA monitoring model for detecting multi-sensor faults.
In recent years, deep learning methods, as part of the data-driven approaches, have become popular in the operation condition diagnosis and prediction. It is considered to be one of the latest advances in artificial neural networks (ANNs). Zhao et al. (2021) focused on the state of the art of data-driven approaches to prognostics and health management (PHM) in NPPs with a purpose of assessing the opportunities and challenges currently faced. Deep learning methods include Recurrent Neural Network (RNN), Convolutional Neural Network (CNN) and Long-Short Term Memory (LSTM), etc., (Chen and Jahanshahi, 2017; Ling et al., 2020). There have been enormous successful deep learning applications in nuclear safety field. For example (Moshkbar-Bakhshayesh and Ghofrani, 2013), used RNN for time-dependent diagnosis. CNN is applied by Yao et al. (2020) to detect cracks, sensor failures, pipeline corrosion, etc., In (Zhang et al., 2020), LSTM plays a key role in predicting the regulator water level variations. A prediction model combining CNN and LSTM was established to analyze and predict the deterioration trend of NPP primary loop pipelines (Hong et al., 2022).
The operation of pressurized water reactor (PWR) NPPs relies on a Primary Heat Transfer (PHT) loop where multiple connected nodes establish the coolant circulation. To make a more comprehensive analysis, the prediction model needs an overview of the entire PHT loop behavior rather than focusing on a certain node. For this purpose, this work proposes a deep learning-based multi-node framework to monitor and analyze the temperature variations at three critical nodes in the PHT loop when LOCA occurs. The prediction framework can sense its current operation parameters and predict its post-LOCA operating progression. Through the connection between various nodes, it is also possible to grasp the overall plant operation trend, obtain comprehensive conclusions, and provide a more reliable decision-making basis for system operation and emergency response.
Section 1 of this paper is the background introduction. Section 2 describes the construction of the main models and methods of the framework. Section 3 is the presentation of the verification experiments and analysis. This paper is then concluded in Section 4.
The data-driven multi-node framework is mainly composed of models for core inlet temperature prediction, core outlet temperature prediction, steam generator (SG) steam temperature prediction, and their polynomial fitting methods. The post-LOCA temperature data from each node is fed into the corresponding deep learning model of the framework as input data.
Due to the complex physical process, the interaction between systems and equipment, and the non-linear variation of important parameters, the coolant temperature at core inlet has non-linear and time-dependent characteristics. As a variant of RNN, LSTM has the advantages alleviating the above challenges: 1) It has an efficient long-term memory function for time series prediction; 2) It can be used to predict complex non-linear time series data as a non-linear model (She et al., 2019). Thus, LSTM is chosen for the first node (core inlet) to predict the temperature variation.
The inlet temperature prediction model using LSTM is constructed by two LSTM layers and two dense layers. Two LSTM layers are used to build the model such that the complex post-LOCA temperature variations can be fully covered. Two dense layers then follows the LSTM layers to ensure all the necessary features are included within the prediction results. The dropout value is set to 0.2. The model structure is shown in Figure 1 and Table 1 presents the specific parameter configuration. The “LOCA data” in Figure 1 refers to the post-LOCA inlet temperature data. The best performing parameter configuration is determined via both historic experience and repeated tests. The successful experience of applying deep learning models in previous studies (She et al., 2019; She et al., 2021; Gong et al., 2022) provide a basic configuration of the model parameters. The newly conducted tests using current datasets then help improve the basic configuration to be more suitable for the proposed framework.
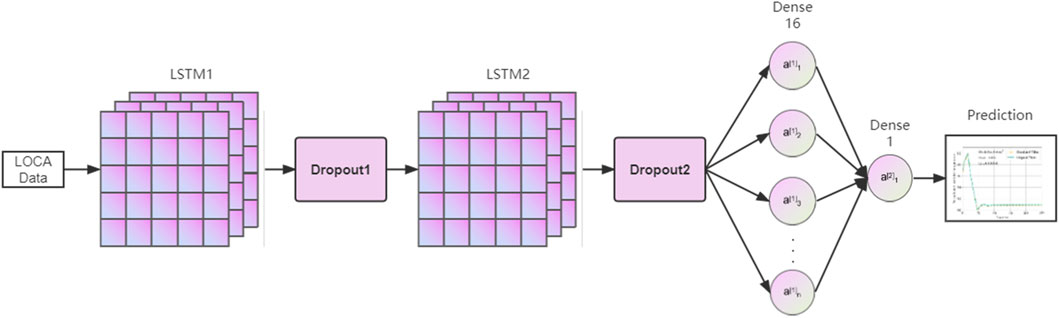
FIGURE 1. LSTM structure.
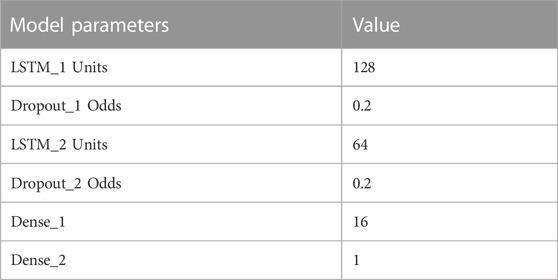
TABLE 1. Parameters of LSTM.
The core outlet is the second node where the coolant takes the fission heat out of the reactor. Due to the complex interactions inside the core, the temperature variation at the outlet becomes uncertain and hard to predict, which requires a prediction model capable of dealing with such uncertainty and similar situations.
To tackle the challenge of uncertainty, a combined structure of CNN and LSTM is employed to build a prediction model (She et al., 2021). CNN utilizes its convolutional structure of weight sharing and pooling operations to effectively extract the data features of operation conditions. The LSTM structure properly handles the incoming time series data and predicts the future progression. Two LSTM layers are deployed in the framework to increase the depth of the neural network such that the complex temperature variation can be captured and analyzed appropriately. Two dense layers are also applied to the prediction results processing.
The CNN + LSTM model is composed of one CNN layer, two LSTM layers, and two dense layers. Figure 2 presents the model structure and Table 2 contains the specific parameter configuration. The “LOCA data” in the figure means the post-LOCA outlet temperature data.
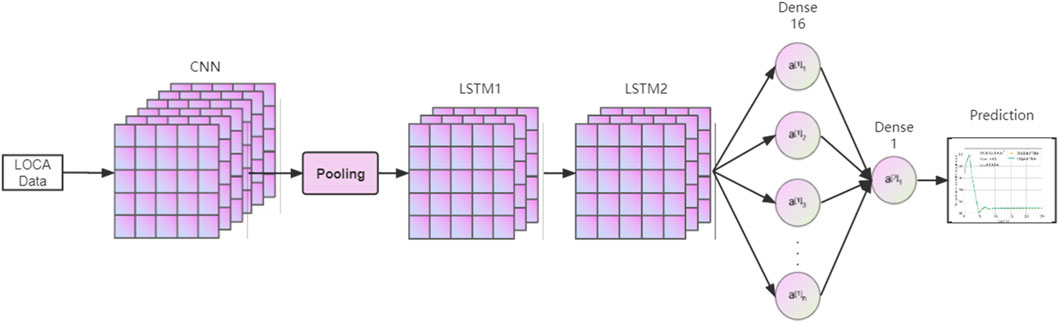
FIGURE 2. CNN + LSTM structure.
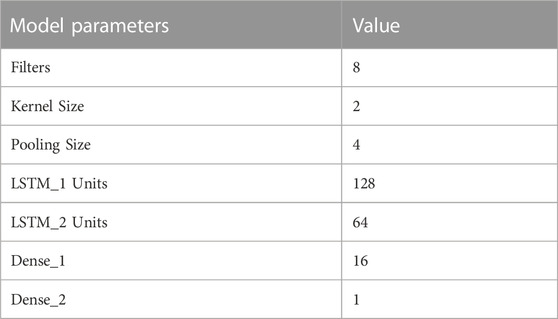
TABLE 2. Parameters of CNN + LSTM.
The coolant enters the SG and accomplishes the heat exchange. The steam temperature is affected by several key system parameters such as pressure, flowrate, water level, etc. In order to accurately predict the steam temperature, the effects of non-linear, multivariate long time series need to be considered, which makes zLSTM (Gong et al., 2022) the steam temperature prediction model.
The standard LSTM forget gate function is defined as follows:
zLSTM is obtained by replacing the sigmoid in the LSTM forget gate with zigmoid as follows:
The zLSTM forget gate function can be obtained from Eqs 2–4 as shown in Eq. 5.
where Wfx, Wfh, bf are trainable parameters, xt is the current moment’s input, ht-1 is the previous moment’s state, and β is a hyper-parameter.
Such improvement allows the amplification of the sigmoid derivative such that model training is still feasible for LSTM even at the far end of the time series, which gives zLSTM the following advantages:
1 Non-linearity: zLSTM is capable of non-linear processing capability as a RNN variant.
2 Long-term memory: zigmoid has a larger gradient with the same output, which enhances the long-term performance by allowing the model to conduct learning over the full length of the time series. Longer inputs are then allowed to be fed into the model, enriching the information used for predictions.
3 Multivariate processing: zLSTM can handle an input vector that is assembled with multiple key system parameters, providing system-wide data support for predictions.
In the zLSTM structure, there are one input layer, two hidden layers, and one output layer. Details are given in Table 3.
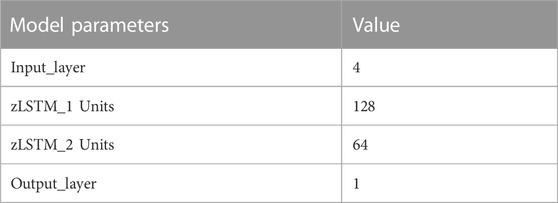
TABLE 3. Parameters of zLSTM Model.
Polynomial fitting is to fit the functional relation of variables in a polynomial form, which is defined as follows:
It can be applied to operation data processing with the following characteristics:
1. It can simulate non-linearly separated data.
2. It is generally more flexible and can simulate complex relations.
3. It requires some prior knowledge of the data to choose the best index.
The mentioned advantages were applied to the reliability assessment of nuclear power operation systems (Boopathi et al., 2021). The polynomial fitting method is utilized in this work to simulate the functional relation between each node, leading to an analytical description of the operation trend. Predictions can be more reliable and accurate by considering the results from both a deep learning model and a polynomial fitting. In the framework, polynomial fitting of current node is calculated using the operation data from the previous node, e.g., the core outlet temperature fitting result is calculated using the inlet temperature operation data; while the core outlet temperature operation data is used for the polynomial fitting of the SG steam temperature.
This work selects the data of three important nodes in the PHT loop for the framework modeling, namely core inlet temperature, core outlet temperature, and SG steam temperature. Firstly, the aforementioned LSTM, CNN + LSTM, and zLSTM are trained by temperature operation datasets from corresponding loop nodes. The polynomial fitting of current node is conducted using the values from previous node, which establishes the analytical rules for the parameter transfer and exchange within the framework. By means of statistical analysis, which is Mean Squared Error (MSE) and Mean Absolute Error (MAE) in this work, the prediction result and the fitting result of each node are compared to determine the selected input for the next node. The multi-node operation condition prediction framework is systematically presented in Figure 3.
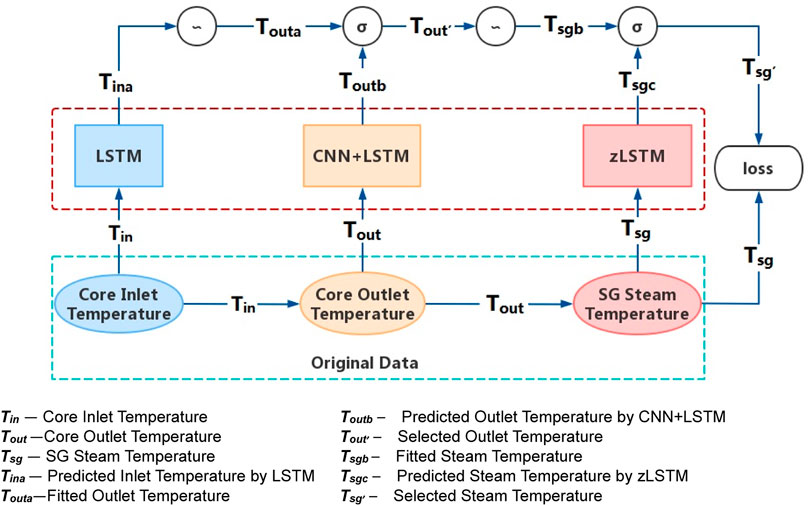
FIGURE 3. Multi-node operation condition prediction framework.
The datasets are obtained from LOCA simulations using an industry-grade NPP simulation platform (Sun et al., 2017). The platform mainly uses shared memory technology and an engineering simulator coupled with MATLAB/Simulink. Subsequently, the performance can be evaluated through simulations of abrupt load-transient changes and wide range-load changes. The simulations are carried out at 100% reactor power for two LOCA cases, i.e., break sizes of 0.7 cm2 and 0.8 cm2.
Each LOCA sample contains 10 key system parameters:
1 Core inlet temperature;
2 Core outlet temperature;
3 Core outlet subcooling;
4 pressurizer pressure;
5 pressurizer water level;
6 Coolant flowrates;
7 SG water level;
8 SG steam pressure;
9 SG steam temperature;
10 SG steam flowrate.
Core inlet temperature, core outlet temperature and SG steam temperature are selected for this experiment. Datasets are extended by introducing noisy signals. Seventy-five percentage of the dataset is used for training purposes and the rest is used for the test experiments. The time window for each model training is set to 4. A continuous period with 150 s of data is then randomly selected in the test set for model validation.
All the datasets are available in the Supplementary Material of this paper.
Three Gaussian noise perturbations are introduced during the simulation such that the dataset is expanded into three new samples and has a wider coverage of possible situations. The dataset proportion between the training set and the test set is 3:1. The test set is also plotted as the “original value” in the result figures such that the comparison between the simulation results and the actual LOCA trend can be observed. All the data is denoised, smoothed, and then normalized to the maximum and minimum values.
MSE and MAE are chosen as the performance metrics to evaluate the multi-node prediction framework.
where
SVM and ANN have also been applied to predicting the operation trend of NPPs (Sallehhudin and Diab, 2021; Moshkbar-Bakhshayesh and Ghofrani, 2022), except that their main purpose is to verify the accuracy and reliability of the single node prediction by the improved machine learning methods. The feasibility of applying predictions to the entire PHT loop was not considered yet in the previous researches. In order to prove the accuracy improvement of the multi-node prediction framework, this paper selects SVM and ANN as the baseline to predict the SG steam temperature at the last node. The prediction accuracy comparison is represented through MSE and MAE among the three methods.
This work refers to the rolling update method to derive the multivariate time series data required for model training. The training parameters are determined according to previous successful studies which verified a set of parameter configurations for applying deep learning models to LOCA diagnosis and predictions. The window size of the baseline model and each node model is set to 4, and the highest degree of polynomial fitting is set to 8. In the experiments, Adam optimizer (Kingma and Adam, 2014) is applied during the model training with a learning rate 0.001.
Firstly, the functional verification experiment of the multi-node prediction framework is carried out to prove its functional feasibility during a simulated LOCA. Datasets of 0.7 cm2 and 0.8 cm2 break size are selected for model training and test. The verification experiment is divided into the following three steps.
The input vector Tin, which contains the test data of the first 150 s in the LOCA process, is used as the input to the prediction model (LSTM). There is no fitting process since it is the first node. Figure 4 presents the experimental result of the LOCA with both 0.7 cm2 and 0.8 cm2 break sizes.
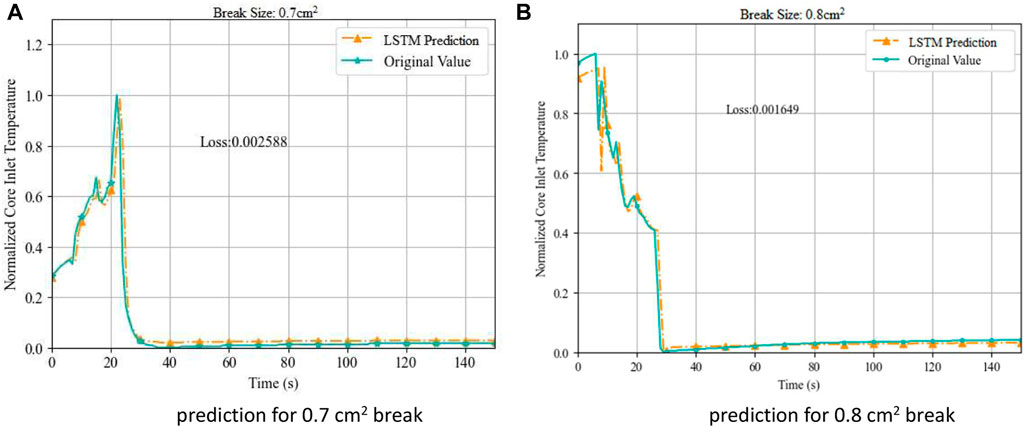
FIGURE 4. Prediction of core inlet temperature during LOCA. (A) prediction for 0.7 cm2 break (B) prediction for 0.8 cm2 break.
In the 0.7 cm2 break case, except for a slight delay in the predicted trend where the LSTM model is catching necessary information, the predicted temperature Tina fits the original trend with an MSE evaluation 2.59 × 10⁻³, proving an accurate prediction performance.
Similar to the inlet node, an input vector Tout randomly selected from the outlet temperature dataset is used by the CNN + LSTM model to produce an outlet temperature prediction Toutb. The polynomial fitting at this node uses the inlet prediction values to generate a fitted outlet temperature result Touta. Both the predicted value and fitted value are shown in Figure 5 (0.7 cm2) and Figure 6 (0.8 cm2), respectively.
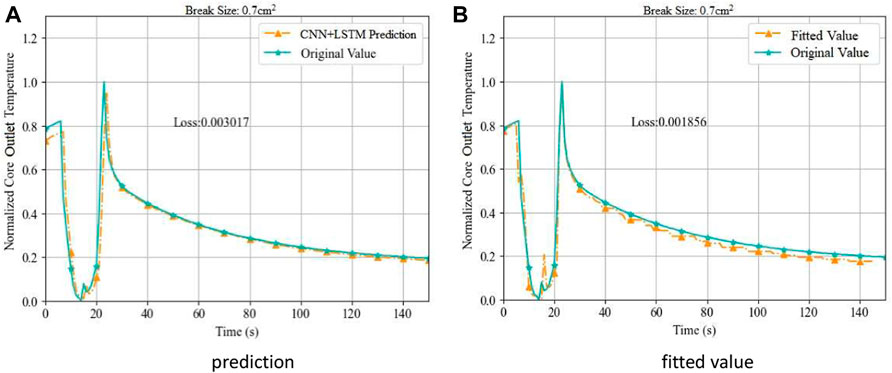
FIGURE 5. Prediction and Fitting of Core Outlet Temperature on Break Size 0.7 cm2. (A) prediction (B) fitted value.
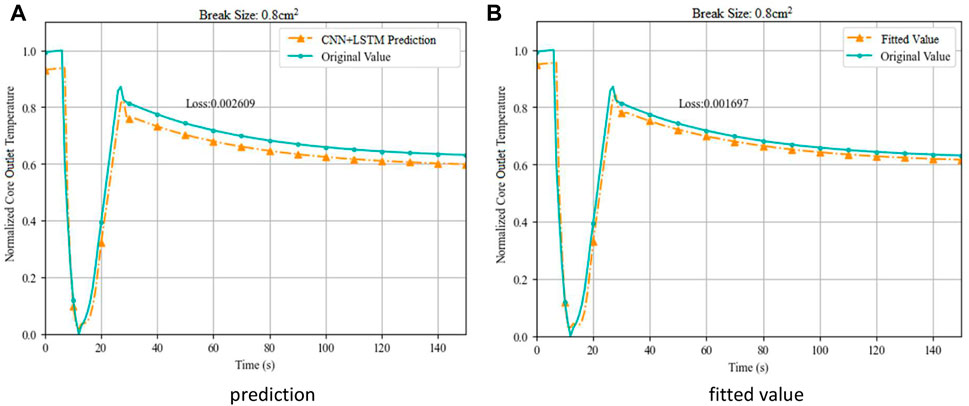
FIGURE 6. Prediction and Fitting of Core Outlet Temperature on Break Size 0.8 cm2. (A) prediction (B) fitted value.
The prediction result shows slightly delayed response, especially when the initial prediction results drifts from the original data. On the other hand, the fitted result matches the original data more precisely except the far end where the convergence is weakened. The MSE results for 0.7 cm2 break are 3.02 × 10⁻³ for prediction Toutb and 1.86 × 10⁻³ for fitted Touta, which determines the fitted data Touta to be selected as Tout’ for the next node.
The SG water level, SG steam pressure, SG steam temperature, and SG steam flow of the LOCA cases are extracted for 150 s and fed into the zLSTM to obtain the SG steam temperature prediction result Tsgc. Meanwhile, the fitted result Tsgb is generated by using Tout’ from the outlet node in the polynomial fitting. Both results are shown in Figure 7 (0.7 cm2) and 8 (0.8 cm2), respectively.
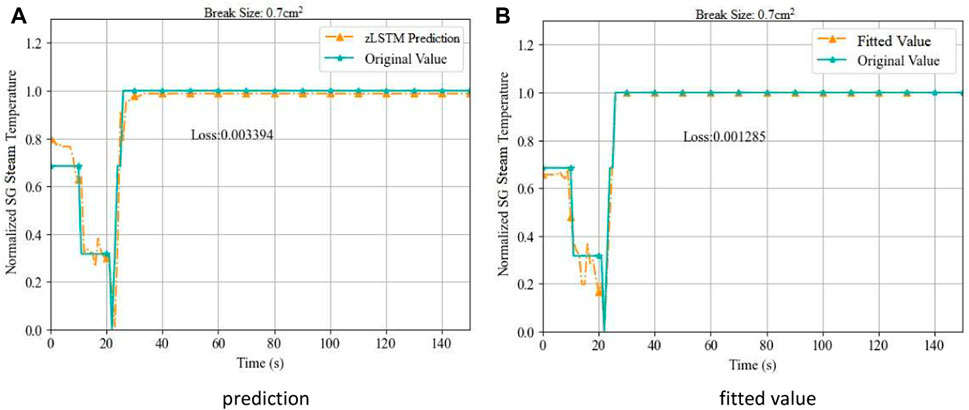
FIGURE 7. Prediction and Fitting of SG Steam Temperature on Break Size 0.7 cm2. (A) prediction (B) fitted value.
The prediction model experiences a learning stage at the beginning due to the multivariate scenario, which temporally limits its predicting performance. After a period of time, the predicted trend becomes consistent with the original data. The polynomial fitting becomes more complex at this SG node, showing relatively large fluctuations when inflection points appear in the original curve. It matches operation trend tightly only when the situation turns to be stable. With the MSE results (0.7 cm2) 3.39 × 10⁻³ for Tsgc and 1.29 × 10⁻³ for Tsgb, Tsgb is qualified for the final output of the multi-node prediction framework (Figure 8).
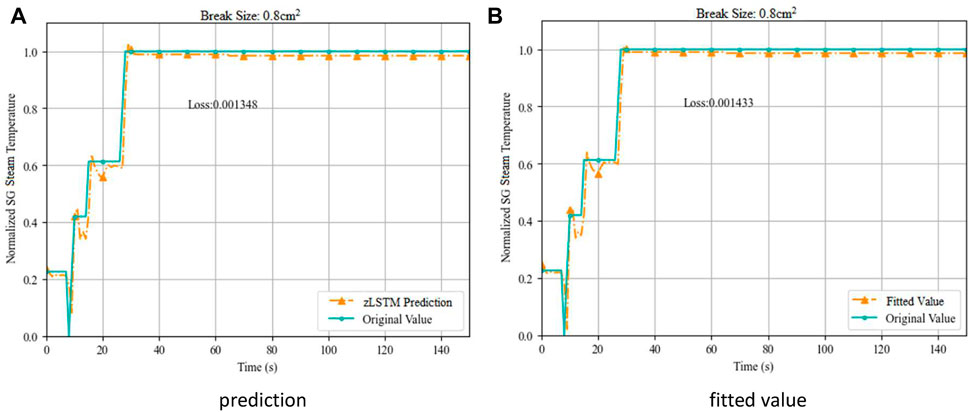
FIGURE 8. Prediction and Fitting of SG Steam Temperature on Break Size 0.8 cm2. (A) prediction (B) fitted value.
The comparative experiments are against the baseline models SVM and ANN. Both MSE and MAE are chosen as the metrics such that a more comprehensive performance evaluation can be provided. Since SVM and ANN only predict a single scenario, the performance comparison is conducted for the steam temperature predictions from the framework and the baselines. The results comparisons are offered in Figure 9. Table 4 shows the temperature prediction accuracy on the two break sizes.
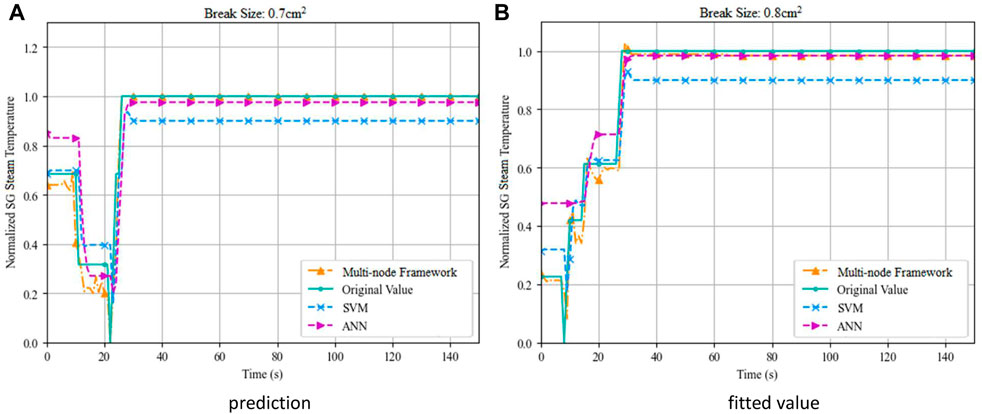
FIGURE 9. Comparison of prediction of SG steam temperature during LOCA. (A) prediction (B) fitted value.

TABLE 4. Accuracy evaluations for framework models and baseline models.
Figure 9 visually illustrates the development of the operation conditions predicted by different models. Throughout the process, the multi-node prediction framework represents a more accurate prediction. The prediction accuracy metrics listed in Table 4 describe the prediction performance of the tested models. The upper part of Table 4 gives the MSE values, while the MAE values are listed in the lower part.
Analysis and investigations of the experimental results are provided below.
1 The multi-node prediction framework provides more accurate predictions compared to SVM and ANN. For instance, the best MSE obtained at SG node in the 0.7 cm2 case (0.001285) is 93.2% lower than that of SVM (0.01896) and 86.2% lower than that of ANN (0.009313).
2 0.7 cm2 break size presents a gradual progression. In this LOCA case, polynomial fitting is more efficient and accurate through the entire framework with a lower loss value. The 0.8 cm2 break LOCA case generates more inflection points during its development. It then requires more historical data for the predictions, especially at the SG node where zLSTM demonstrates its capability of dealing with multiple input variables as a deep learning-based model.
3 The selection of more accurate result being passed to the next node leads to gradual decreasing in loss value along the node chain, playing a role of error filter that enhances the prediction accuracy node by node. An inference is that the framework can be more accurate by increasing the node numbers, which is hereby a suggestion to the future study.
4 It is observed from all the figures that deep learning-based models convergent quickly during non-linear states even though they need a short period at the beginning to catch up with the variations. The longer the LOCA process is, the better performance in all the three prediction nodes due to their LSTM elements. The fitted values, on the contrary, can assure a tight following with the original data at linear stages and become drifted when a non-linear trend lasts.
5 At the outlet node and SG node, both 0.7 cm2 case and 0.8 cm2 case are investigated with the prediction as well as the fitting method. Each case is evaluated using two metrics MSE and MAE, presenting eight result pairs (four pairs per node) for the investigation on the simulation methods. For example, the 0.7 cm2 case at the outlet node gives the MSE 0.003017 for prediction and 0.001856 for fitted value, showing a 38.5% decrease of MSE in the fitting method. In six of the eight pairs, the fitting method presents significant error decrease. Even in the other two pairs where predictions have better performance, the difference is as low as 5.9% (MSE at SG node) and 2.7% (MAE at SG node). An explanation for the “fitting advantage” phenomenon is that the fitting uses the prediction result from previous node as input and then successfully combined the advantages of both the deep learning model and the polynomial method.
This paper proposes a multi-node prediction framework for the prediction of NPP operation conditions. The framework first builds a deep learning-based prediction model for each selected critical nodes in the PHT loop according to their data characteristics. Parallelly, a polynomial fitting value is calculated using the prediction from previous node such that the output of this node will be a comparative result with lower loss value. Under such a scheme, the framework is capable of generating more and more accurate result and, as a consequence, producing an accurate system prediction at the last stage.
The framework is a data-driven platform without the necessity of building mathematical system models. With the assistant of the deep learning method, the historical operation data can be used to directly describe the system behaviors. The framework establishes an integration of the corresponding deep learning models along with polynomial fitting methods, providing a comprehensive base for the system predictions.
The verification experiments and comparative experiments are conducted for LOCA cases, which successfully demonstrate the feasibility and advantages of the framework. The prediction accuracy in forms of MSE and MAE confirms its superior position against the baseline models with the MSE optimization up to 93.2% and 86.2%.
Moreover, there are still some issues left for future research beyond this work. First of all, only temperature-related datasets are used for experiments, leaving other key system parameters of the PHT loop with further investigation. In addition, the difficulty of predicting and fitting the operation condition gradually increases with the process complexity, resulting in poor prediction and fitting effects at the initial steps of the simulations. Further exploration on dealing with system complexity is necessary to improve the current PHT prediction approach. Finally, besides the simulated operation data, the NPP onsite data could be a complement to this research if accessible.
The original contributions presented in the study are included in the article/Supplementary Material, further inquiries can be directed to the corresponding authors.
TS conducted the modeling of the framework and designed corresponding methodologies to train and test it. TS also drafted Section 3 and Section 4 of the manuscript. JS proposed the original idea of building a prediction framework where nodes embedded with deep learning models generates operation predictions. Section 1 and Section2 of this manuscript are also drafted by JS. PL was responsible for the dataset preprocessing and most of the coding to realize the framework. JJ carried out the literature review and part of the coding. WC provided constructive suggestions to the LOCA simulation and dataset selection.
The authors would like to thank the financial and technical support from the following research projects and institutions, including but not limited to:1) National Key Research and Development Project (2020YFB1713400);2) Provincial Talents Gathering Project—Innovation Talents Plan (2018RS3050);3) the Central Research Institution of the State Power Investment Co., Ltd. (SPIC);4) China Guangdong Nuclear (CGN) Research Institution Co., Ltd.
Author WC was employed by the company Nuclear Power Institute of China.
The remaining authors declare that the research was conducted in the absence of any commercial or financial relationships that could be construed as a potential conflict of interest.
All claims expressed in this article are solely those of the authors and do not necessarily represent those of their affiliated organizations, or those of the publisher, the editors and the reviewers. Any product that may be evaluated in this article, or claim that may be made by its manufacturer, is not guaranteed or endorsed by the publisher.
The Supplementary Material for this article can be found online at: https://www.frontiersin.org/articles/10.3389/fenrg.2023.1099326/full#supplementary-material
Ayodeji, A., Liu, Y. K., and Xia, H. (2018). Knowledge base operator support system for nuclear power plant fault diagnosis. Prog. Nucl. Energy 105, 42–50. doi:10.1016/j.pnucene.2017.12.013
Boopathi, M., Sujatha, R., and Senthil kumar, C. (2021). Multivariate polynomial fit: Decay heat removal system and pectin degrading Fe3O4-SiO2 nanobiocatalyst activity. IET Nanobiotechnology 15, 173–196.
Chen, F. C., and Jahanshahi, M. R. (2017). NB-CNN: Deep learning-based crack detection using convolutional neural network and naïve bayes data fusion. IEEE Trans. Ind. Electron 65. 4392, doi:10.1109/tie.2017.2764844
Gong, S. S., Yang, S. Y., She, J. K., Li, W., and Lu, S. (2022). Multivariate time series prediction for loss of coolant accidents with a zigmoid-based LSTM. Front. Energy Res. 10, 852349. doi:10.3389/fenrg.2022.852349
Hu, G., Zhou, T. T., and Liu, Q. F. (2021). Data-driven machine learning for fault detection and diagnosis in nuclear power plants: A review. Front. Energy Res. 9, 99–110. doi:10.3389/fenrg.2021.663296
Kim, J., Yoon, J. W., Kim, H., and Lee, S. U. (2021). Prediction of ballooning and burst for nuclear fuel cladding with anisotropic creep modeling during loss of coolant accident (LOCA). Nucl. Eng. Technol. 53, 3379–3397. doi:10.1016/j.net.2021.04.020
Kingma, D., and Adam, J. B. (2014). A method for stochastic optimization. San Diego, CA USA: Computer Science.
Liang, K., Zhou, B. X., and Zhang, Y. Y. (2022). PF2RM: A power fault retrieval and recommendation model based on knowledge graph. Energies 15, 1810.
Ling, J., Liu, G. J., Li, J. L., Shen, X. C., and You, D. D. (2020). Fault prediction method for nuclear power machinery based on Bayesian PPCA recurrent neural network model. Nucl. Sci. Tech. 31 (8), 75–23. doi:10.1007/s41365-020-00792-9
Meng, J. L., Su, Y. B., and Xie, S. L. (2020). Loose parts detection method combining blind deconvolution with support vector machine. Ann. Nucl. Energy 149, 107782. doi:10.1016/j.anucene.2020.107782
Miao, X. B. (2022). Research on fault feature extraction and pattern recognition of rolling bearing. Math. Problems Eng., 2022).
Min, J. H., Kim, D. W., and Park, C. Y. (2019). Demonstration of the validity of the early warning in online monitoring system for nuclear power plants. Nucl. Eng. Des. 349, 56–62. doi:10.1016/j.nucengdes.2019.04.028
Moshkbar-Bakhshayesh, K., and Ghafari, M. (2022). Prediction of steam/water stratified flow characteristics in npps transients using svm learning algorithm with combination of thermal-hydraulic model and new data mapping technique. Ann. Nucl. Energy 166, 108699. doi:10.1016/j.anucene.2021.108699
Moshkbar-Bakhshayesh, K., and Ghofrani, M. B. (2013). Transient identification in nuclear power plants: A review. Prog. Nucl. Energy 67, 23–32. doi:10.1016/j.pnucene.2013.03.017
Qian, H., Xu, B. Z., and Zhang, J. (2022). Research on deterioration evolution trend of primary loop piping in nuclear power plant based on fusion health index. Ann. Nucl. Energy 179, 109394. doi:10.1016/j.anucene.2022.109394
Sallehhudin, W., and Diab, A. (2021). Using machine learning to predict the fuel peak cladding temperature for a large break loss of coolant accident. Front. Energy Res. 9, 755638. doi:10.3389/fenrg.2021.755638
She, J. K., Shi, T. Z., Xue, S. Y., Zhu, Y., Lu, S., Sun, P., et al. (2021). Diagnosis and prediction for loss of coolant accidents in nuclear power plants using deep learning methods. Front. Energy Res. 9, 665262. doi:10.3389/fenrg.2021.665262
She, J. K., Xue, S. Y., and Sun, P. W. (2019). The Application of LSTM model to the prediction of abnormal operation in nuclear power plants. Instrumentation 26, 39–44.
Sun, P. W., Zhao, H. H., Liao, L. T., Zhang, J., and Su, G. (2017). Control system design and validation platform development for small pressurized water reactors (SPWR) by coupling an engineering simulator and MATLAB/Simulink. Ann. Nucl. Energy 102, 309–316. doi:10.1016/j.anucene.2016.12.034
Wang, H., Peng, M. J., Yu, Y., Saeed, H., Hao, C. m., and Liu, Y. k. (2021). Fault identification and diagnosis based on KPCA and similarity clustering for nuclear power plants. Ann. Nucl. Energy 150, 107786. doi:10.1016/j.anucene.2020.107786
Yang, J., Yang, Y., Deng, C. C., and Ishii, M. (2019). Best estimate plus uncertainty analysis of a large break LOCA on generation III reactor with RELAP5. Ann. Nucl. Energy 127, 326–340. doi:10.1016/j.anucene.2018.12.019
Yao, Y., Wang, J., Long, P., and Xie, M. (2020). Small-batch-size convolutional neural network based fault diagnosis system for nuclear energy production safety with big-data environment. Int. J. Energy Res. 44, 5841–5855. doi:10.1002/er.5348
Yu, Y., Peng, M. J., Wang, H., Ma, Z. g., and Li, W. (2020). Improved PCA model for multiple fault detection, isolation and reconstruction of sensors in nuclear power plant. Ann. Nucl. Energy 148, 107662. doi:10.1016/j.anucene.2020.107662
Zhang, J., Wang, X., Zhao, C., Bai, W., Shen, J., Li, Y., et al. (2020). Application of cost-sensitive LSTM in water level prediction for nuclear reactor pressurizer. Nucl. Eng. Technol. 52 (7), 1429–1435. doi:10.1016/j.net.2019.12.025
Zhao, Q. S., Deng, D. B., and Liu, Y. (2011). “The on-line monitoring and diagnosis system for thermal performance of secondary loop in Daya Bay nuclear power plant,” in 2011 Asia-Pacific Power and Energy Engineering Conference, 1–5.
Keywords: CNN, LSTM, zLSTM, LOCA, prediction, polynomial fitting, multi-node framework
Citation: Shi T, She J, Li P, Jiang J and Chen W (2023) A deep learning-based framework for the operation prediction of primary heat transfer loop in nuclear power plants. Front. Energy Res. 11:1099326. doi: 10.3389/fenrg.2023.1099326
Received: 15 November 2022; Accepted: 30 January 2023;
Published: 10 February 2023.
Edited by:
Xinyu Wei, Xi’an Jiaotong University, ChinaReviewed by:
Xingang Zhao, Oak Ridge National Laboratory (DOE), United StatesCopyright © 2023 Shi, She, Li, Jiang and Chen. This is an open-access article distributed under the terms of the Creative Commons Attribution License (CC BY). The use, distribution or reproduction in other forums is permitted, provided the original author(s) and the copyright owner(s) are credited and that the original publication in this journal is cited, in accordance with accepted academic practice. No use, distribution or reproduction is permitted which does not comply with these terms.
*Correspondence: Jingke She, c2hlamluZ2tlQGhudS5lZHUuY24=
Disclaimer: All claims expressed in this article are solely those of the authors and do not necessarily represent those of their affiliated organizations, or those of the publisher, the editors and the reviewers. Any product that may be evaluated in this article or claim that may be made by its manufacturer is not guaranteed or endorsed by the publisher.
Research integrity at Frontiers
Learn more about the work of our research integrity team to safeguard the quality of each article we publish.