 Ruixiang Yang
 Moduo Yu1*
 Nengling Tai
- 1Department of Electrical Engineering, School of Electronic Information and Electrical Engineering, Shanghai Jiaotong University, Shanghai, China
- 2Shinan Power Supply Company, Shanghai Electric Power Company, State Grid Corporation of China, Shanghai, China
The application of power electronic technology which is widely used in large mechanical equipment of ports causes inevitable harmonic pollution issues. Due to the small capacity of the port power system, harmonic interference will bring huge security risks to its normal operation. Therefore, it is necessary to carry out the effective localization of the harmonic sources in the grid. In this paper, a harmonic source localization method based on the stagewise regularized orthogonal matching pursuit (SROMP) is proposed by improving the orthogonal matching pursuit (OMP) in a compressed sensing theory. It can achieve accurate localization of harmonic sources only through measurement information analysis, which is significantly superior to traditional methods. First, according to the grid topology and line parameters, a system equation is constructed that takes the node harmonic voltage as the measurement variable and the harmonic current injected to the node as the state variable. Next, the equation is solved to obtain the harmonic current value injected to each node. The result can reflect the harmonic injection situation of each node, so as to determine the position of each harmonic source. In order to test the localization effect of the algorithm under different measurement configurations, the SROMP method is compared with other algorithms in considerable simulation experiments on the improved IEEE-33 model, which verifies the stability and accuracy of the proposed algorithm.
1 Introduction
An electrified port is an important transportation hub. The stable operation of the regional power grid plays a vital role in port production efficiency and economic development (Wang et al., 2021). With the rapid development of modernization, the capacity of the modern port power system is increasing day by day. Power electronic technologies, such as rectification, frequency conversion, and energy feedback (Wang 2013; Hu et al., 2016; Javaid et al., 2020), are being widely used in port electrical equipment, which include the gantry crane, quayside container crane, car dumper, and motor (Ju et al., 2014; Kanellos 2019). The application of these new technologies improves the efficiency of port equipment, but, on the other hand, causes massive harmonic pollution. The deterioration of power quality has become an inevitable problem. The harmonic current increases the loss of distribution transformers and transmission lines, which leads to problems like equipment heating, equipment aging, and capacitor resonance (Elphick et al., 2017; Ho and Lam 2021), so as to reduce the utilization rate of electric energy, reduce the service life of equipment, and put a huge hidden danger to the safe and stable operation of the power system. The harmonic source location is crucial for timely harmonic monitoring and management to effectively solve this problem. Better division of harmonic responsibility can be made only by mastering the distribution of each harmonic source in the power grid, so as to carry out corresponding punishment measures, eliminate harmonic pollution from the root, and improve the reliability of the power supply in the port (Fernandes et al., 2022).
Currently, the research on harmonic source location is mainly divided into two methods, namely, the equivalent circuit method and the harmonic state estimation (HSE) method. The main harmonic source can be determined by understanding which side the point of common coupling occurs using the equivalent circuit method, but the specific position of the harmonic source cannot be determined (Chen et al., 2019). However, HSE can systematically present the harmonic source position accurately to the node by solving the mathematical model, which is a data-driven harmonic source location technology (Bai et al., 2017). Traditional methods of HSE are the least square (LS) method and its improved algorithm, from the LS method based on the power model proposed by G. T. Heydt (1989) for the first time to the singular value decomposition (Xu 2006), sparse representation (Liao 2007), and total least square method (Li 2015). Due to the high installation cost of the measuring device in the power grid, the system is often in a non-globally observable state, and the problems, such as misjudgment of harmonic source, insufficient accuracy, and poor stability arises when the aforementioned methods are applied. Zhang et al. (2021) proposed the HSE method based on the OMP algorithm, which makes up for the aforementioned defects to a certain extent, but still has a high error risk when the system lacks abundant measurement and calculation complexity. Donoho et al. (2012) added the segmentation filtering process to improve the operation speed of OMP, but its accuracy is easy to float in different situations. Needell and Vershynin (2010) proposed regularized orthogonal matching pursuit to realize high precision of reconstruction, while it leads to a longer operation time.
This paper proposes a new HSE method based on SROMP, which realizes an effective harmonic source location when the system lacks substantial amount of measurement devices compared with the aforementioned methods. Compared with the aforementioned methods, it has higher estimation accuracy, favorable calculating speed, and better robustness.
2 Harmonic state estimation
In the port distribution network as shown in Figure 1, a quay crane (QC) is used to supply power to inshore ships. The merchandise of the port is stored in refrigerated containers. A gantry crane (GC) is used to handle and stack the containers. Electric vehicles (EV) are used to transport the containers. In addition, there are some distributed renewable energy like wind power and photovoltaic (PV) power. These can bring harmonic current injection into the grid anywhere, resulting in serious problems.

FIGURE 1. Port distribution network model.
2.1 Fundamental principle of HSE
HSE is constructed on the basis of harmonic measurement information, and its technical basis is a wide area measurement system (WAMS) that can monitor the state of the power grid in real time (Xiao et al., 2021). In WAMS, the synchronous phasor measuring unit (PMU) is installed at the node to obtain its operation parameters. Combined with the network topology and component parameters, the system equation including measurement variables and state variables is established. In case that the system is not globally observable, this equation becomes an underdetermined equation, and the following method can be used to obtain the optimal solution.
2.2 Least square
The LS method is a general method to solve the HSE equation.
Assuming that the harmonic information of s nodes is measured by the PMUs in the power grid and there are t state variables in the system, the following mathematical model is established:
where F is the s dimensional column vector, X is the t dimensional column vector to be solved, H is the measurement matrix, and e is the error vector. When e is ignored, then, equation1) can be transformed into
Then, the equation has the LS solution as follows:
where
2.3 Orthogonal matching pursuit
Compressed sensing is an important theory in signal processing. Traditional data transmission methods follow the Nyquist sampling theorem, which means that the data sampling frequency must be twice higher than the frequency of the original signal in order to make the characteristic of the original signal to be described without distortion, resulting in limited large-scale data transmission. The emergence of the compressed sensing theory breaks through the limitation of the Nyquist sampling theorem. It believes that the sampling theorem is only a sufficient and unnecessary condition for maintaining signal integrity. If the signal is sparse and compressible, the data can be compressed to become a low-dimensional observation signal for transmission, which can replace the original signal. Finally, the signal is reconstructed from the observation signal so that the storage space and transmission quantity of data are reduced and the data transmission speed is improved. At present, the common compressed sensing reconstruction algorithms are divided into the convex optimization algorithm, greedy algorithm, combination algorithm, and statistical algorithm. A greedy algorithm is the most widely used reconstruction algorithm in the field of compressed sensing. This method has less calculation and a fast operation speed. OMP is a greedy algorithm in the theory of compressed sensing. The premise of this method is that the elements in the measurement matrix are independent and uncorrelated, and the state vector is sparse. In that case, equation 2) can be transformed into
where
3 Harmonic source localization based on the stagewise regularized orthogonal matching pursuit algorithm
Using the OMP method to locate the harmonic source in the non-globally observable system improves the estimation accuracy to a certain extent. However, since only one atom can be selected in each iteration process, the operation efficiency is slow, and the estimation error of the algorithm increases greatly when the system lacks more measurement devices. Based on the original algorithm, this paper proposes the SROMP algorithm. The segmented screening process refers to the simultaneous selection of multiple atoms in one iteration process. The regularized screening process further filters the selected atom group, which not only accelerates the operation speed of the algorithm, but also ensures the estimation accuracy. This chapter describes in detail the process of applying the improved algorithm to the harmonic source location of the port distribution network. Section 3.1 describes the establishment process of the system equation. Section 3.2 contains the application of the improved algorithm to solve the system equation and the signal reconstruction process. Section 3.3 introduces the evaluation index system.
3.1 Establishment of the system equation
It is assumed that the voltage data of M nodes can be obtained in the N-node power grid (
where
3.2 Equation solving and signal reconstruction
The specific operation process of SROMP is as follows:
(1) Each column of
(2) The correlation between each atom of
where
(3) Filter the atom sequence satisfying equation8) from the one generated in Step 2:
Secondary screening requires the inner product of all atoms in the set and the residual to be less than twice the inner product of other atoms. There are many groups of such sequences, and the group with the largest energy is selected as
(4) Approximate the signal by the LS method using the following equation:
where
(5) If Eq. 12 is satisfied, perform the next step. Or let
(6) Signal reconstruction based on the final iteration result
3.3 Evaluation index
The estimated value of harmonic injection current needs to be compared with the real situation of the power grid. Therefore, it is necessary to simulate the algorithm many times and establish a set of index systems to evaluate the accuracy of the algorithm. The first step is whether the algorithm can identify the actual harmonic source. Set chl as the correct recognition rate. The second step is whether the algorithm will misjudge the non-harmonic source node as the harmonic source. Set whs as the average misjudgment quantity. Finally, the relative error between the estimated value and the actual value is set as rms, which refers to the root mean square percentage error, as shown in the following equations:
where M is the number of simulations.
The complete process of harmonic source localization based on SROMP is shown in Figure 2.
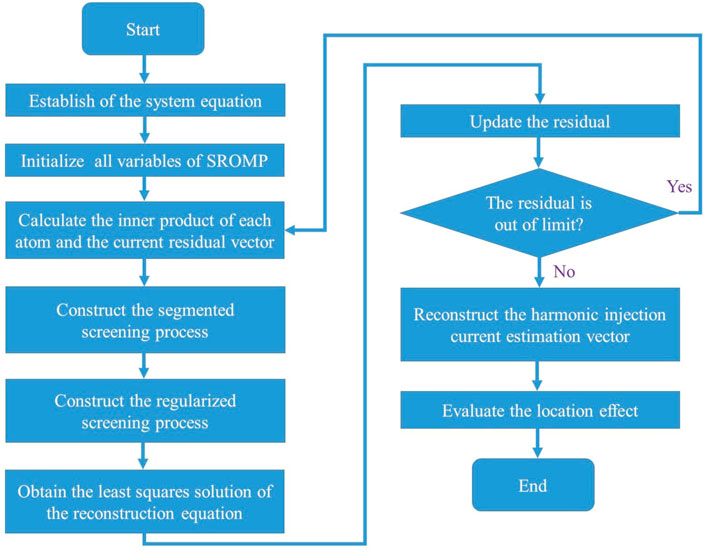
FIGURE 2. Flow chart of harmonic source localization based on SROMP.
4 Measurement device optimization
Considering the economic cost, the number of PMUs that can be installed in the port distribution network is limited. It is necessary to optimize the location of PMUs to monitor as many nodes as possible with fewer PMUs before the establishment of the measurement equation. The node installed a PMU that can measure the voltage of the node and the current of the branch connected to the node. When the line parameters are known, the voltage of adjacent nodes can be obtained using the circuit theory. First, to obtain a globally observable PMU configuration scheme for the N-node power grid, the following objective function is set:
where L represents the number of PMUs.
The optimal solution is obtained according to the constraint condition and the objective function. PMUs are installed on the corresponding nodes according to PMU status information. After obtaining the optimal measurement configuration scheme for the globally observable system, the PMUs of certain nodes are deleted to form the measurement configuration scheme for the non-globally observable system.
5 Simulation analysis
Based on the PSCAD\EMTDC v4.6.2 environment, the improved IEEE-33 node model is built, to which 5th and 7th harmonic sources are added. According to the measurement device optimization algorithm mentioned in Chapter 4, the corresponding objective function and constraint conditions of the IEEE-33 system are established, and the optimal configuration scheme of PMU under global observability of the system can be obtained as shown in Figure 3. PMUs are installed in the 11 nodes with asterisk in the figure.
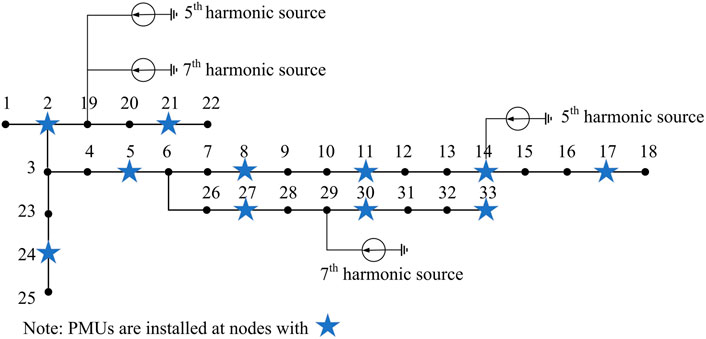
FIGURE 3. Improved IEEE-33 node model.
Figure 3 shows the distribution of harmonic sources, where 5th harmonic current of 10∠45° A and 20∠-30° is injected into Node 14 and 19, respectively, and 7th harmonic current of 20∠120° A and 30∠-135° A is injected into Node 19 and 29, respectively. The LS, OMP, and SROMP methods are used to locate harmonic sources under different conditions, and the results of the three methods are compared.
5.1 Case 1
When the system is globally observable, all 33 nodes can be measured. Table 1 shows the estimation results of non-zero harmonic injection current, and Table 2 shows the relative error of the estimated value.
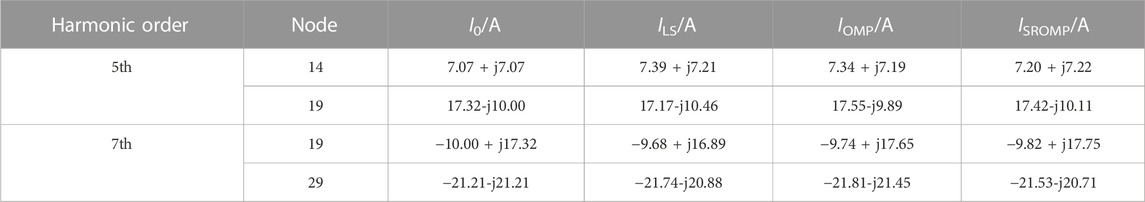
TABLE 1. Harmonic injection current estimation results.
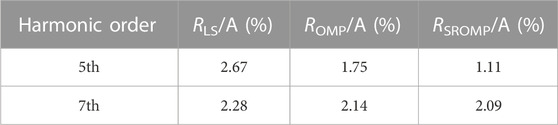
TABLE 2. Relative error.
From Tables 1, 2, it can be seen that the three methods can correctly determine the location of the four harmonic sources with no harmonic source misjudgment, and the relative errors are all within 5%. The positioning results are relatively accurate.
5.2 Case 2
When lacking PMU at Node 8 and Node 7-9 cannot be observed. In this case, the estimation results and relative errors are shown in Tables 3, 4.
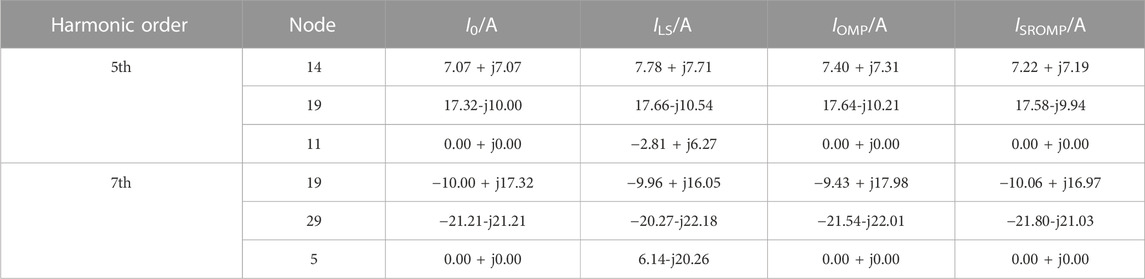
TABLE 3. Harmonic injection current estimation results.
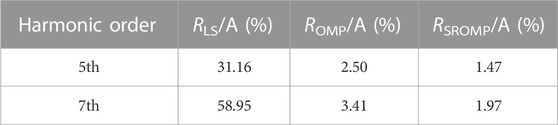
TABLE 4. Relative error.
It can be seen from Table 3, 4 that although the LS method can judge the position of the four harmonic sources, it misjudges Node 11 as the 5th harmonic source and Node 5 as the 7th harmonic source, resulting in a significant increase in the estimation error, while the OMP method and the SROMP method still maintain high accuracy.
5.3 Case 3
When lacking PMUs at Node 11 and Node 27, Node 10-12 and Node 26-28 cannot be observed. The results are shown in Tables 5, 6.

TABLE 5. Harmonic injection current estimation results.
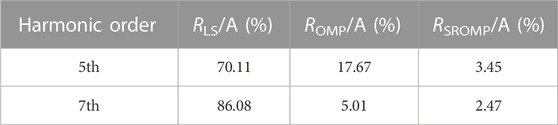
TABLE 6. Relative error.
It can be seen that the LS method misjudges Node 10 and 17 as the 5th harmonic sources, Node 23 and 28 as the 7th harmonic sources, and the harmonic current estimation error is too large. The OMP method misjudges Node 23 as the 5th harmonic source, and the estimation error is slightly improved, which is generally not greatly affected. The SROMP method still performs well, with accurate identification of harmonic sources and no misjudgment and the estimation error within 5%, which shows its favorable robustness.
5.4 Research on the influence of the quantity of measured nodes on the location effect
The method proposed in this paper has excellent stability. Only a small amount of measurement information is needed to achieve high-precision harmonic source location. The location effect is not affected by the number and position of measurement nodes to a certain extent. In order to verify this point, the number of measurement nodes is reduced one by one from the initial quantity in the situation of global observation. For each quantity level, the observed nodes are randomly selected in 100 simulations, and the estimation results are evaluated using Eqs 13-15. The analysis results are shown in Figures 4, 5.
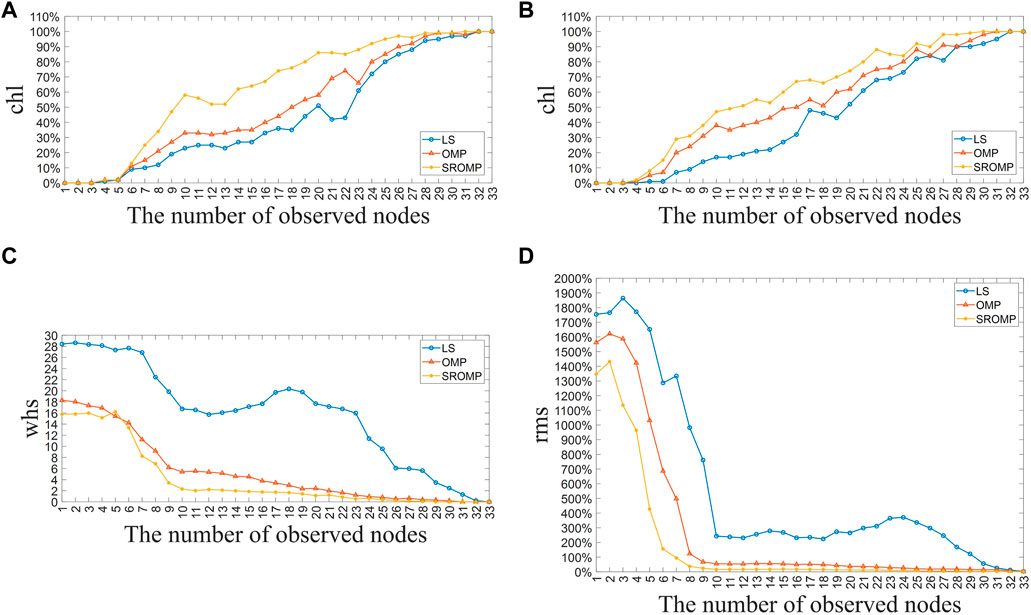
FIGURE 4. Analysis result of 5th harmonic. (A) chl of Node 14. (B) chl of Node 19. (C) whs of 5th harmonic. (D) rms of 5th harmonic.
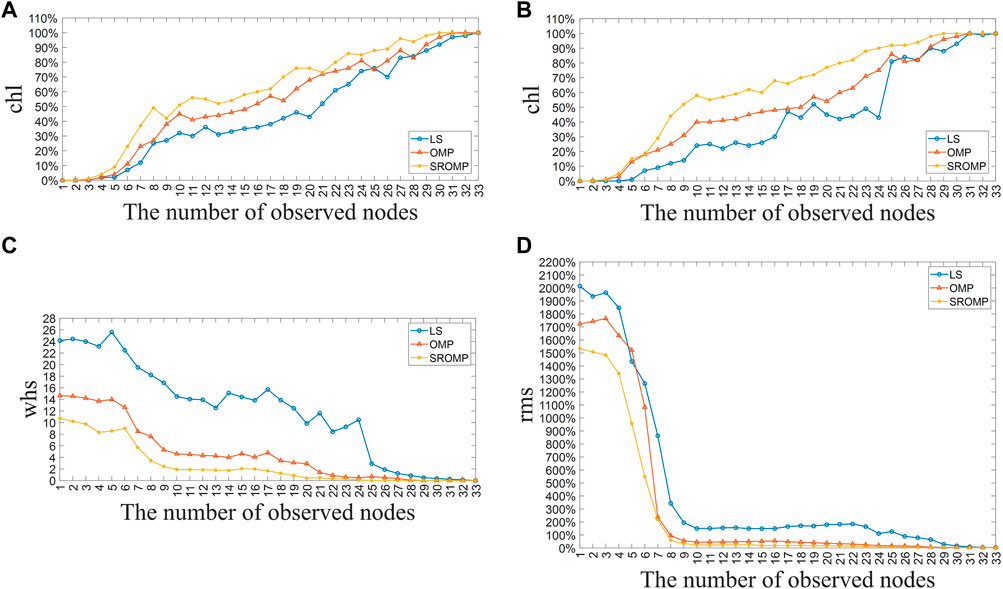
FIGURE 5. Analysis result of 7th harmonic. (A) chl of Node 19. (B) chl of Node 29. (C) whs of 7th harmonic. (D) rms of 7th harmonic.
Figures 4A, Bshow the recognition rate of the 5th harmonic source at Node 14 and 19. Figures 5A, B show the recognition rate of the 7th harmonic sources at Node 19 and 29. Figure 4C and Figure 5C are the average number of misjudged harmonic sources of the 5th and 7th harmonic in each simulation. Figure 4D and Figure 5D are the root mean square percentage errors of the 5th and 7th harmonic estimation. It can be seen that three methods are affected by the number of measurement nodes, but the degree of influence is different. When there is a lack of five measurement nodes, the three methods can still maintain a high chl, but the whs and rms of LS rise rapidly, while the indicators of OMP and SROMP remain relatively stable. SROMP is slightly superior to OMP. As the number of measurement nodes gradually decreases, the performance of LS is greatly reduced. When the system lacks half of the measurement nodes, which means there are 16 measurement nodes, the chl of Node 14 and 19 by LS falls to 30% around, whs rises to 17.66 of 5th and 13.84 of 7th, rms arrives at 232.74% of 5th and 149.57% of 7th. Obviously, LS has failed to reflect on the real harmonic source distribution of the system. OMP also creates many problems in the subsequent lack of measurement, with its chl fluctuating within the range of 40%–50%, whs rises to 3.77 of 5th and 4.05 of 7th, rms arrives at 50.12% of 5th and 54.86% of 7th, when measurement nodes are reduced to half. Only SROMP performs the best, of which the chl remains above 60%, whs is controlled within the two, and rms is limited at about 20% in the aforementioned cases. When measurement nodes are reduced to below 10, the performance of the three methods all deteriorates rapidly, which suggests that favorable harmonic source localization still needs fundamental basis of measurement. In general, SROMP surpasses OMP and LS in the whole performance, which can maintain a high-precision estimation level when the system lacks a large amount of measurement.
6 Conclusion
This paper proposes a harmonic source location method for the port distribution network based on SROMP, which realizes the determination of the number and location of harmonic sources in the system and the injection of the harmonic current. The algorithm improves the atom screening process on the basis of OMP to acquire a higher operating speed and accuracy. The results show that the proposed algorithm solves the problem of harmonic source localization in the non-globally observable state of the system. It only needs a few measurements to obtain a favorable location effect with no limitation on the configuration scheme of measurement devices. Compared with the OMP and traditional LS method, it has higher practical application and excellent robustness.
Data availability statement
The original contributions presented in the study are included in the article/Supplementary Material: further inquiries can be directed to the corresponding author.
Author contributions
RY: conceptualization, methodology, simulation, and writing—original draft, reviewing, and editing. MY: writing—reviewing and editing. NT: supervision. RD and CL: discussion of the topic and data curation.
Funding
This study was supported by the science and technology project of State Grid Corporation of China (Project number SGSHSN00ZSJS2105432).
Conflict of interest
RD and CL are employed by the Shinan Power Supply Company and Shanghai Electric Power Company.
The remaining author declares that the research was conducted in the absence of any commercial or financial relationships that could be construed as a potential conflict of interest.
Publisher’s note
All claims expressed in this article are solely those of the authors and do not necessarily represent those of their affiliated organizations, or those of the publisher, the editors, and the reviewers. Any product that may be evaluated in this article, or claim that may be made by its manufacturer, is not guaranteed or endorsed by the publisher.
References
Bai, Z., Xiao, X., and Zhang, Y. (2017). Identification method of harmonic source considering harmonic apparent power. Automation Electr. Power Syst. 41 (08), 11–15. doi:10.7500/AEPS20160913008
Chen, D., Xiao, X., and Wang, X. (2019). A multiple harmonic sources localization method based on data analysis. Sci. Technol. Eng. 19 (30), 191–195. doi:10.3969/j.issn.1671-1815.2019.30.028
Donoho, D. L., Tsaig, Y., Drori, J. L., and Starck, J. L. (2012). Sparse solution of underdetermined systems of linear equations by stagewise orthogonal matching pursuit. IEEE Trans. Inf. Theory 58 (02), 1094–1121. doi:10.1109/tit.2011.2173241
Elphick, S., Gosbell, V., Smith, V., Perera, S., Ciufo, P., and Drury, G. (2017). Methods for harmonic analysis and reporting in future grid applications. IEEE Trans. Power Deliv. 32 (2), 989–995. doi:10.1109/tpwrd.2016.2586963
Fernandes, R. A. S., Oleskovicz, M., and da Silva, I. N. (2022). Harmonic source location and identification in radial distribution feeders: An approach based on particle swarm optimization algorithm. IEEE Trans. Industrial Inf. 18 (5), 3171–3179. doi:10.1109/tii.2021.3108681
Heydt, G. T. (1989). Identification of harmonic sources by a state estimation technique. IEEE Trans. Power Deliv. 4 (1), 569–576. doi:10.1109/61.19248
Ho, C. N. M., and Lam, C. -S. (2021). Editorial for the special issue on power quality conditioning in modern power grids integrated emerging power electronic systems. CPSS Trans. Power Electron. Appl. 6 (3), 191–192.
Hu, S., Li, Y., Xie, B., Chen, M., Zhang, Z., Luo, L., et al. (2016). A Y-D multifunction balance transformer-based power quality control system for single-phase power supply system. IEEE Trans. Industry Appl. 52 (2), 1–1279. doi:10.1109/tia.2015.2503389
Javaid, U., Freijedo, F. D., van der Merwe, W., and Dujic, D. (2020). Stability analysis of multi-port MVDC distribution networks for all-electric ships. IEEE J. Emerg. Sel. Top. Power Electron. 8 (2), 1164–1177. doi:10.1109/jestpe.2019.2926380
Ju, N., Zhao, H., Ji, X., et al. (2014). Analysis of port power distribution system harmonics and its control measures. Electr. Drive Autom. 36 (6). doi:10.3969/j.issn.1005-7277.2014.06.010
Kanellos, F. D. (2019). Multiagent-system-based operation scheduling of large ports’ power systems with emissions limitation. IEEE Syst. J. 13 (2), 1831–1840. doi:10.1109/jsyst.2018.2850970
Li, B. (2015). Study on harmonic source localization in distribution network considering three-phase model. Harbin, China: Harbin Institute of Technology.
Liao, H. (2007). Power system harmonic state estimation and observability analysis via sparsity maximization. IEEE Trans. Power Syst. 22 (1), 15–23. doi:10.1109/tpwrs.2006.887957
Needell, D., and Vershynin, R. (2010). Signal recovery from incomplete and inaccurate measurements via regularized orthogonal matching pursuit. IEEE J. Sel. Top. Signal Process. 4 (2), 310–316. doi:10.1109/jstsp.2010.2042412
Wang, F. (2013). Power quality evaluation and operating characteristics analysis of the load for the port grid. Anhui, China: Anhui University.
Wang, L., Pang, Y., Wong, M. -C., Xu, Q., Zhou, X., and He, Z. (2021). A new topology of three-port power hub converter with power quality compensation for remote area residential power supply. IEEE Trans. Industrial Electron. 68 (11), 10336–10348. doi:10.1109/tie.2020.3031448
Xiao, X., Hu, Y., Wang, Y., et al. (2021). Harmonic state estimation based on asynchronous power quality monitoring system. Proc. CSEE 41 (12), 4121–4132. doi:10.13334/j.0258-8013.pcsee.201072
Xu, Z. (2006). Harmonic state estimation of singular value decomposition-based and harmonic source location research. Chongqing, China: Chongqing university.
Keywords: port power system, power quality, harmonic source location, harmonic state estimation, stagewise regularized orthogonal matching pursuit
Citation: Yang R, Yu M, Tai N, Duan R and Lu C (2023) Harmonic source localization method for the port distribution system based on the stagewise regularized orthogonal matching pursuit algorithm. Front. Energy Res. 11:1097300. doi: 10.3389/fenrg.2023.1097300
Received: 13 November 2022; Accepted: 26 January 2023;
Published: 13 February 2023.
Edited by:
Fei Wang, Shanghai University, ChinaCopyright © 2023 Yang, Yu, Tai, Duan and Lu. This is an open-access article distributed under the terms of the Creative Commons Attribution License (CC BY). The use, distribution or reproduction in other forums is permitted, provided the original author(s) and the copyright owner(s) are credited and that the original publication in this journal is cited, in accordance with accepted academic practice. No use, distribution or reproduction is permitted which does not comply with these terms.
*Correspondence: Moduo Yu, Mzc5NDQwMjc4QHNqdHUuZWR1LmNu