 Yutao Lei
 Xuan Zhang
- School of Economics and Finance, South China University of Technology, Guangzhou, China
The design of China’s industrial carbon reduction policies is still in its early stages, so currently, comparing the effectiveness of various emission reduction policies can help China design emission reduction policies. This paper develops a dynamic stochastic general equilibrium (DSGE) model of China’s manufacturing industry and investigates the impact of innovation on environmental protection technology, the carbon emissions tax, and government emissions reduction expenditures on the output and carbon emissions reduction of China’s manufacturing industry. Unlike previous studies that examined one policy using a single model, by focusing on the differences between three shocks it is possible to make the policies more comparable, and the comparison is more convincing. The results indicate that updating environmental protection technology can promote the development of the manufacturing industry and reduce carbon emissions in the short term. Carbon emissions taxes have a negative effect on manufacturing output in the short term and a significant and lasting effect on the reduction of carbon emissions in the long term. The government’s emissions reduction expenditures have a positive effect on manufacturing output in the short term, but a non-significant negative effect in the long term. The Chinese government should take the lead in implementing carbon emissions tax policies in heavily polluting industries and regions while lowering but stabilizing emissions reduction expenditures.
1 Introduction
Global warming presents a major challenge for the global community. The Intergovernmental Panel on Climate Change (IPCC) has indicated that the Earth will have warmed by 1.5°C by around 2040, and carbon emissions must therefore be reduced significantly over the next 10 years to reach preindustrial levels by the end of the century. Since the beginning of the 21st century, China has emitted about one-half of the world’s carbon dioxide. In 2019, it emitted 10.285 billion tons, which is about 28% of total emissions globally. As the world’s largest developing country and the largest emitter of carbon dioxide, China is actively implementing climate change mitigation policies to achieve the “dual carbon” goals of peak emissions by 2030 and carbon neutrality by 2060.
Manufacturing is the second largest source of carbon emissions in China behind the energy generation industry (Khan et al., 2020), and its ability to reduce emissions is key to China’s success in achieving its dual carbon goals (C. Wang et al., 2020). From 2000 to 2019, manufacturing carbon emissions accounted for an average of 41.04% of China’s total carbon emissions. Seeking a balance between the output and carbon emissions reduction in the manufacturing industry is key to its sustainable development and also an important element in China achieving its “dual carbon” goals. At present, the design of China’s industrial carbon reduction policies is still in its early stages and mainly focused on the national level, there is no consensus on policy within the manufacturing industry and its various sectors. So currently, comparing the effectiveness of various emission reduction policies can help China design industrial carbon reduction policies.
In order to make the policies more comparable, and the comparison more convincing, this paper quantifies the policy effects of different carbon emissions reduction policies on output and carbon emissions reduction of manufacturing in the same economic environment, which can help policymakers to design carbon emissions reduction policies for China’s manufacturing sector. At the same time, since the output and carbon emissions of each sector of the manufacturing industry are different, designing different policy combinations for different sectors separately can facilitate carbon emissions reduction.
2 Literature review
2.1 Methods of environmental policy research
With the increasing attention paid to the climate globally, seeking the balance between carbon emissions reduction and output has become a hot topic, and there are multiple models and methods used to study the effects of carbon emissions policies (Y.-H. Liu et al., 2019). John and Pecchenino (1994) first used the overlapping generations (OLG) model to study the potential conflict between economic growth and environmental protection. Jouvet et al. (2005) extended the OLG model by analyzing the neutralizing effect of the carbon quota market on the externalities of environmental quality based on the optimal economic growth path. Angelopoulos et al., n.d. (2010) used a basic neoclassical growth model with pollutants as byproducts of production processes to compare public financial welfare and uncertainty under emissions taxes, emissions allowances, and the Kyoto Rules. Shen and Zhao (2022) solved a dynamic optimal carbon tax model based on welfare maximization under growth constraints based on a computable general equilibrium (CGE) model to compare the emissions-reducing effects and economic impacts of carbon taxes and trading. The CGE model emphasizes the analysis and modeling of the transmission mechanism, and the assumptions in the process are stricter (Nejati and Shah, 2023).
At the same time, the development of dynamic stochastic general equilibrium (DSGE) models have made it possible to study the optimal design of environmental policies and economic growth under more realistic economic conditions. DSGE models were first proposed by Kydland and Prescott (1982) and have gradually become one of the mainstream analytical tools used in macroeconomics. DSGE models have also been increasingly applied in the environmental field. Angelopoulos et al. (2013) and Heutel (2012) both explored the effects of technology shocks on the environment using DSGE models. These studies provide the basis for subsequent studies on the effects of environmental policies.
Among these methods, the DSGE model, which provides a method for studying the existence of multiple economic policies in a more realistic setting (Wang et al., 2019), is most suitable for the purposes of this paper.
There are wide divergences in the conclusions produced by DSGE models on the impacts of such policies. Existing studies lack comparative studies of multiple policies in the same model as well as those of heterogeneous manufacturers. The traditional homogeneity model ignores the heterogeneity of manufacturing industries, this paper incorporates three types of industry-specific shocks into DSGE, supplementing its application research in studying industrial policy combinations.
2.2 Carbon emissions reduction shocks in the DSGE model
In classical economic theory, it is usually believed that environmental governance has a negative effect on output (Bergquist et al., 2022; Liu et al., 2021). International empirical research often explores the traditional environmental Kuznets curve (EKC) hypothesis to demonstrate the inverted U-shaped relationship between the economy and the environment. Based on the data from 134 countries, (Wang et al., 2022), explored that as urbanization successively crosses the threshold, the positive effect of economic growth on carbon dioxide emissions in high-income countries diminishes. Based on the dataset of 208 countries, (Wang et al., 2023a), proved that the EKC hypothesis is validated when the effects of trade openness, human capital, renewable energy consumption, and natural resource rents are considered. There are also empirical studies on multiple factors affecting carbon emissions that have been studied simultaneously. (Li et al., 2021). Discussed the impacts of structural changes, economic growth, and energy intensity on per capita carbon emissions from the four aspects of energy, trade, society, and economy.
However, traditional empirical research mostly used existing data for empirical research, and policy design requires the prediction of policy effectiveness. The DSGE model can analyze the medium to long-term effects of policies and predict the results of policy implementation. In the context of the rapid economic development of China, how to effectively achieve the dual goals of sustainable economic growth and environmental quality improvement has become the primary concern (Shah et al., 2022). The existing research suggests that material reductions in carbon emissions can be achieved through the three main pathways of innovation in environmental protection technology, carbon emissions taxes, and emissions reduction expenditures. Some studies have employed DSGE models to analyze the correlation between these policies and carbon reduction. Tu and Wang (2022) applied a DSGE model to show that a structural carbon tax can balance the relationship between energy demand and economic growth in China, and green innovation technology can promote energy-saving enterprises while improving the industrial structure. Xu, Pan, et al. (2022) established a DSGE model of carbon taxes, which showed the response of emissions reduction of enterprises in a carbon tax scenario is contrary to that in a non-tax scenario in the context of a positive consumption shock. Niu et al. (2018) developed a DSGE model that included five sectors, household consumption, energy, government, final goods, and the environment to assess the response of China’s carbon emissions to environmental tax shocks. Argentiero et al. (2018) assessed the effectiveness of a comprehensive strategy for renewable energy sources in a DSGE model for the Euro area, which includes carbon taxes and subsidies. Chen et al. (2022) incorporated the central and local government structure into a DSGE model, and the results indicate that the local government biasing its fiscal expenditures toward environmental governance is beneficial for improving social welfare and the quality of the environment.
In China, most of the research on manufacturing emissions reduction focuses on a specific policy, such as the impact of carbon trading (Dai et al., 2018), or the environmental impact of industrial policies (Song and Zhou, 2021). However, different manufacturing sectors have different characteristics; some have serious high carbon issues, while others focus on output. A single policy cannot be applied to all manufacturing sectors. This paper studies policy combinations, which can effectively avoid the limitations of one policy’s impact. At the same time, existing literature mostly used existing data for empirical research, and policy design requires prediction of policy effectiveness. This paper uses the DSGE model for policy prediction, supplementing the research gap in policy combination and policy prediction.
2.3 Review and improvement
In summary, two main areas in the existing studies can be improved.
First, most of the existing studies examine one policy in one model rather than comparing different shocks by incorporating them into the same model assumptions. Thus, the effects of the policies cannot be directly compared because of the differences in model assumptions, which makes it difficult for policymakers to determine whether several policies can be implemented at the same time. To compare the effects of different shocks, this paper incorporates the main abatement factors into the same model allows for the comparison of the effects of different shocks.
Second, most existing studies base their models on the country as a whole. Since the actual carbon emissions and output of each manufacturing sector differ, models based on the entire economy do not simulate the differences between sectors. The reality is that carbon emissions reduction shocks are implemented sector by sector, not simply by a single policy, and thus testing the effect of one single policy is not aligned with reality. China is currently experiencing profound structural changes such as economic transformation and upgrading, and carbon emissions reduction policy formulation needs to consider the structural characteristics of individual industries and industry heterogeneity.
Based on the existing research, this paper makes innovations in the following two aspects. First, we creatively incorporate three industry-specific policies into the DSGE model to make the policies more comparable, and the comparison is more convincing. Second, we conduct a policy effect analysis on representative sectors to avoid the limitations of one policy’s impact.
This study can provide a reference for the simultaneous formulation of several carbon emissions reduction policies in the manufacturing sector in general and manufacturing subsectors in particular.
3 Methodology
In this paper, a DSGE model containing three types of carbon emissions reduction shocks in China’s manufacturing industry factors is constructed according to the classical Keynesian dynamic stochastic general equilibrium model. The model contains three factors: representative households, manufacturers, and government. The improvement of the model focuses on two aspects: One is to simultaneously incorporate three types of shocks into the model framework, supplementing the comparative research on the effects of the three policies in a unified social context. The second is to incorporate natural environmental conditions into the model and link the environmental parameters with the government and manufacturers, making the model settings more in line with the actual situation. That is, when households, governments, and manufacturers make decisions, they all consider the environment.
First, we introduce the three factors in the DSGE model.
In the DSGE model, the household factor represents people as a household unit model, and U, or household utility, is the satisfaction obtained by people as a household unit. Usually, environmental pollution has negative utility. The household utility is the sum of satisfaction from the consumption of manufacturing products and displeasure from increased carbon emissions.
Manufacturers use capital and labor to produce output and, in the process of doing so, create carbon dioxide. Carbon dioxide emissions are penalized with carbon taxes, and manufacturers can reduce their carbon emissions by improving their environmental technology.
Government expenditures come from the carbon tax imposed on manufacturers to subsidize household displeasure due to carbon emissions and to directly address the environmental problems caused by carbon emissions.
All three factors are in the same natural environment, and the carbon dioxide in the environment is the stock of carbon emissions less those which are reduced by environmental technologies and government policy.
The following outlines the mathematical expression of the above model.
3.1 Economic setting
3.1.1 Representative households
Consider an indefinite production economy in which countless homogeneous households are evenly distributed on the interval and provide labor to society and obtain income. They buy goods from final product manufacturers and make deposits with financial institutions. In addition to consumption and labor, factors that affect household utility also include environmental quality and carbon emissions. Representative households plan their consumption and labor supply in each period to maximize their utility, and the utility function takes the form of the Constant Relative Risk Aversion (CRRA) utility:
where
Representative households face the following constraints:
where
The right side of Eq. 3 represents the marginal utility of the household’s consumption in period t. Eq. 4 is the Euler equation of consumption and labor, which indicates that the marginal loss caused by household labor in period t is equal to the marginal utility generated by its consumption. Eq. 5 reflects the optimal plan for household consumption (i.e., the marginal utility of consumption in period t is equal to the discounted value of utility brought about by consumption in period t + 1).
3.1.2 Manufacturers
In a perfectly competitive market, manufacturers are all homogeneous, and each manufacturer has the same level of technical sophistication. Representative manufacturers produce their own products by renting private capital and labor. It is assumed that the manufacturer adopts the Cobb–Douglas production function given by:
where
where
It is assumed that carbon emissions are mainly caused by the production activities of the representative manufacturers, and the carbon emissions in each period are positively correlated with the
where
where
To limit the carbon emissions of manufacturers, a carbon emissions tax is levied based on actual carbon emissions. Therefore, the carbon emissions tax paid by manufacturers in period t is
where
Manufacturers’ capital accumulation equation is given by:
By solving this optimization problem, we can obtain the optimal first-order conditions for
3.1.3 Government
The government’s fiscal expenditures come from the carbon tax charged to manufacturers. Financial expenditures are used in two respects:
3.1.4 Environment
Based on the model proposed by Angelopoulos et al. (2010) and Jouvet et al. (2005), we assume that environmental quality is the sum of carbon stock and the governance effect:
where h represents the normal decomposition rate of carbon emissions by the environment and
where
3.2 Model equilibrium and market clearing
When the market clears, we have the following equilibrium conditions:
The model in this paper contains four exogenous shocks
4 Parameter calibration and estimation
By selecting static parameters and using manufacturing production as external observation data, this research applies the DSGE method in China’s manufacturing industry’s carbon emission reduction. Table 1 shows the specific parameter estimates, the static parameters are combined with the actual selection in China, and refer to the previous studies (Fan et al., 2011; Gerali et al., 2010; Hansen, 1985; Smets and Wouters, 2007; Zhang et al., 2020).
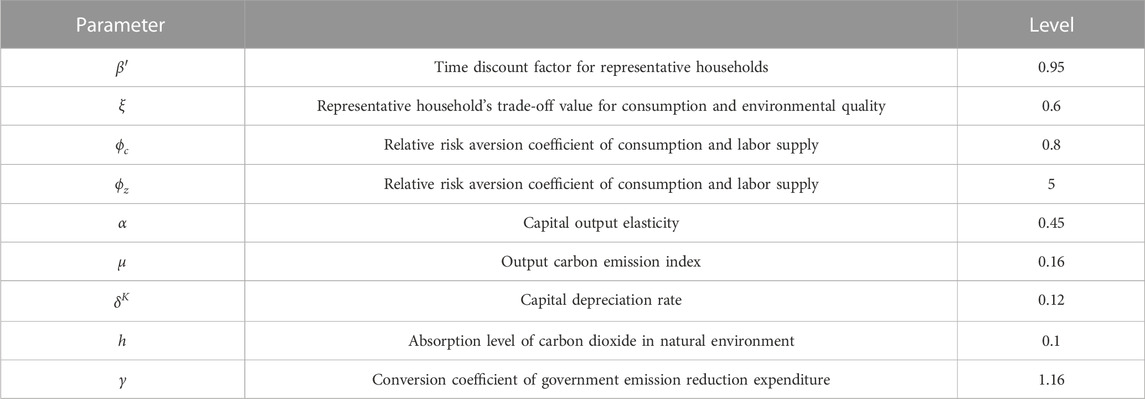
TABLE 1. Calibration results of static parameters combined with the actual situation.
We select the sales output value and consumption data of Chinese manufacturing from 1979 to 2020 as external observation samples and use MATLAB to estimate Bayesian dynamic parameters.
Table 2 shows the determination of the Bayesian estimation of dynamic parameters according to the existing literature (Gerali et al., 2010; Smets and Wouters, n.d., 2007).
(1) Determination of a priori means. Based on the estimates of existing literature and the characteristics of impact sources, both the priori mean of the first-order autoregressive coefficients of production technology shock and environmental protection technology shock are set to 0.7, and both the priori mean of the first-order autoregressive coefficients of carbon emission tax shock and the government’s emission reduction expenditure shock are set to 0.5. The prior mean value of the random perturbation term of the shocks is all set to 0.5.
(2) Determination of a priori distribution. According to previous studies on the DSGE model, the first-order autoregressive parameters all follow the Beta distribution, and the fluctuation parameters follow the more dispersed and smoother inverse gamma (Inv. Gamma) distribution.
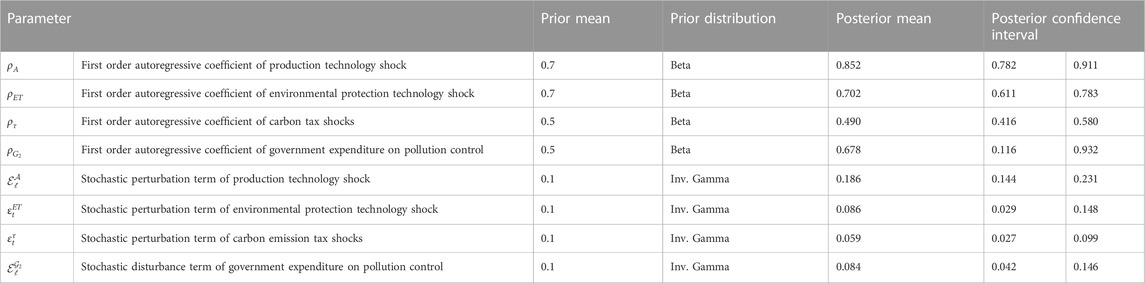
TABLE 2. Bayesian estimation of dynamic parameters.
5 Numerical simulation analysis
The model is solved using Matlab software and processed by Dynare. By simulating shocks to manufacturers’ environmental protection technology, carbon emissions taxes, and government emissions reduction expenditures, we determine the impact of these three types of shocks on economic output, household consumption, capital stock, pollution control input, and pollution stock.
5.1 Manufacturer’s environmental technology shock
Figure 1 shows the impulse response results of the output, consumption, capital stock, investment, employment, carbon emissions, and environmental quality under the 1% positive environmental protection technology shock.
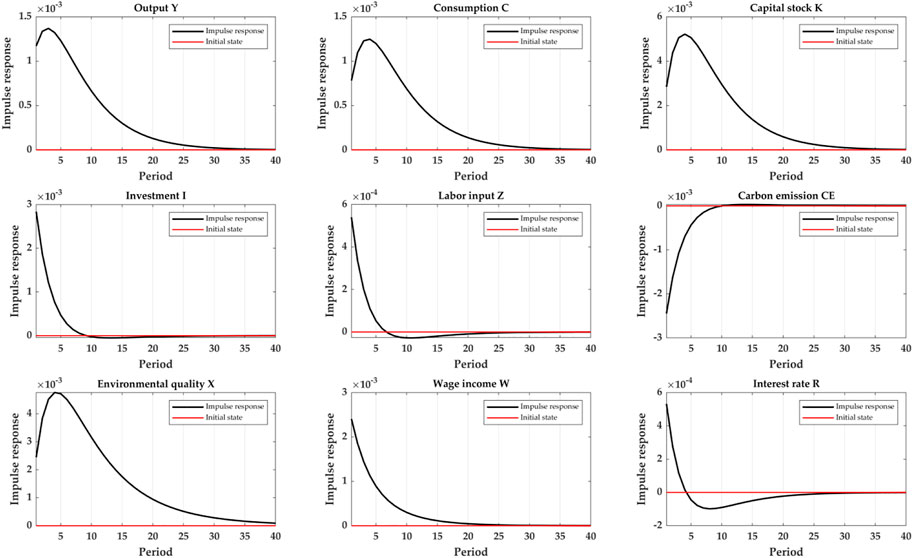
FIGURE 1. Environmental protection technology shock.
As shown in Figure 1, the response to the shock occurs: 1) The output, consumption, and capital stock of the manufacturing immediately deviate from the initial state immediately after the shock occurs, and reach the peak of positive deviation in the 3rd, 4th, and 4th periods respectively, and then slowly return to the initial state around the 30th period. 2) Both investment and employment reach the peak of positive deviation in the first period, then gradually return to the initial state around the 20th period. 3) Carbon emissions reach the peak of negative deviation in the first period, then gradually return to the initial state around the 10th period. And the environmental quality reaches the peak of positive deviation in the fifth period, and then slowly returns to the initial state around the 40th period.
The impulse response under the impact of manufacturers’ environmental protection technology shows that, in the short term, the renewal of environmental protection technology of manufacturing manufacturers has a positive effect on output, investment consumption, employment, and carbon emission reduction, in the medium and long term: output, investment, consumption, and employment will return to the equilibrium level, and the effect of carbon emission reduction will be sustainable.
The renewal of the environmental protection technology of manufacturing manufacturers has a positive effect on output, investment, and employment in the short term, however, in general, this impact on output is small. This is reflected in the fact that product updates and efficiency improvements brought about by new technologies, as well as the introduction and training of new skilled workers, can bring profits to the company in the short term. However, the cost of environmental protection technology updates is also increasing, which balances the increase in output brought about by the basic update. As a result, this offset makes the impact of environmental protection technology shock non-significant.
Environmental technology updates can also boost investment and employment, while residents’ incomes increase, and consumption continues to rise. In the long term, due to the popularity of technology and product diversification caused by competition in the same industry, corporate profits return.
In the medium and long term, employment falls due to workers generally mastering new technologies, and environmental protection technology updates drive corporate profitability to rise. At the same time, the improvement of environmental protection technology also causes a significant reduction in carbon emissions and a significant improvement in environmental quality. However, the gradual increase in carbon emissions and environmental quality gradually approaches the initial state, which indicates that carbon emissions reduction in manufacturing is not a one-time simple technical update, and manufacturers need continuous technical updates and innovation to achieve continuous carbon emission reduction. Our results are also in line with the research of Chan (2019). They believe that firms are not willing to invest more in abatement technology as long as the capacity target is satisfied. With a fall in output, the firms can easily meet the capacity target with the same abatement effort and investment. To cut costs, firms would reduce abatement effort and investment simultaneously.
In terms of policy recommendations, the government should encourage manufacturers to increase the research and development of environmental protection technology and improve the overall environmental protection technology level because the update of environmental protection technology can significantly improve the quality of the ecological environment in a short time, and has a positive promotion effect on the output, consumption, and capital stock. At the same time, as the continuous effect of environmental protection technology in the medium and long term is weaker than that of the short-term, the government should also encourage manufacturers to develop environmental protection technology to promote the long-term development of manufacturing and the long-term improvement of environmental quality.
5.2 Carbon emissions tax shock
Figure 2 shows the impulse response results of the output, consumption, capital stock, investment, employment, carbon emissions, and environmental quality under the 1% positive carbon emissions tax shock.
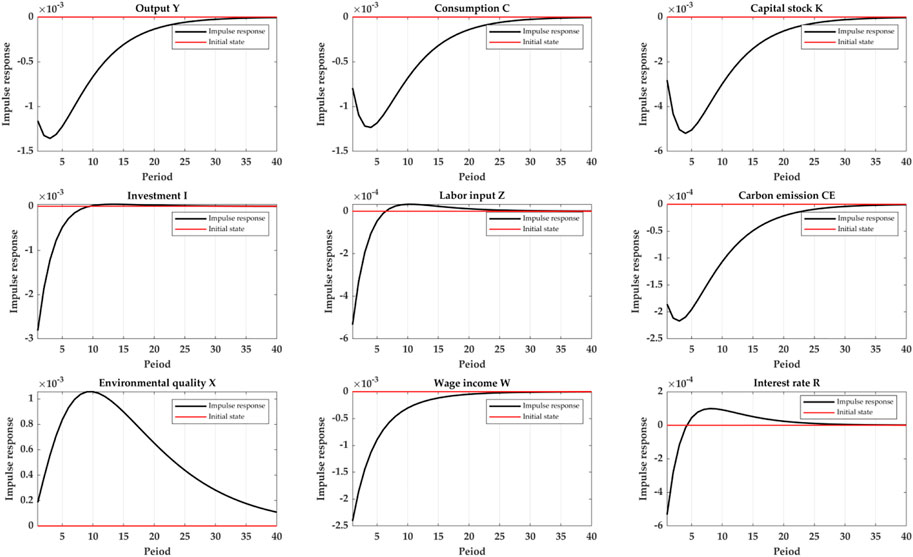
FIGURE 2. Carbon emissions tax shock.
It is different from the manufacturer’s environmental technology shock, in the short term, the carbon emission tax has a negative effect on output, investment, and employment, but the effect of carbon emission reduction is similar to that of the manufacturer’s environmental technology shock, in the medium and long term, the carbon emission tax causes a significant effect on the improvement of environmental quality.
As shown in Figure 2, after the shock occurs: 1) Output, consumption, and the capital stock immediately deviate negatively from the initial state immediately after the impact, then rebound rapidly, and reach the peak of negative deviation in the 3rd, 4th, and 4th periods, respectively, and then slowly return to the initial state around the 30th period. 2) Both investment and employment reach the peak of negative deviations in the first period, and then quickly return. They become positive deviations in the 10th and 7th periods, respectively, and return to the initial state around the 20th period. 3) The carbon emissions reach the peak of negative deviation in the third period, then gradually return to the initial state around the 30th period, and the environmental quality gradually deviates from the initial state after the impact, reaching a positive in the 10th period. However, it hasn’t returned to its initial state during the observation period, and the long-term emission reduction effect is obvious.
The impulse response under the shock of the carbon emission tax shows that the carbon emission tax has a negative effect on output, investment, and employment in the short term, which is reflected in the increase in the production cost of enterprises in the short term caused by the carbon emission tax. As a result, short-term corporate profits fall and unemployment occurs, which leads to negative effects on consumption. Since the carbon emission tax is common to manufacturers in various industries in manufacturing, all manufacturers in the same industry will quickly adapt to this tax after this tax expenditure occurs, driving investment and employment to rebound. At the same time, the carbon emission tax causes a significant decrease in carbon emissions, a significant improvement in environmental quality, and a significant effect on the improvement of environmental quality in the medium and long term.
In the policy implementation, though it can significantly improve the environmental quality in the short and medium even long term, considering the carbon emission tax is quickly allocated to the production cost that affects the production, it will have a certain risk on the output of the manufacturing and the consumption of residents. Therefore, it is inappropriate to fully implement carbon taxes in all industries in manufacturing. To give full play to the policy effects of the carbon tax system, we should first start with high-carbon emission industries such as aviation and power, and expand to other production sectors after accumulating enough experience. In addition, differentiated tax rates should be implemented for different regional economic development levels, industrial structures, and regional carbon emission reduction targets to minimize the negative impact on the development of manufacturing industries. In the long run, the government should still encourage enterprises to focus on how to improve production efficiency and continuously update environmental protection technologies.
5.3 Government’s emission reduction expenditure shock
Figure 3 shows the impulse response of output, consumption, capital stock, investment, employment, carbon emissions, and environmental quality under the 1% positive government’s emission reduction expenditure shock.
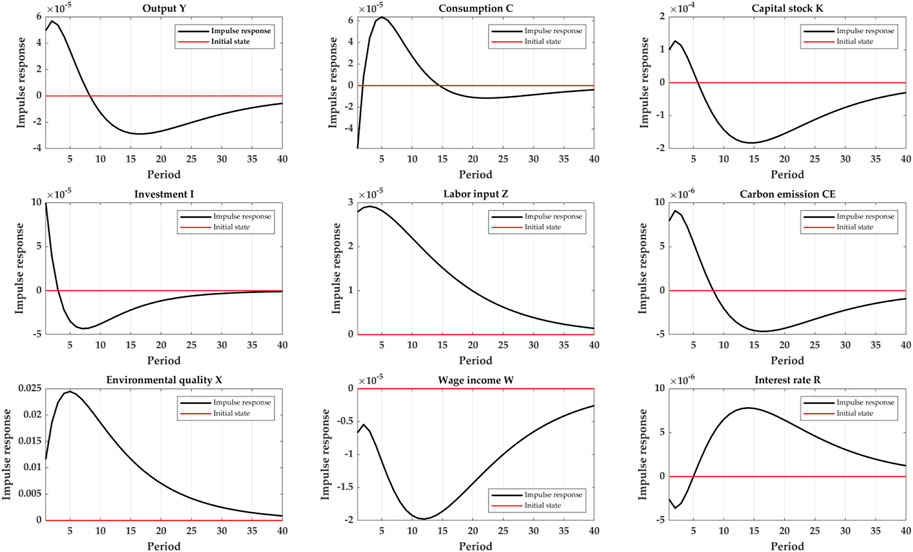
FIGURE 3. Emission reduction expenditure shock.
In the short term, government emission reduction expenditures have a positive effect on output, investment, and consumption, but the positive effect lasts for a short time. In the medium and long term, government emission reduction expenditures are unfavorable to output, investment, consumption, and employment. In the long term, government emission reduction expenditures can also effectively reduce carbon emissions. Compared with the shock of the manufacturer’s environmental technology and the carbon emission tax, the long-term carbon emission reduction effect of the government emission reduction expenditures is the best.
As shown in Figure 3, after the shock occurs: 1) The output and capital stock deviate from the initial state immediately in the current period, both reach the peak of the positive deviation in the 2nd period, then return quickly and become negatively deviated from the initial state in the 9th and 6th period respectively. They finally reach the peak of negative deviations in the 17th and 14th periods respectively. The long-term performance is negative deviation but gradually close to the initial state. Consumption immediately deviates negatively from the initial state in the current period, then rebounds rapidly, and reaches the peak of positive deviation in the 5th period, and becomes negatively deviated from the initial state in the 15th period but always closes to the initial state. 2) The investment deviates from the initial state immediately in the current period, then rebounds rapidly, and reaches the peak of negative deviation in the 7th period, then slowly returns to the initial state around the 30th period. Employment reaches the peak of positive deviation in the third period, and then gradually returns, but does not return to the initial state. 3) The carbon emissions deviate from the initial state immediately in the current period, and reach the peak of the positive deviation in the 2nd period, then quickly returned, changed to the negative deviation from the initial state, and reach the peak of the negative deviation in the 9th period, then slowly returns, but doesn’t return to the initial state during the observation period. The environmental quality reaches the peak of the positive deviation in the 5th period, and then slowly returns to the initial state near the end of the observation period.
The impulse response under the shock of government emission reduction expenditures shows that government emission reduction expenditures have a positive effect on output, investment, and consumption in the short term. This reflects that the government has taken measures to solve part of the carbon emissions problems for manufacturers, which has a free-rider effect on the manufacturers in the short term. However, in the long run, government subsidies for emission reduction will discourage enterprises to improve efficiency and carry out technological innovations in carbon emission reduction. Therefore, the effective implementation of carbon emission reductions will not achieve the expected goals. The jobs provided by government emission reduction expenditures make government emission reduction expenditures have a long-term effect on employment. At the same time, the government’s carbon emission reduction expenditure has significantly reduced carbon emissions for a long time, and the environmental quality has been significantly improved, i.e., the government’s emission reduction expenditure has a long-term effect on carbon emission reduction. Lang and Yang (2019) also proved that capacity utilization is in essence improved by vigorous government support for infrastructure construction, which ultimately benefits continuously stable social sustainability in the long term.
Although government emissions reduction expenditures consume a certain amount of financial funds, in the medium and long term, they can improve environmental quality to the greatest extent and have a significant effect on long-term employment. However, to avoid fluctuations in economic growth and employment, it is necessary to maintain continuity and stability in pollution control expenditures.
5.4 Policy combinations analysis
After comparing the three shock results above, we make the following observations. 1) Improving environmental technology can significantly reduce carbon emissions and rapidly increase output in the short term; however, in the long term, dispersing the technology throughout the whole society is not sustainable for reducing carbon emissions while increasing output. 2) Carbon taxes can significantly reduce carbon emissions and improve environmental quality in the long term but significantly reduce output in the short term. 3) Increasing government expenditures on emissions reduction has less of an impact on carbon emissions reduction in the short term, but can effectively reduce them in the medium to long term.
In contrast to other existing studies, in terms of environmental technology improvement, Tu and Wang (2022) and Niu et al. (2018) argued that green technology innovation can effectively reduce carbon emissions. In terms of carbon tax, Chan (2019) argued that carbon tax is the best policy because it can significantly reduce carbon emissions in the short term, which is consistent with this paper, but he did not consider the short-term strike on output. In terms of government expenditures on emission reduction, Lang and Yang (2019) concurred with the findings of this paper that government expenditures can achieve long-term emission reductions. Fan et al. (2011) believed that firms are more receptive to government expenditures on emission reduction, but this will reduce firms’ motivation to reduce carbon emissions, so government expenditures should be used as a secondary policy rather than a primary policy. Q. Wang et al. (2023b) studied the government’s intervention in income inequality and found that economic growth significantly increases carbon emissions during periods of low-income inequality, but in the period of high-income inequality, economic growth inhibits the increase of carbon emissions. This also indicated that the effectiveness of government intervention is uncertain and should be used as an auxiliary policy. Shen and Zhao (2022) believed that the mixed policy is more favorable to China’s macro economy than a single carbon emission reduction policy and is conducive to improving people’s welfare. This paper makes a more convincing comparison of the effects of these three shocks on the manufacturing industry in one model setting.
Combining the results of this paper and existing research, carbon taxes can reduce carbon emissions in the long term and output in the short term. Government expenditures on emissions reduction can increase output in the short term and reduce output in the long term while reducing carbon emissions from the short to the long term. Innovation in environmental technology increases output in the short term and cannot reduce carbon emissions in the long term. These three kinds of policy effects can be complementary. Therefore, to achieve a balance between output and carbon emissions reduction by combining the quantitative effects of the three types of shocks, manufacturing industry sectors with higher emissions should be charged higher carbon emissions taxes and government spending on emissions reduction should be stable. At the same time, continuous support for technological innovation in manufacturing enterprises will theoretically achieve sustainable emissions reduction based on stabilized output.
6 Conclusions and discussion
6.1 Conclusions and policy implications
Motivated by this view, this paper analyses the impact of different carbon emission policies on the development of manufacturing industries in China within the theoretical framework of the DSGE model. The research expands the application of the DSGE model in the design of industrial emission reduction policy combinations, avoiding the limitations of one single policy, which can help the government design policy combinations in the current primary stage of China’s emission reduction policies.
The results show the following observations. 1) In the short term, innovation in environmental protection technology can effectively reduce carbon emissions and improve environmental quality while having a positive effect on output, household consumption, and capital stock. However, in the medium and long term, environmental technology innovation has little lasting impact on manufacturing output and environmental quality, which indicates that innovation and environmental technology innovation requires long-term strategies. 2) Carbon emissions taxes have a significant inhibitory effect on carbon emissions in the long term, but a negative effect on output and household consumption in the short term. The long-term impact of the manufacturing industry on output and consumption is relatively small, but the effect of improving environmental quality is obvious and lasting. 3) Government emissions reduction expenditures have a positive effect on manufacturing output, consumption, and capital stock in the short term, but have a certain negative effect on the long-term development of manufacturing. They also have significant effects on reducing carbon emissions from the short to the long term.
To achieve the dual goals of manufacturing industry development and environmental protection, we must rely on rational carbon emissions policies. Based on our findings, we propose the following policy recommendations. 1) Any single policy cannot balance output and emission reduction, and only an appropriate combination of policies can combine the respective effects of different policies. 2) The implementation of environmental technology incentives should be continuous. Since environmental technology innovation can significantly improve environmental quality while increasing output, consumption, and capital stock, the government should encourage manufacturers to increase their research and development expenditures on environmental protection technology. At the same time, because the long-term effects of environmental technology are not obvious, the government’s support should be continuous such that it promotes the long-term development of manufacturing and long-term emissions reduction. 3) High carbon emission sectors should first adopt carbon tax policy. Carbon taxes can quickly feed back into production costs in the short term to influence output and in the medium-to-long term to encourage enterprises to change their production methods and business strategy, which can significantly improve ecological and environmental quality in both the short and long term. However, considering that the tax will generate risks to manufacturing output and household consumption, it is not advisable to implement a carbon tax in all manufacturing sectors. Such an approach should begin with high-carbon emissions industries such as transportation and petrochemicals, and then expand to other sectors after sufficient experience is gained. In addition, differential tax rates should be implemented in different regions according to their economic development, industrial structure, and carbon emissions reduction targets to minimize their negative impact on manufacturing output. 4) Government expenditures on emission reduction should emphasize sustainability and stability. Although government expenditures on emissions reduction consume part of the financial budget, they can improve environmental quality in the medium and long term. Government emissions reduction expenditures have an obvious long-term effect on employment. However, to avoid fluctuations in output, the sustainability of emissions reduction expenditures should be maintained, which is more conducive to the growth of output and the stability of the employment market.
In summary, to optimize the dual goals of manufacturing development and environmental protection, and considering the different effects of three types of carbon emissions reduction policies, the government should take the lead in rolling out and implementing carbon emissions tax policies for heavily polluting industries and regions while approving stable government emissions reduction expenditures to achieve rapid but sustainable carbon emissions reduction effects. The resulting tax revenues can be used to support technological transformation and improvement of environmental protection equipment to modernize manufacturing, improve resource utilization efficiency, and reduce carbon emissions.
6.2 Discussion and limitation
The construction of our DSGE model is based on the manufacturing industry in China and includes the external shocks of manufacturers’ innovation in environmental protection technology, carbon emissions taxes, and government emissions reduction expenditures. However, DSGE models are complicated. While considering the policy impacts, we ignore certain factors, such as foreign trade, resident consumption tax, and manufacturer output tax, to highlight the influence of carbon emissions reduction policy. Moreover, the parameters in the models are selected in accordance with China’s context, the parameters of which will change dynamically in response to the social environment changes, and thus we will need to reset these parameters in future research. Our model does not discuss each manufacturing subsector, so micro models and enterprise data can be used to identify the emissions reduction activities of manufacturers in future research. In addition, the manufacturing industry is closely related to other industries, and thus the development of other industries may also have an impact on its carbon emissions and output, the analysis of which requires more complex model settings. Also, the data during the COVID-19 times has not been updated for now, some parameters about COVID-19 might be set in the DSGE model after the data is updated. These are some of the further directions we highlight and will discuss in depth in future research.
Data availability statement
The original contributions presented in the study are included in the article/supplementary materials, further inquiries can be directed to the corresponding author.
Author contributions
All authors have made direct contributions to the work. YL: conceptualization and writing–reviewing and editing. XZ: writing–original draft preparation and investigation. CY: critical revisions. WP: conceptualization, resources, and supervision. All authors contributed to the article and approved the submitted version.
Funding
We appreciatively acknowledge the support of the program entrusted by Guangdong Natural Science Foundation (2022A1515010672), and the Fundamental Research Funds for the Central Universities (ZDPY202208).
Conflict of interest
The authors declare that the research was conducted in the absence of any commercial or financial relationships that could be construed as a potential conflict of interest.
Publisher’s note
All claims expressed in this article are solely those of the authors and do not necessarily represent those of their affiliated organizations, or those of the publisher, the editors and the reviewers. Any product that may be evaluated in this article, or claim that may be made by its manufacturer, is not guaranteed or endorsed by the publisher.
References
Angelopoulos, K., Economides, G., and Philippopoulos, A. (2013). First-and second-best allocations under economic and environmental uncertainty. Int. Tax Public Finance 20 (3), 360–380. doi:10.1007/s10797-012-9234-z
Angelopoulos, K., Economides, G., and Philippopoulos, A. (2010). What is the best environmental policy? Taxes, permits and rules under economic and environmental uncertainty. 36.
Annicchiarico, B., and Di Dio, F. (2015). Environmental policy and macroeconomic dynamics in a new Keynesian model. J. Environ. Econ. Manag. 69, 1–21. doi:10.1016/j.jeem.2014.10.002
Argentiero, A., Bollino, C. A., Micheli, S., and Zopounidis, C. (2018). Renewable energy sources policies in a Bayesian DSGE model. Renew. Energy 120, 60–68. doi:10.1016/j.renene.2017.12.057
Bergquist, M., Nilsson, A., Harring, N., and Jagers, S. C. (2022). Meta-analyses of fifteen determinants of public opinion about climate change taxes and laws. Nat. Clim. Change 12 (3), 235–240. doi:10.1038/s41558-022-01297-6
Chan, Y. T. (2019). The environmental impacts and optimal environmental policies of macroeconomic uncertainty shocks: A dynamic model approach. Sustainability 11 (18), 4993. doi:10.3390/su11184993
Chen, S., Liu, X., and Lu, C. (2022). Fiscal decentralization, local government behavior, and macroeconomic effects of environmental policy. Sustainability 14 (17), 11069. doi:10.3390/su141711069
Dai, Y., Li, N., Gu, R., and Zhu, X. (2018). Can China’s carbon emissions trading rights mechanism transform its manufacturing industry? Based on the perspective of enterprise behavior. Sustainability 10 (7), 2421. doi:10.3390/su10072421
Fan, L., Shiwang, C., and Wei, Z. (2011). Tax policy tropism of Chinese enterprises’ energy conservation and pollution reduction: Evidence from shandong Province. Energy Procedia 5, 2468–2473. doi:10.1016/j.egypro.2011.03.424
Gerali, A., Neri, S., Sessa, L., and Signoretti, F. M. (2010). Credit and banking in a DSGE model of the Euro area. J. Money, Credit Bank. 42, 107–141. doi:10.1111/j.1538-4616.2010.00331.x
Hansen, G. D. (1985). Indivisible labor and the business cycle. J. Monetary Econ. 16, 309–327. doi:10.1016/0304-3932(85)90039-X
Heutel, G. (2012). How should environmental policy respond to business cycles? Optimal policy under persistent productivity shocks. Rev. Econ. Dyn. 15 (2), 244–264. doi:10.1016/j.red.2011.05.002
John, A., and Pecchenino, R. (1994). An overlapping generations model of growth and the environment. Econ. J. 104, 1393. doi:10.2307/2235455
Jouvet, P.-A., Michel, P., and Rotillon, G. (2005). Optimal growth with pollution: How to use pollution permits? J. Econ. Dyn. Control 29 (9), 1597–1609. doi:10.1016/j.jedc.2004.09.004
Khan, A. M., Jamil, M., Mia, M., He, N., Zhao, W., and Gong, L. (2020). Sustainability-based performance evaluation of hybrid nanofluid assisted machining. J. Clean. Prod. 257, 120541. doi:10.1016/j.jclepro.2020.120541
Kydland, F. E., and Prescott, E. C. (1982). Time to build and aggregate fluctuations. Econometrica 50 (6), 1345. doi:10.2307/1913386
Lang, Y., and Yang, Q. (2019). Does public infrastructure breed consumption downgrade and overcapacity in China? A DSGE approach on macroeconomic effects. Sustainability 11 (3), 831. doi:10.3390/su11030831
Li, R., Wang, Q., Liu, Y., and Jiang, R. (2021). Per-capita carbon emissions in 147 countries: The effect of economic, energy, social, and trade structural changes. Sustain. Prod. Consum. 27, 1149–1164. doi:10.1016/j.spc.2021.02.031
Liu, W., Li, Y., Liu, T., Liu, M., and Wei, H. (2021). How to promote low-carbon economic development? A comprehensive assessment of carbon tax policy in China. Int. J. Environ. Res. Public Health 18 (20), 10699. doi:10.3390/ijerph182010699
Liu, Y.-H., Liao, W.-Y., Li, L., Huang, Y.-T., Xu, W.-J., and Zeng, X.-L. (2019). Reduction measures for air pollutants and greenhouse gas in the transportation sector: A cost-benefit analysis. J. Clean. Prod. 207, 1023–1032. doi:10.1016/j.jclepro.2018.10.094
Nejati, M., and Shah, M. I. (2023). How does ICT trade shape environmental impacts across the north-south regions? Intra-Regional and inter-regional perspective from dynamic CGE model. Technol. Forecast. Soc. Change 186, 122168. doi:10.1016/j.techfore.2022.122168
Niu, T., Yao, X., Shao, S., Li, D., and Wang, W. (2018). Environmental tax shocks and carbon emissions: An estimated DSGE model. Struct. Change Econ. Dyn. 47, 9–17. doi:10.1016/j.strueco.2018.06.005
Shah, M. I., AbdulKareem, H. K. K., Ishola, B. D., and Abbas, S. (2022). The roles of energy, natural resources, agriculture and regional integration on CO2 emissions in selected countries of ASEAN: Does political constraint matter? Environ. Sci. Pollut. Res. 30, 26063–26077. doi:10.1007/s11356-022-23871-3
Shen, J., and Zhao, C. (2022). Carbon trading or carbon tax? A computable general equilibrium–based study of carbon emission reduction policy in China. Front. Energy Res. 10, 906847. doi:10.3389/fenrg.2022.906847
Smets, F., and Wouters, R. (2007). Shocks and frictions in us business cycles: A bayesian DSGE approach. Am. Econ. Rev. 97, 586–606. doi:10.1257/aer.97.3.586
Song, L., and Zhou, X. (2021). How does industrial policy affect manufacturing carbon emission? Evidence from Chinese provincial sub-sectoral data. Environ. Sci. Pollut. Res. 28 (43), 61608–61622. doi:10.1007/s11356-021-15107-7
Tu, Q., and Wang, Y. (2022). Analysis of the synergistic effect of carbon taxes and clean energy subsidies: AN enterprise-heterogeneity e-dsge model approach. Clim. Change Econ. 13 (01), 2240012. doi:10.1142/S2010007822400127
Wang, C., Guo, Y., Shao, S., Fan, M., and Chen, S. (2020). Regional carbon imbalance within China: An application of the Kaya-Zenga index. J. Environ. Manag. 262, 110378. doi:10.1016/j.jenvman.2020.110378
Wang, Q., Wang, X., and Li, R. (2022). Does urbanization redefine the environmental kuznets curve? An empirical analysis of 134 countries. Sustain. Cities Soc. 76, 103382. doi:10.1016/j.scs.2021.103382
Wang, Q., Yang, T., and Li, R. (2023a). Does income inequality reshape the environmental kuznets curve (EKC) hypothesis? A nonlinear panel data analysis. Environ. Res. 216, 114575. doi:10.1016/j.envres.2022.114575
Wang, Q., Zhang, F., and Li, R. (2023b). Revisiting the environmental kuznets curve hypothesis in 208 counties: The roles of trade openness, human capital, renewable energy and natural resource rent. Environ. Res. 216, 114637. doi:10.1016/j.envres.2022.114637
Wang, W., Zhou, C., and Li, X. (2019). Carbon reduction in a supply chain via dynamic carbon emission quotas. J. Clean. Prod. 240, 118244. doi:10.1016/j.jclepro.2019.118244
Xu, H., Pan, X., and Lu, Y. (2022). The emission abatement of enterprises in China: A bayesian DSGE approach under carbon tax scenarios. Int. J. Glob. Warming 27 (2), 173–192. doi:10.1504/IJGW.2022.123280
Keywords: carbon emission reduction policy, China’s manufacturing, dynamic stochastic general equilibrium (DSGE), policy combinations, policy impact
Citation: Lei Y, Zhang X, Yao C and Peng W (2023) Redesigning carbon emissions reduction policies for China’s manufacturing industry: a dynamic stochastic general equilibrium approach. Front. Energy Res. 11:1094700. doi: 10.3389/fenrg.2023.1094700
Received: 10 November 2022; Accepted: 28 April 2023;
Published: 10 May 2023.
Edited by:
Shiwei Yu, China University of Geosciences Wuhan, ChinaReviewed by:
Xiangyun Gao, China University of Geosciences, ChinaQiang Wang, China University of Petroleum, Huadong, China
Copyright © 2023 Lei, Zhang, Yao and Peng. This is an open-access article distributed under the terms of the Creative Commons Attribution License (CC BY). The use, distribution or reproduction in other forums is permitted, provided the original author(s) and the copyright owner(s) are credited and that the original publication in this journal is cited, in accordance with accepted academic practice. No use, distribution or reproduction is permitted which does not comply with these terms.
*Correspondence: Xuan Zhang, eHpoYW5nX3NlcEAxNjMuY29t