 Dawei Duan
 Hongzhong Ma1
95% of researchers rate our articles as excellent or good
Learn more about the work of our research integrity team to safeguard the quality of each article we publish.
Find out more
ORIGINAL RESEARCH article
Front. Energy Res. , 26 January 2023
Sec. Process and Energy Systems Engineering
Volume 11 - 2023 | https://doi.org/10.3389/fenrg.2023.1088549
Accurate quantitative diagnosis of free-conducting particle faults plays an important role in improving the reliability of the gas insulated line (GIL) system. However, the existing fault diagnosis methods cannot accurately identify the free-conducting particle faults with different quantities and sizes. Motivated by this, this paper proposes a novel fault diagnosis method based on vibration signals, which integrates variational mode decomposition (VMD), self-adapting whale optimization algorithm-multiscale permutation entropy (SAWOA-MPE), and deep forest (DF). First, the raw vibration signals of free-conducting particle faults are decomposed via VMD, and the decomposed signals are reconstructed based on the correlation degree. Afterwards, SAWOA is employed to optimize the critical parameters of MPE, and the optimized MPE is further utilized to extract the fault features of the reconstructed signals. Finally, the extracted feature vectors are trained and tested to construct a valid DF classification model that identifies the free-conducting particle faults. The experimental results indicate that the identification accuracy of the proposed method can reach 99.5%. Moreover, comparative tests based on various feature vector extraction methods and classification models further validate the superiority of the proposed method.
Nowadays, with the increasing quantity of new energy vehicles and 5G base stations (Guo et al., 2022; Li et al., 2022), the contradiction between the demand for power grid expansion and the rising cost of urban land is intensified. GIL possesses the characteristics of high operational stability, low environmental impact and large transmission capacity, which make it as a reliable alternative to overhead lines and electric cables wherever the geological environment is limited (Qiao et al., 2021; Li et al., 2022). However, in a GIL system, free-conducting particles are inevitably generated during the production, assembly, and operation of GIL, which is considered to be one of the direct causes of GIL accidents (Huang et al., 2020; Wang et al., 2021). Numerous reports have demonstrated that the free-conducting particles can significantly reduce the insulation strength of GIL and eventually trigger GIL complete failures (Gao et al., 2020; Gao et al., 2022). Therefore, reliable and accurate diagnosis of free-conducting particles is of great importance for the safe operation of the GIL.
The study of fault characteristics is the basis of fault diagnosis methods. Wu et al. (2022) analyzed the motion characteristics of different sizes of free-conducting particles in AC GIL. Wiener et al. (2021) reported the behavior of free-moving particles under AC electric field in different insulating gas mixtures. Ma et al. (2022) studied on movement and distribution characteristics of metal particle dust in DC GIL. These studies clearly indicated that different sizes and quantities of particles could have different adverse effects on GIL. However, they have not come up with effective diagnosis methods for particle faults.
Depending on the signal used, the existing free-conducting particle diagnosis methods are broadly divided into two categories, partial-discharge (PD) signal-based and ultrasonic signal-based methods. Based on extensive experiments, Li et al. (2020) analyzed the flashover characteristics of free-conductive particles through PD signals to detect particle faults in 1,000 kV GILs. Yao et al. (2018) designed nine discharge indexes using PD signals to diagnose particle defect and other insulation defects. Gao et al. (2018) presented the PD intrinsic characteristics, including the time-domain and frequency-domain characteristics, to classify particle defect and other typical defects. Furthermore, based on ultrasonic signals, Zhang et al. (2017) investigated the characteristics of particle faults through ultrasonic signals and estimated the size of free-conducting particles within GIL.
To sum up, two major drawbacks are embodied in the aforementioned diagnosis methods. First, the above signals have their own limitations in particle fault diagnosis. The PD generated by particle fault is unstable and random, so the PD signals lack sufficient sensitivity to particle fault (Luo et al., 2020; Li et al., 2022). Also, due to the equipment structure and operating environment of GIL, ultrasonic signals are very susceptible to interference during propagation and thus cannot accurately reflect the fault characteristics of free-conducting particles (Fei et al., 2020; Ilkhechi et al., 2021). Second, different sizes and quantities of particles indeed have different degrees of influence on the GIL, but till now, to the author’s knowledge, there is a lack of diagnosis methods that can accurately quantify different sizes and quantities of particles. In order to fill these gaps, this paper develops a vibration signal-based diagnosis method to exactly identify different sizes and quantities of particles within GIL. Several primary contributions are made:
(1) Vibration signals are introduced to free-conducting particle fault diagnosis in this study. Until now, very few studies have been seen on the use of vibration signals for particle fault diagnosis. Compared with PD signals and ultrasonic signals, vibration signals have some advantages: 1) vibration signals contain richer fault information; 2) vibration signals due to the direct collision are more sensitive to free-conducting particle fault; 3) strong anti-interference ability.
(2) Different from the existing studies, this paper can achieve an accurate diagnosis for different sizes and quantities of particle faults. To fully capture fault characteristics of free-conducting particles, an integrated diagnosis approach is proposed, which incorporates four algorithms, variational mode decomposition (VMD), multiscale permutation entropy (MPE), self-adapting whale optimization algorithm (SAWOA), and deep forest (DF).
(3) The SAWOA is employed to optimize the critical parameters of MPE. In the MPE algorithms, unreasonable parameters setting will make MPE unable to effectively characterize the feature information of the signals (Jin et al., 2021; Wang et al., 2021). SAWOA, as an improved algorithm of WOA, could exert the best quantification performance of MPE.
The structure of this study is organized as follows. Section 2 introduces the principle of VMD, MPE, SAWOA and DF, and it also describes the complete structure of the proposed method. Section 3 describes the experimental platform and the collection process of experiment data. Section 4 presents the experimental results and contrastive analysis. Section 5 concludes this study.
In contrast to the popular signal-processing methods, such as empirical mode decomposition (EMD) (Chen et al., 2022) and wavelet transform (WT) (Wang et al., 2022), VMD can effectively alleviate the phenomenon of model aliasing (Qi et al., 2022). It decomposes the original signal to several mode components with a specific sparsity bandwidth. The constrained variational model is
where
Equally, The Lagrange multiplier λ(t) and quadratic penalty parameter α has been applied to address reconstruction constraint presented in Eq. 1, and the augmented Lagrange function can be expressed as
In this paper, the saddle point is obtained via the alternate direction method of multipliers (ADMM). The following VMD iterative operation is as follows:
(1) Initialize
(2) Update
(3) Repeat step (2) until Eq. 6 is satisfied:
where ε is the convergence stopped condition.
As an effective fault information quantification method, MPE can quantify the fault feature information of vibration signals (Liu et al., 2021). It aims to measure the random mutation behavior of time series at different scales, which is suitable for analyzing vibration signals produced by the random collision of free-conducting particles. The calculation process of MPE can be described as.
(1) For a given time series
where s and N are the scale factor and the length of time series, respectively.
(2) Through reconstructing the phase space of coarse-grained time series, the l-th reconstructed component can be obtained as follows
where m is the embedding dimension; τ is the delay time.
(3) Considering the numerical relationship, the
Then the corresponding symbolic sequence
(4) The permutation entropy Hp(m) of each coarse-grained sequence is normalized as follows
where Hp is the normalized permutation entropy.
WOA is a new meta-heuristic optimization algorithm proposed by Mirjalili et al. (2016). It can provide a good global search with few adjustment parameters by imitating the bubble-net feeding maneuver of humpback whales. The calculation process of this method consists of two phases: the exploitation phase and the exploration phase. However, this algorithm cannot adjust the parameters according to position variation, causing great randomness of results. Also, it often gets stuck in a local optimum in the late iteration period (Jiang et al., 2020). Thus, a self-adapting strategy for weight coefficient identification and search scheme (Kong et al., 2020) is proposed as follows:
(1) Self-adapting weight adjustment strategy: in the exploitation phase, WOA assumes that the current best agent is the position of the target prey or nearest to the optimum. Then other search agents will gradually surround the best search agent to update their positions. The encircling prey behavior is represented as follows
where
To mimic the spiral movement of humpback whales, shrinking encircling and spiraling upward model are designed. The spiral equation used for updating position of the search agents can be expressed as
where
When
where
The proposed strategy adjusts the weight coefficient from two aspects. In early iteration period,
(2) Self-adapting search adjustment strategy: when
where
Then, a random number f in [0,1] is compared with F. If
where
Otherwise, the positions of other whale individuals are updated according to the Eq. 18
where γ is a random number in [0,1]; Mrmax and Mrmin are the maximum and the minimum value of Mrand, respectively.
The scheme could generate a set of random solutions in global range with a high probability in the early iteration period and enhance the global search capability of WOA. The flowchart of the proposed SAWOA-MPE method is shown in Figure 1.
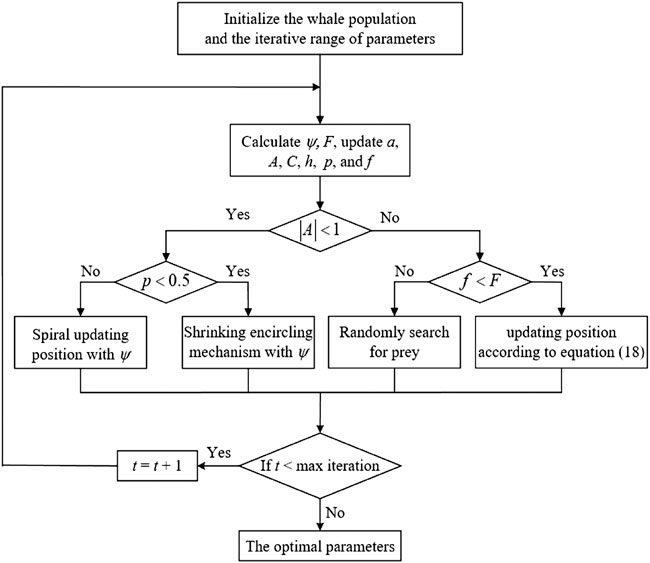
FIGURE 1. Flowchart of the proposed SAWOA-MPE method.
Deep forest (DF), as a kind of deep-learning model, has an excellent performance in processing small-scale datasets by adjusting fewer hyper-parameters (Boualleg et al., 2019; Zhou et al., 2019). Considering the paucity of particle fault data in practical GIL engineering, this article introduces the DF algorithm to realize the identification of particle faults of GIL. The signal processing of DF consists of two parts: multi-grained scanning and cascade forest. Inspired by the excellent performance of convolutional and recurrent neural networks in handling feature relationships, multi-grained scanning is applied to enhance the classification performance of deep forest. Then, cascade forest, a deep procedure, is used for signal classification.
(1) Color/Grayscale figures: multi-grained scanning is a crucial part of deep forest, as shown in Figure 2. It uses sliding windows to scan raw features, generating the corresponding feature vectors. A sliding window of length q performs sampling on the Q-dimensional raw vector. It is supposed that the sliding step is g, and in total G (G=(Q-q)/g+1) feature vectors of q-dimension are produced. Then, both random forest and completely random forest are used to train these subsample vectors. New trained features from the two forests are concatenated and imported to the cascade forest for further processing.
(2) Cascade Forest: cascade forest processes features layer by layer, which resembles the structure of DNNs. In the cascade forest, each layer receives the feature information processed by the previous layer, and then outputs the processed feature information to the following layer. Notably, diversity is encouraged through the utilization of two kinds of forests, i.e., completely random forest and random forest. Multiple random trees are included in both forests. The disparity between the two forests lies in the strategy of selecting features, where the random forest splits the feature with the best Gini value, while the completely random forest arbitrarily selects a feature to split.
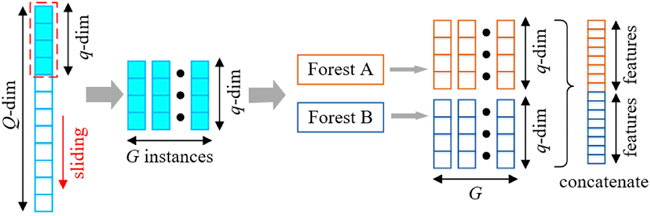
FIGURE 2. Structure diagram of multi-grained scanning.
For improving computational efficiency by decreasing the invalid cascade layer, the coefficient of determination Z2 is used as the index of cascade layer expansion, which is given as:
where zi is the true value;
When
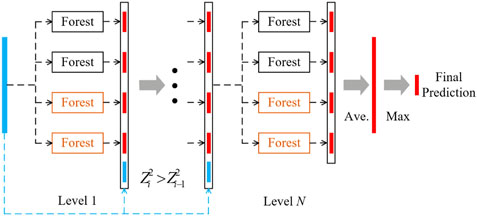
FIGURE 3. Structure diagram of cascade forest.
By incorporating VMD, SAWOA-MPE and DF, a fault diagnosis approach for free-conducting particles within GIL is proposed. The flowchart is shown in Figure 4. The specific steps are summarized as follows:
(1) The raw vibration signal is decomposed by VMD to obtain multiple intrinsic mode functions (IMFs). The correlation coefficient between each IMF and the raw vibration signal is calculated, and the IMFs corresponding to high correlation coefficients (correlation coefficients are larger than 0.2) are selected to restructure the vibration signal.
(2) Within the selected search scopes of the critical parameters, the optimal initial value of each parameter of the MPE is determined by SAWOA. Using this optimized MPE, the entropy of the reconstructed vibration signal can be calculated and used as the feature vectors. Under different working conditions, feature sample sets can be constructed using these feature vectors.
(3) The feature sample sets are fed into the deep forest model to achieve fault identification for free-conducting particles.
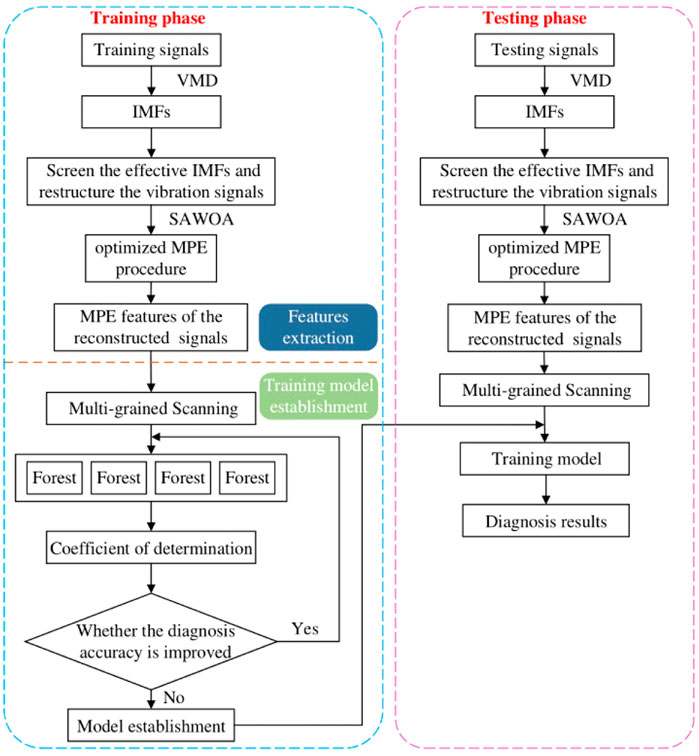
FIGURE 4. Flow chart of the proposed fault diagnosis approach.
A high-voltage GIL experimental platform is established to simulate the free-conducting particle faults and collect the vibration signals, as shown in Figure 5. This platform includes a high-voltage AC power system (high-voltage transformer, protection resistance, and coupling capacitance), a GIL experimental cavity, a semi-closed experimental cavity, a high-speed camera, and a data acquisition system. The simulation method of free-conducting particle faults mainly consults the investigations of motion analysis of free-conducting particles (Wiener et al., 2021; Li et al., 2022).
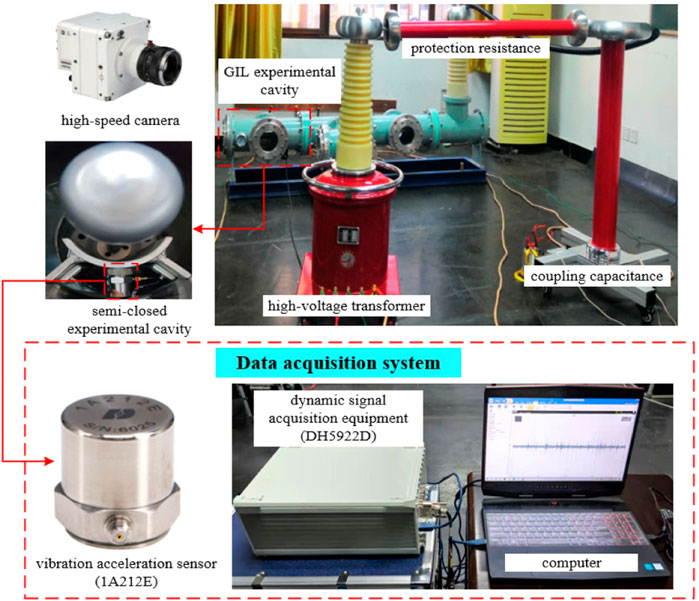
FIGURE 5. High-voltage GIL experimental platform.
The specific circumstances of the working conditions are summarized in Table 1. When the AC voltage (50 kV) is given, the free-conducting particles would jump by the electrical field force and bounce irregularly between the shell and the high voltage electrode. Figure 6 shows the movement of free-conducting particles captured by a high-speed camera with LED light.
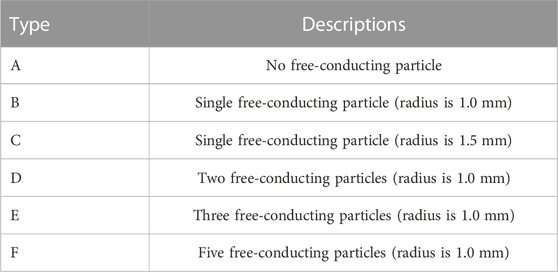
TABLE 1. Descriptions of six working conditions.
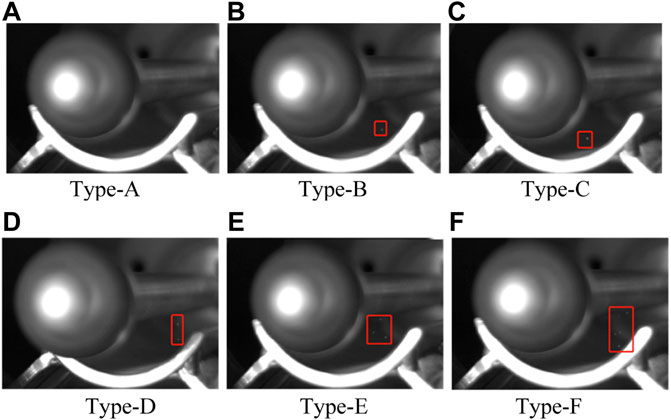
FIGURE 6. Movement images of free-conducting particles.
The data acquisition system in the experimental platform consists of three vibration acceleration sensors (1A212E) and a dynamic signal acquisition equipment (DH5922D), which can effectively collect the corresponding vibration signals. The specific parameters of the vibration acceleration sensor (1A212E) are listed in Table 2.
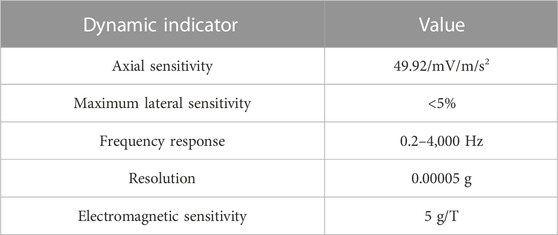
TABLE 2. Specific parameters of the sensor (1A212E).
In this study, the data acquisition system collects 1,080 vibration samples (180 samples per working condition), whose sampling frequency is 20 kHz. Every sample contains 5,000 points. Figure 7 gives the vibration signals under six working conditions. In the case of Type-A, i.e., No free-conducting particle, only some background noises are captured by the data acquisition system. The changes of the signal are relatively smooth and the maximum amplitude is only 0.025 m/s2. In other cases, the vibration signals yielded by the free-conducting particles present disorder and complexity. Under the same operating voltage, the collision frequency and amplitude will vary according to the dimension and amount of the free-conducting particles. The movement of free-conducting particles will cause corona discharge and air gap discharge, which exacerbates the background noise of the vibration signals. In addition, due to the random movement of free-conducting particles in the AC electric field and the interaction force between the conducting particles, the random mutation behavior of the corresponding time series becomes more complex as the quantity of particles increases. Thus, several similar time-frequency features appear between the vibration signals of different free-conducting particle faults, which may cause misleading results to the diagnosis model.
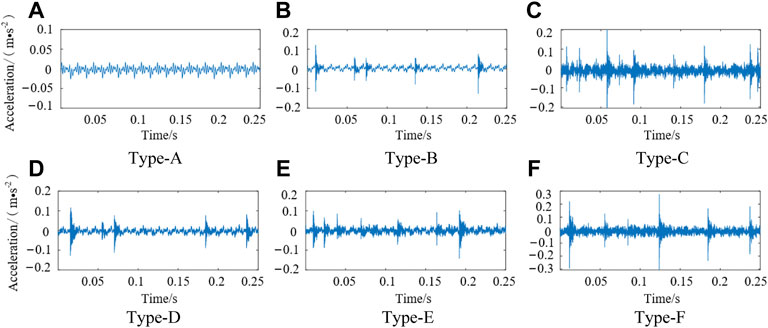
FIGURE 7. Vibration signals under six working conditions.
In the VMD algorithm, the penalty parameter α and the decomposition scale K are two vital parameters, which may affect the performance of VMD decomposition. With taking the signal-to-noise ratio (SNR) into account, the penalty parameter α is chosen to be 2000 to ensure the detail retention ability and denoising ability of VMD (Ren et al., 2019). The optimal K can retain the significant feature information of raw signals to avoid over-decomposition in the VMD process. Thus, in this article, the decomposition scale K is determined by the center frequency method. The variation of center frequency of different K values under Type-F working condition, for instance, is shown in Table 3.
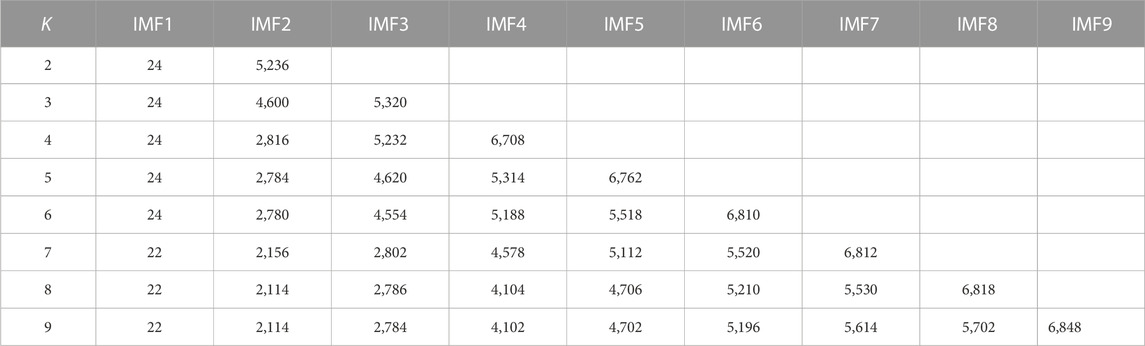
TABLE 3. Variation of center frequency for different K values.
Table 3 exhibits that, when K = 9, some IMF components with similar center frequency begin to appear, such as IMF1 to IMF6, i.e., over-decomposition occurs in the process. Thus, K is determined as eight for vibration signals of Type-F working condition. The time-frequency diagram of IMF components is shown in Figure 8. Further, the correlation coefficients are calculated to determine which IMF contains rich fault information. Once the correlation coefficient exceeds 0.2, the corresponding IMFs are chosen to reconstruct vibration signals.
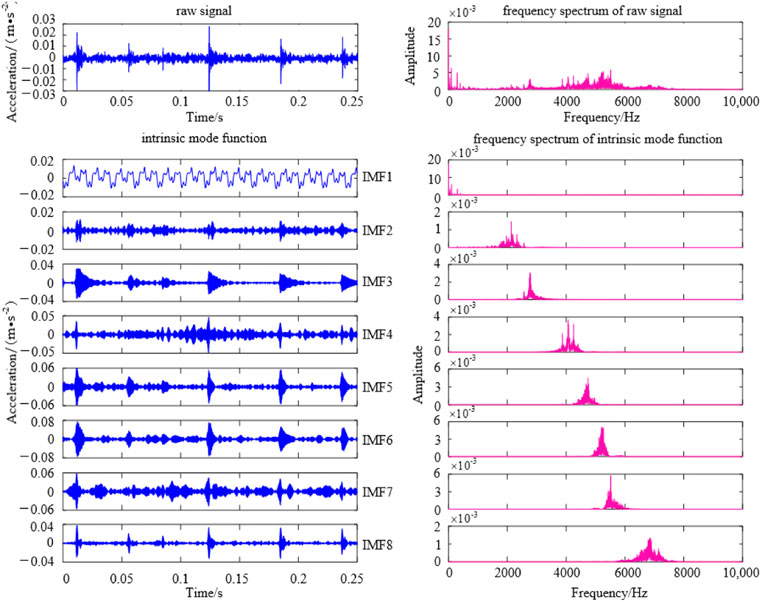
FIGURE 8. Time-frequency diagram of IMF components.
To improve the identification performance of free-conducting particle faults, MPE is extracted to reflect the randomness and mutability of vibration signals. According to the previous researches, there are four parameters should be selected with special care when calculating MPE: the scale factor s, embedding dimension m, delay time τ, and the length of time series N (Jin et al., 2021). It should be noted that setting the initial value of the four parameters is the key to achieving optimal MPE. In the SAWOA algorithm, the iterative ranges of the four parameters are set as,
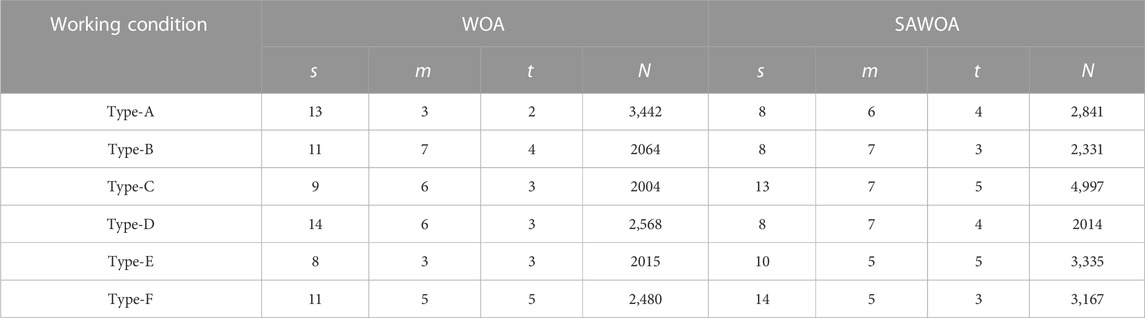
TABLE 4. Optimized parameters of MPE.
It can be seen from Table 4, for the same signals, the MPE parameters optimized by the two algorithms are different. Additionally, the optimal parameters of MPE under different working conditions are also different. To intuitively show the superiority of the SAWOA algorithm, the results of unoptimized MPE (m = 6, s = 12, τ = 1, N = 5,000) (Zhao et al., 2020) and optimized MPE (WOA-MPE and SAWOA-MPE) are shown in Figure 9. The scale factors obtained by the two optimization algorithms are chosen according to the minimum value in Table 4.
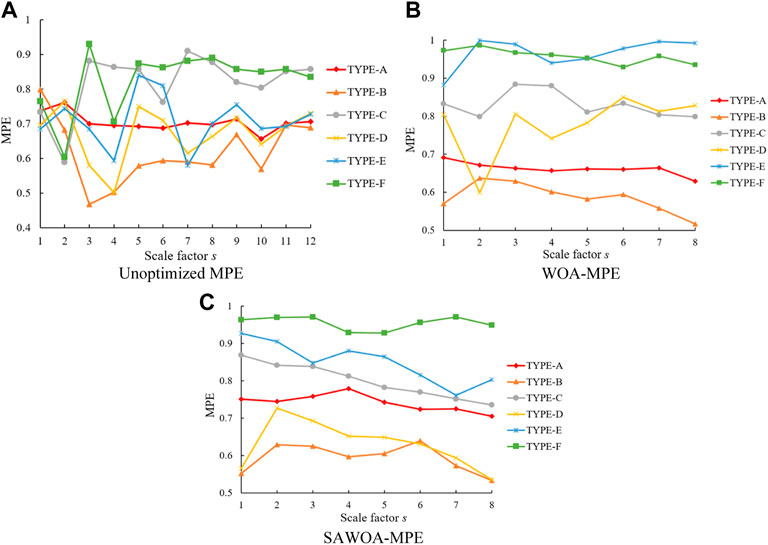
FIGURE 9. MPE of the vibration signals under six working conditions.
It can be seen from Figure 9A, the entropy values of unoptimized MPE under six working conditions are intertwined, which can hardly distinguish the different states. Since WOA comes with parameter optimization capability, the MPE curves under different operating conditions in Figure 9B become more independent, with only a few intersections. More particles can cause more complicated motion behavior, which is likely to produce similar fault characteristics. For this reason, the vibration signals of working conditions E and F may have a higher overlapped fault feature space. As shown in Figure 9B, the MPE curves remain slightly intersected under the working conditions E and F even after WOA-MPE processing. Therefore, the entropy calculated by WOA-MPE still not be highly effective for characterizing the feature information of different free-conducting particle faults. Meanwhile, Figure 9C shows that the optimization effect of SAWOA-MPE is significantly better than that of the first two methods. Almost all entropy variety curves are entirely independent, especially the curves under working conditions E and F are no longer interleaved. In addition, the distances between entropy curves of different working conditions increase obviously, which can verify the superiority of SAWOA-MPE.
(1) Parameters Selection of Deep Forest: in the experiment of this article, as shown in Table 1, free-conducting particle faults within GIL are divided into six categories. 180 groups of sample data are collected for each fault category, and each group contains 5,000 sampling points. Then the feature vectors of each group signal are extracted by the VMD-SAWOA-MEP method. The total 1,080 groups of feature datasets are divided into the training sample sets and testing sample sets according to the ratio of 4:1, then fed into the DF model for fault identification.
Deep forest is composed of multi-grained scanning and cascade forest. According to Table 4; Figure 9, eight-dimension feature vectors are used as the raw input vectors for deep forest. Thus, in the multi-grained scanning phase, the dimensions of sliding windows are set as 2, 4, and 6 (i.e., Q/4, Q/2, 3Q/4, Q is the dimension of feature vector), respectively. The feature vectors generated by sliding the window are input into a random forest and a completely random forest, each of which contains 500 trees.
Similar to the related study (Boualleg et al., 2019), in the cascade forest phase, random forests and completely random forests are used to increase the balance between bias and variance in this study. Notably, the number of forests and trees can significantly affect the identification accuracy and processing time. However, in most studies, the number of each type forest and trees are fixed at 4 and 500, respectively (Zhou et al., 2019; Jia et al., 2021). In order to achieve a balance between identification accuracy and processing time, we vary the number of each type forest (No. F = 2 and No. F = 4) and the number of trees contained per forest (100–1,000 with step size 100). By using five-fold cross validation, the identification accuracy and the processing time of diagnosis model are shown in Figure 10.
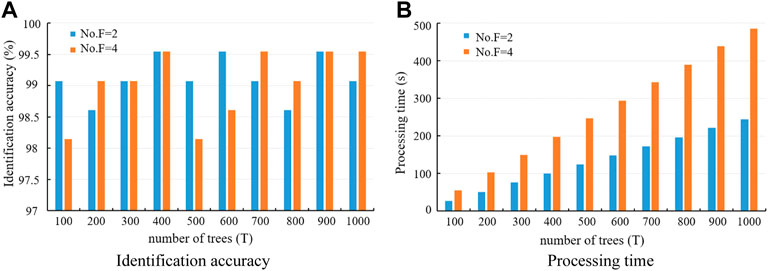
FIGURE 10. Identification accuracy and processing time of diagnosis model.
It can be seen from Figure 10, the highest identification accuracy of the diagnosis models can reach 99.5%, when the number of each type forest is set to 2 or 4. In addition, the training process becomes slower as the number of trees increases. Consequently, considering the identification accuracy and the processing time, we set the number of each type forest to 2 and the number of trees contained per forest to 400. The number of cascade levels is determined by the coefficient of determination Z2. As shown in Figure 11, the coefficient of determination Z2 presents an upward trend, i.e., the diagnosis accuracy of the model is constantly improving. When the levels of cascade forest increase to 5, the diagnosis accuracy becomes stable, and the training process of the whole model is stopped.
(2) Comparative Study: in this comparative study, we compare the proposed method with some typical learning-based classification models and fault features. Five-fold cross validation is used to reduce the risk of overfitting and handle the potential randomness in the diagnostic validation stage. Several parameters of the DF model are shown in Table 5.
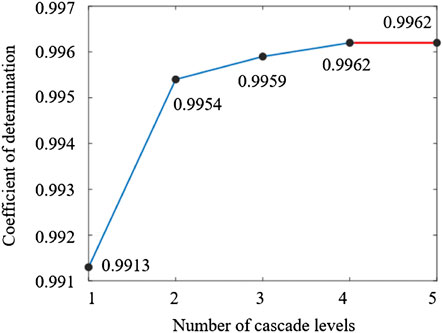
FIGURE 11. Relationship between Z2 and the number of cascade levels.
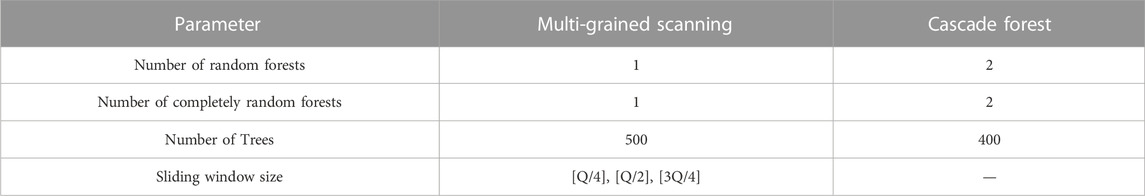
TABLE 5. Parameters setting of deep forest.
Four metrics, including accuracy, recall, precision, and F1 score, are used to evaluate the robustness and generalization of different fault diagnosis methods. The diagnostic results of free-conducting particle faults using MPE feature vectors are shown in Figure 12; Table 6. It is observed that, due to the random motion behavior of free-conducting particles in AC electric field, when the unoptimized MPE is used as a feature vector, it is difficult to distinguish the different free-conducting particle faults. The classification accuracy drops as the number of particles increases. It is because, in AC electric field, the interaction force between the particles and the distortion degree of electric field is intensified by an increasing number of particles, which can cause more complicated particle motion behavior, richer fault characteristic information, and higher overlapped feature space. In contrast, the diagnosis model achieves higher performance using optimized MPE, especially for multi-particle faults. The detection accuracy using MPE, WOA-MPE and SAWOA-MPE are respectively 76.8%, 98.6%, and 99.5%. It should emphasize that, for the five free-conducting particles fault (Type-F), the detection accuracy is 100% by using SAWOA-MPE. Thus, the proposed SAWOA-MPE-DF model can effectively tackle overlapped feature problems between the particle faults.
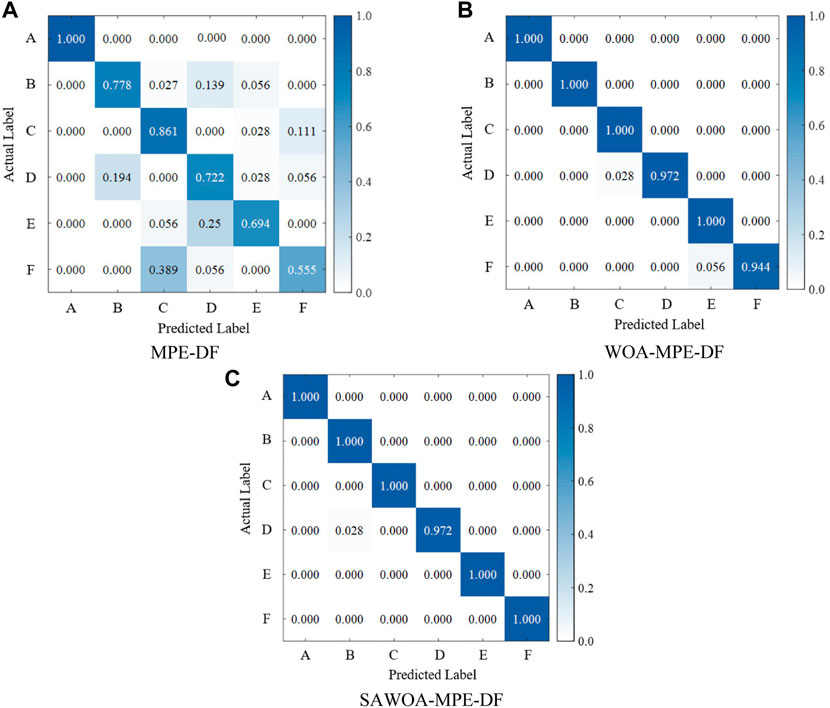
FIGURE 12. Diagnostic results of free-conducting particle faults.
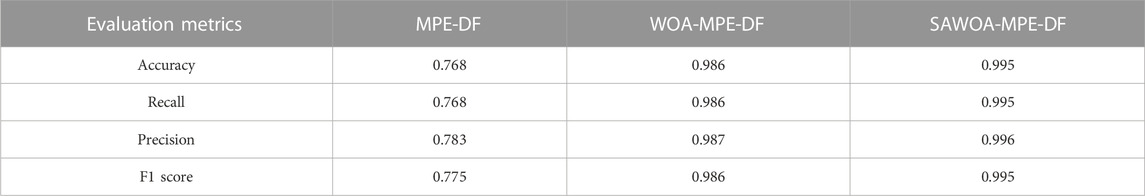
TABLE 6. Diagnostic performance of three methods.
In this comparative experiment, a comprehensive time-frequency domain feature vector is used as a contrastive feature vector, which contains nine time-domain features (root mean square, absolute mean value, mean square, kurtosis, skewness, waveform factor, peak factor, impulsion index, and margin index) and five frequency-domain features (mean value, standard deviation, root mean square, center frequency, and frequency kurtosis). Referring to the related researches (Wiener et al., 2021; Wu et al., 2022), the combination of particle collision frequency fc and maximum amplitude Amax in the time-domain signal is used as another contrastive feature vector. Then SAWOA-MPE is compared with the two categories of feature vectors by using the DF diagnosis model. Meanwhile, the proposed method is compared with the four other diagnosis models, namely convolutional neural network (CNN), k-nearest neighbors (KNN), support vector machine (SVM), and random forest (RF), to verify its superiority. The comparison results of different diagnosis methods are illustrated in Table 7.
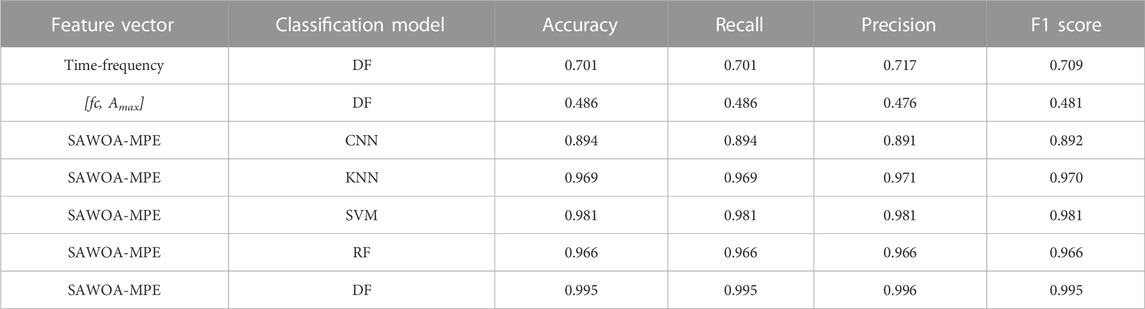
TABLE 7. Comparison results of different diagnosis methods.
It is observed that there are significant performance differences among the feature vectors. Based on deep forest, SAWOA-MEP, achieves the highest performance in classifying free-conducting particle faults compared to other feature vectors: SAWOA-MEP (99.5%), WOA-MPE (98.6%), MPE (76.8%), time-frequency domain feature vector (70.1%), and the combination of particle collision frequency and maximum amplitude (48.6%). The maximum difference of classification accuracy between these feature vectors is 50.9%. For using SAWOA-MPE, as the feature vector, deep forest still gets the best performance compared to CNN, and other typical machine learning-based methods, such as KNN, SVM, and RF., By contrast, CNN, may lead to overfitting for small datasets in the learning process, which can hardly process the task with small-scale training data. In summary, the proposed diagnosis method has a good application in the field of free-conducting particle fault detection with small datasets.
To accurately identify the free-conducting particle faults with different quantities and sizes, this paper proposes an effective diagnosis method based on vibration signals and the VMD-SAWOA-MEP-DF method. Firstly, the vibration signals are restructured through the high correlation coefficient IMFs decomposed by VMD, which can remove some interference frequency components. Then, SAWOA is employed to optimize the critical parameters of MPE. Compared with WOA-MEP and unoptimized MPE, SAWOA-MEP can extract more discriminating fault features from the reconstructed vibration signals. Moreover, Facing the problem of the small-scale fault feature datasets, the DF shows a robust classification ability only using a few hyper-parameters, and achieves better performances than other learning-based classical methods, such as CNN, KNN, SVM, and RF. Extensive experiments are conducted based on the high-voltage GIL experimental platform, and the proposed method is compared with the commonly used fault features and different classification models. The experimental results show that the identification accuracy of the proposed method for free-conducting particle faults with different quantities and sizes reaches 99.5%, meaning that the proposed method is pretty effective and superior. At last, this method provides a new reference for the fault diagnosis of free-conducting particles within GIL.
The original contributions presented in the study are included in the article/supplementary material, further inquiries can be directed to the corresponding author.
All authors listed have made a substantial, direct, and intellectual contribution to the work and approved it for publication.
This study was funded by the National Natural Science Foundation of China, Grant No 51577050.
The authors declare that the research was conducted in the absence of any commercial or financial relationships that could be construed as a potential conflict of interest.
All claims expressed in this article are solely those of the authors and do not necessarily represent those of their affiliated organizations, or those of the publisher, the editors and the reviewers. Any product that may be evaluated in this article, or claim that may be made by its manufacturer, is not guaranteed or endorsed by the publisher.
Boualleg, Y., Farah, M., and Farah, I. R. (2019). Remote sensing scene classification using convolutional features and deep forest classifier. IEEE Geosci. Remote S. 16 (12), 1944–1948. doi:10.1109/LGRS.2019.2911855
Chen, S. Y., Cao, S. Y., Sun, Y. G., Lin, Y., and Gao, J. (2022). Seismic time-frequency analysis via time-varying filtering based empirical mode decomposition method. J. Appl. Geophys. 204, 104731. doi:10.1016/j.jappgeo.2022.104731
Fei, Y., Liu, Y. P., Chen, J. B., Cheng, L., Li, M. Q., Liu, Y., et al. (2020). The attenuation and propagation law of ultrasonic wave in UHV gas insulated line. IEEE ACCESS 8, 163308–163315. doi:10.1109/ACCESS.2020.3021432
Gao, W. S., Ding, D. W., Liu, W. D., and Huang, X. H. (2018). Analysis of the intrinsic characteristics of the partial discharge induced by typical defects in GIS. IEEE Trans. Dielect. El. In. 20 (3), 782–790. doi:10.1109/TDEI.2013.6518948
Gao, Y., Li, Z. H., Wang, H., and Yuan, X. C. (2020). Metal particle encouraged surface charge accumulation on epoxy insulator with multi-arc surface profile under DC voltage. IEEE Trans. Dielect. El. In. 27 (3), 998–1006. doi:10.1109/TDEI.2019.008634
Gao, Y., Wang, H., Yuan, X. C., Zhao, H. C., and Li, Z. Y. (2022). Surface charge accumulation on a real size epoxy insulator with bouncing metal particle under DC voltage. IEEE Trans. Plasma. Sci. 49 (7), 2166–2175. doi:10.1109/TPS.2021.3089504
Guo, Y., Yang, D. F., Zhang, Y., Wang, L. C., and Wang, K. (2022). Online estimation of SOH for lithium-ion battery based on SSA-Elman neural network. Prot. Contr. Mod. Pow. 7 (1), 40. doi:10.1186/s41601-022-00261-y
Huang, X. W., Wang, J. R., Wang, J., and Li, Q. M. (2020). Functions of phenyl sulfide in polyimide as the electrode coating film to suppress the metal-particle motion within DC GIL. GIL. Mat. Today Commun. 23, 100877. doi:10.1016/j.mtcomm.2019.100877
Ilkhechi, H. D., and Samimi, M. H. (2021). Applications of the acoustic method in partial discharge measurement: A review. IEEE Trans. Dielect. El. In. 28 (1), 42–51. doi:10.1109/TDEI.2020.008985
Jia, Z., Liu, Z. B., Gan, Y. F., Vong, C. M., and Pecht, M. (2021). A deep forest-based fault diagnosis scheme for electronics-rich analog circuit systems. IEEE Trans. Ind. Electron. 68 (10), 10087–10096. doi:10.1109/TIE.2020.3020252
Jiang, R. Y., Yang, M., Wang, S. Y., and Chao, T. (2020). An improved whale optimization algorithm with armed force program and strategic adjustment. Appl. Math. Model. 81, 603–623. doi:10.1016/j.apm.2020.01.002
Jin, T. T., Cheng, Q., Chen, H., Wang, S. Y., Guo, J. Y., and Chen, C. H. (2021). Fault diagnosis of rotating machines based on EEMD-MPE and GA-BP. Int. J. Adv. Manuf. Tech. Early Access. doi:10.1007/s00170-021-08159-z
Kong, Z., Yang, Q. F., Zhao, J., and Xiong, J. J. (2020). Adaptive adjustment of weights and search strategies-based whale optimization algorithm. J. Northeast. Univ. Nat. Sci. 41 (1), 35–43. doi:10.12068/j.issn.1005-3026.2020.01.007
Li, B. T., Shi, L., Wen, W. J., Li, B., and Gu, T. F. (2022). Research on the calculation method of equivalent parameters of the core wire for the high-voltage GIL metal shell grounded through the copper bar. Front. Energy Res. 10, 813770. doi:10.3389/fenrg.2022.813770
Li, D. Z., Yang, D. F., Li, L. W., Wang, L. C., and Wang, K. (2022). Electrochemical impedance spectroscopy based on the state of health estimation for lithium-ion batteries. Energies 15 (18), 6665. doi:10.3390/en15186665
Li, X., Liu, W. D., Xu, Y., Chen, W. J., and Bi, J. G. (2020). Surface charge accumulation and pre-flashover characteristics induced by metal particles on the insulator surfaces of 1100 kV GILs under AC voltage. High. Volt. 5 (2), 134–142. doi:10.1049/hve.2019.0222
Li, X., Liu, W. D., Xu, Y., and Ding, D. W. (2022). Partial discharge and movement characteristics of micron-sized metal particles on insulator surface in gas-insulated switchgear with long-time AC stress. IEEE Trans. Dielect. El. In. 28 (6), 2152–2160. doi:10.1109/TDEI.2021.009775
Liu, X. L., Wang, Z. X., Li, M. Y., Yue, C. X., Liang, S. Y., and Wang, L. H. (2021). Feature extraction of milling chatter based on optimized variational mode decomposition and multi-scale permutation entropy. Int. J. Adv. Manuf. Tech. 114 (9), 2849–2862. doi:10.1007/s00170-021-07027-0
Luo, X. Y., Tang, J., Pan, C., and Zhang, Y. Z. (2020). Contribution of free iron particles to PD characteristics in flowing transformer oil at DC voltages. IET Gener. Transm. Dis. 14 (2), 294–300. doi:10.1049/iet-gtd.2019.1227
Ma, K., Liu, H. Q., Wang, Q., Wang, S. H., and Lv, F. C. (2022). Study on movement and distribution characteristics of metal particle dust in DC GIL. IEEE Trans. Dielect. El. In. 29 (3), 1208–1217. doi:10.1109/TDEI.2022.3169725
Mirjalili, S., and Lewis, A. (2016). The whale optimization algorithm. Adv. Eng. Softw. 95, 51–67. doi:10.1016/j.advengsoft.2016.01.008
Qi, T. Y., Wei, X. Y., Feng, G. R., Zhang, F., Zhao, D. K., and Guo, J. (2022). A method for reducing transient electromagnetic noise: Combination of variational mode decomposition and wavelet denoising algorithm. J. Meas. 198, 111420. doi:10.1016/j.measurement.2022.111420
Qiao, Y. J., Liang, R., Gao, P., Zhu, S. Y., Chen, C. Y., Qin, Y. X., et al. (2021). Heat transfer analysis of different conditions for SF$_{6}$/N$_2$ gas-insulated transmission lines. IEEE Trans. Power Deliv. 36 (2), 831–840. doi:10.1109/TPWRD.2020.2994928
Ren, H., Liu, W. Y., Shan, M. C., and Wang, X. (2019). A new wind turbine health condition monitoring method based on VMD-MPE and feature-based transfer learning. Measurement 148, 106906. doi:10.1016/j.measurement.2019.106906
Wang, J., Hu, Q., Chang, Y. A., Liang, R. X., Tu, Y. P., Li, C. Y., et al. (2021). Metal particle contamination in gas-insulated switchgears/gas-insulated transmission lines. CSEE J. Power. Energy. 7 (5), 1011–1025. doi:10.17775/CSEEJPES.2019.01240
Wang, J., Hu, Q., Chang, Y. A., Liang, R. X., Tu, Y. P., Li, C. Y., et al. (2021). Metal particle contamination in gas-insulated switchgears/gas-insulated transmission lines. CSEE J. Power. Energy. 7 (5), 1011–1025. doi:10.17775/CSEEJPES.2019.01240
Wang, M. H., Lu, S. D., and Liao, R. M. (2022). Fault diagnosis for power cables based on convolutional neural network with chaotic system and discrete wavelet transform. IEEE Trans. Power Deliv. 37 (1), 582–590. doi:10.1109/TPWRD.2021.3065342
Wiener, J., Hinrichsen, V., Wacker, D. R., Goll, F., and Juhre, K. (2021). Investigation of free-moving particles under AC electric field in different insulating gas mixtures. IEEE Trans. Dielect. El. In. 28 (2), 672–680. doi:10.1109/TDEI.2021.009246
Wu, Z. H., Li, Z. K., Liu, P., Peng, Z. R., Wang, H. R., Cui, B. Y., et al. (2022). Simulation and analysis on motion behavior of metal particles in AC GIL. IEEE Trans. Dielect. El. In. 29 (2), 1–574. doi:10.1109/TDEI.2022.3163807
Yao, R., Hui, M., Li, J., Bai, L., and Wu, Q. S. (2018). A new discharge pattern for the characterization and identification of insulation defects in GIS. Energies 11 (4), 971–988. doi:10.3390/en11040971
Zhang, X. Z., Ji, H. X., Li, C. R., Zheng, S. S., Pang, Z. K., and Zeng, Z. P. (2017). Size estimation of linear metal particle based on the collision frequency and discharge amplitude. High. Volt. Appar. 53 (4), 107–115. doi:10.13296/j.1001-1609.hva.2017.04.018
Zhao, D. F., Liu, S. L., Gu, D., Sun, X., Wang, L., Wei, Y., et al. (2020). Improved multi-scale entropy and it’s application in rolling bearing fault feature extraction. Measurement 152, 107361. doi:10.1016/j.measurement.2019.107361
Keywords: free-conducting particle fault, quantitative diagnosis, gil, vibration signals, SAWOA-MPE
Citation: Duan D, Ma H, Yang Q and Li N (2023) Fault diagnosis of free-conducting particles within GIL based on vibration signals. Front. Energy Res. 11:1088549. doi: 10.3389/fenrg.2023.1088549
Received: 03 November 2022; Accepted: 16 January 2023;
Published: 26 January 2023.
Edited by:
Xiaohu Yang, Xi'an Jiaotong University, ChinaCopyright © 2023 Duan, Ma, Yang and Li. This is an open-access article distributed under the terms of the Creative Commons Attribution License (CC BY). The use, distribution or reproduction in other forums is permitted, provided the original author(s) and the copyright owner(s) are credited and that the original publication in this journal is cited, in accordance with accepted academic practice. No use, distribution or reproduction is permitted which does not comply with these terms.
*Correspondence: Dawei Duan, MTkwMjA2MDMwMDAzQGhodS5lZHUuY24=
Disclaimer: All claims expressed in this article are solely those of the authors and do not necessarily represent those of their affiliated organizations, or those of the publisher, the editors and the reviewers. Any product that may be evaluated in this article or claim that may be made by its manufacturer is not guaranteed or endorsed by the publisher.
Research integrity at Frontiers
Learn more about the work of our research integrity team to safeguard the quality of each article we publish.