 Haoyu Gao
 Qiuling Yue1*
94% of researchers rate our articles as excellent or good
Learn more about the work of our research integrity team to safeguard the quality of each article we publish.
Find out more
ORIGINAL RESEARCH article
Front. Energy Res. , 17 February 2023
Sec. Process and Energy Systems Engineering
Volume 11 - 2023 | https://doi.org/10.3389/fenrg.2023.1073879
This article is part of the Research Topic Advanced Thermal Conduction, Thermal Insulation, Thermal Storage Materials and Technologies View all 7 articles
Raised-floor data centers usually suffer from the local hotspots resulted from uneven cool air delivery. These hotspots not only degrade server performance, but also threat equipment reliability. The commonly used industrial practice of increasing the Computer Room Air Conditioner (CRAC) blower speed for removing hotspots is energy inefficient and may lead to overcooling of some servers. In this paper, we explore the potential of active tiles in data center cooling management. In particular, we deploy a prototype of active tile in a production data center and conduct extensive experiments to investigate the cooling performance. It is shown that deploying the active tiles with even 10% fan speed increases the tile flow by 49%, and sealing the under-rack gap reduces the rack bottom temperature by up to 6°C. Moreover, three machine learning techniques, i.e., Gaussian Process Regression (GPR), Artificial Neural Network (ANN), and Multivariate Linear Regression (MLR) are employed to construct end-to-end data-driven thermal models for the active tile. Using field measured data as training and testing data sets, it is concluded that GPR and ANN are competent for accurate thermal modeling of active tiles. Specifically, GPR achieves the smallest prediction error which is around 0.3°C.
There has been a boom in big data and cloud computing technologies in recent years, which require more resources to perform massive computations. As an essential component of IT infrastructures, the data center, which is a large-scale and complex building consisting of various energy-hungry IT and cooling equipments, is scattered all over the world. According to a report of U.S. National Resources Defense Council (NRDC), the energy consumption of U.S. data centers was as much as 91 billion Kilowatt-hours in 2013, which was estimated to reach roughly 140 Kilowatt-hours by 2020 (Delforge, 2014). This is equivalent to the annual energy generation capacity of 50 large coal-fired power plants and poses great challenges to energy conservation and air protection.
Central to the issue of massive energy consumption in data centers is removing the waste heat out of server racks Zhang et al. (2022). On one hand, accumulated heat in the server box deteriorates the performance and degrades the reliability of IT devices. Nearly every server manufacturer establishes a correlation between the thermal design point and the expected performance. While occasionally going beyond the temperature threshold may be allowed, the system failure rate would rise dramatically and servers could even be burnt out once the temperature frequently exceeds the heat-tolerance. On the other hand, removing the heat from the machine room causes a huge energy consumption Li and Li (2021). It was estimated that cooling components used as much as half of the total energy in a data center (Miyuru Dayarathna and Fan, 2016). Fighting the cooling battle is thus the crux to balance the performance and energy consumption.
A typical raised-floor data center layout is illustrated in Figure 1 where IT devices and Heating, Ventilation and Air Conditioning (HVAC) system interact via heat. Multiple servers are installed in racks whose fronts are laid face-to-face to form a cold aisle. The cold air is sent to the underfloor plenum by Computer Room Air Conditioner (CRAC) blowers and flows into the cold aisle through perforated tiles under the force of pressure differential. The cold air is then sucked by built-in fans into server boxes and absorbs the waste heat released by electronic equipments. After turning into the hot air, it is ejected from rack backs into the hot aisle and is transported back into CRACs through the false ceiling. Heat is moved from the machine room to the outside environment through the heat-exchange process.
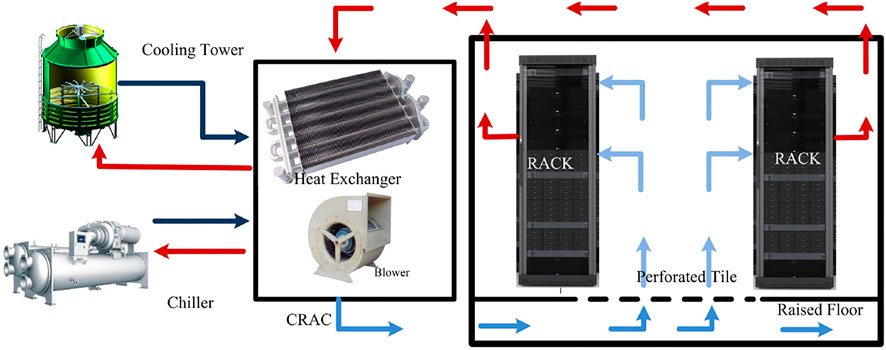
FIGURE 1. A typical raised-floor data center model with the heat-exchange process.
In the raised-floor data center, perforated tiles are the critical components on the airflow path from which the cold air flows into the cold aisle. While the adjustments in CRAC setpoints (e.g., blower speed and supplying air temperature) can be considered as global control strategies since they affect the overall air flow pattern inside the machine room, the control mechanisms attached on perforated tiles are more “local” because they just have impact on surrounding racks. There are some works to control the tiles for balancing the local cold air supply-and-demand. For example, Mohsenian et al. (2019), Mohsenian et al. (2021), and Khalili et al. (2019) attached dampers on tile back and developed fuzzy controllers to finely tune the porosity. However, these techniques were passive and had only limited effects. To address this problem, the active tile where Variable Frequency Drive (VFD) fans are attached to the tile back is proposed to redistribute the amount of traversing cold air more flexibly. Recent studies Wan et al. (2021) showed that active tiles with properly designed controllers effectively removed local hotspots.
The active tile as a new configuration was only investigated in a limited number of works where Computational Fluid Dynamics (CFD) simulations were often employed for performance evaluation (Athavale et al., 2018a; Phan et al., 2019; Hu et al., 2020). However, CFD models usually cannot capture the structural details which are critical to the thermal performance and the obtained models are hard to generalize due to tile shape and geometry diversity (Xiong and Lee, 2021). To address these limitations, various experimental and measurement studies were conducted in real data centers. Athavale et al. (2016) studied the thermal performance of active tiles; Arghode et al. concentrated on the overall energy efficiency (Arghode et al., 2016); both factors were jointly considered in (Fulpagare et al., 2022). Nevertheless, the thermal modeling issue, i.e., the construction of concise models to characterize the relationship between thermal performance and environmental variables, is not well investigated. Most efforts on thermal modeling, model-based thermal management, and parametric investigation were related to the data centers with passive tiles, and majority of these thermal models are constructed based on data generated by the CFD simulation (Zhang et al., 2015; Athavale et al., 2018b). We emphasize that CFD simulations are computationally expensive and can hardly be used in real-time control (Wan et al., 2021). In addition, constructing thermal model is essential since inaccurate models make the active tile controller susceptible to making wrong decisions that either is energy inefficient or violates the thermal constraints. Therefore, it is imperative for researchers to develop end-to-end and reduced-order models directly from measurement data for better understanding and control of active tiles.
In this paper, we conduct performance evaluation and thermal modeling of active tiles leveraging measurement data from a production data center. Our field measurement study shows that the active tile remarkably improves the local cooling efficiency. In addition, we propose data-driven thermal models based on Gaussian Process Regression (GPR), Artificial Neural Network (ANN), and Multivariate Linear Regression (MLR). It is concluded that GPR and ANN are competent for accurate thermal modeling of active tiles.
The local imbalance between cold air supply and demand leads to uneven thermal pattern and energy inefficiency. Specifically, at the top of racks in open aisles, the hot air recirculation gives rise to local overheating, i.e., the hot air produced by servers flows reversely into the cold aisle through available channels. This phenomenon is ascribed to the deficit of cold air in higher positions, i.e., the cold air provided by the CRAC units cannot reach the rack top. As a consequence, the inlet air temperature at rack top is rising and local hot spots emerge. Simply setting a higher volumetric air flow rate at CRAC blowers cannot fully address the problem because it increases the air supply for all racks. While some hotspots are removed, servers in other racks are overcooled. In addition, the over-provisioned cold air increases the underfloor plenum pressure, which aggravated the floor leakage and further degrades the cooling efficiency. To better manage the thermal and air flow distribution, the structure optimization in the tile level is extensively studied since the tile only affects neighboring racks.
Perforated tiles as one of the main components of cooling system in raised-floor data centers are the pathway for cold air flowing into the cold aisle. According to whether there are attached fans, they are generally categorized as passive and active tiles.
There are different types of tiles with various geometry designs and opening areas in the market (RLE-Technologies, 2022). The impact of multiple factors, such as the opening geometry, open area ratio, cross flow orientation, and tile size, etc., on the air flow distribution and thermal performance were investigated by researchers from both industry and academia (Arghode and Joshi, 2015; Nada et al., 2016; Ling et al., 2017). The faster decay of the air jet momentum was observed above tiles with the smaller pore diameter. Lower porosity tiles accelerated the air flow rate above the tile surface and at the rack top. This aggravated the cold air bypass for exactly or over-provisioned case, but promoted the cold air to reach rack tops for under-provisioned case due to higher airflow momentum. While changing the physical structure of perforated tiles enables a more uniform thermal field and airflow distribution, it requires intervention from maintenance staff and cannot be frequently applied to satisfy the dynamic thermal load due to inconvenience.
The passive tile is upgraded to the AVT with an additional damper, which can be dynamically controlled by a motor to adjust the tile opening ratio from 0 to 100 percent so that the local cold air demand is satified. Besides the supplying cold air volume, the air flow direction could also be turned by the damper vane to reduce the bypass. Model Predictive Controller (MPC) and Multi-Input-Multi-Output (MIMO) controller were applied to dynamically control AVTs to make the cold air supply adapt to the variable thermal load (Zhou et al., 2011, Zhou et al., 2012). In these systems, the rack inlet temperature was continuously captured and fed back to the controller. The controller then compared the preset temperature threshold with sensor readings and updated the valve deviation distance. Mohsenian et al. (2019) and Khalili et al. (2019) proposed to leverage fuzzy controllers to adjust the angle the damper’s vane to maintain the pressure differential between containment and room. The idea is further extended in (Mohsenian et al., 2021) where the pressure differential between underfloor plenum and room is also included as the control objective. It was concluded that combining AVTs with other smart control techniques could effectively balance the cooling supply-and-demand and optimize the energy consumption while met the cooling demand.
Benefits of using active tiles include: 1) More flexible control of cooling resource. Instead of adjusting CRAC parameters to globally control the thermal performance, an additional control knob of tile fan speed can adaptively adjust the local air supply according to the thermal load of adjacent racks. In addition, this strategy avoids the potential overcooling in other racks. 2) Higher energy efficiency. With passive tiles, the cold air is discharged into cold aisles by a positive pressure differential, which can be achieved only by feeding sufficient cold air into the underfloor plenum at the cost of increased CRAC blower speed. Whereas, active tiles do not require such strictly positive pressure differential to drive the cold air, and thus the CRAC blower speed can be reduced. While additional energy is consumed by tile fans, it is trivial for well controlled fans compared with CRAC blowers. 3) More uniform thermal pattern. As a result of the large flow resistance of passive tiles, only a fraction of cold air reaches the rack tops, leading to severe hot air recirculation even if CRAC blowers run at full speed. Fan-assisted tiles, on the other hand, deliver the air flow into cold aisles with less momentum loss, i.e., the deficiency of supplying cold air is eliminated at the rack top.
To evaluate the performance of active tile, measurement studies are preferred since they capture the physical characteristics more precisely. However, when field measurements are not applicable due to reliability and security concerns, CFD simulations can also provide some insightful observations.
Real-time Measurement. Four cases, which were categorized based on whether active tiles were installed and whether the cold aisle was contained, were evaluated in a real data center by Arghode et al. (2016). They found that the air flow rate for active tiles was significantly higher than that for passive tiles. The ratio of tile-to-rack flow rate approached to 1 for active tiles in both contained (103%) and open (98%) aisles, indicating a good match between the supply-and-demand of cold air. The cold aisle pressure with respect to the room space were 0.56 Pa and −1.02 Pa for open and contained aisles, respectively. Furthermore, nearly equal air pressures between underfloor plenum and room space were observed. Lower pressure differential is favourable since it leads to less air leakage from the cold aisle and underfloor plenum to the room space. The deployment of active tiles resulted in more uniform thermal fields in both the cold aisle and rack inlets, but there was no improvement in Power Usage Efficiency (PUE), which was attributed to more energy expenditure to run tile fans. A key observation was that the tile fan speed in (Arghode et al., 2016) was not adjustable, i.e., it was fixed at maximal speed regardless of thermal load. Wan et al. (2021) Leveraged the recently proposed model-free Deep Reinforcement Learning (DRL) techniques to control the tile fan speed. A remarkable advantage of this approach is that the DRL controller can learn the optimal cooling policy directly from the data acquired in the field. It was shown that adjustable tile fans did reduce the overall energy consumption.
CFD Simulation. Considering the security and reliability, real data centers hardly permit non-staff members to conduct indoor and practical experiments, so the CFD simulation appears to be an alternative approach to explore the data center performance. For example, Athavale et al. (2018b) modeled a raised floor data center with all passive, single active and all active tiles using the CFD method. Real measurement and model-based calculation reached a good agreement, i.e., average discrepancies between for rack inlet temperature and total tile flow rate were less than 1.7°C and 4%, respectively. These models could be used for the prediction of the thermal performance and intelligent control of the cooling system. In addition, the CFD approach can also save experimental cost and facilitate parametric studies. Song (2016a), Song (2016b) Leveraged the CFD approach to investigate the thermal and air flow distribution arising from two variables-tile flow angle and fan-to-tile distance. It was concluded that straightening the tile flow and a proper fan-to-tile distance are essential to the cooling efficiency.
All experiments in this work are conducted in a Data center of Inner Mongolia Meteorology Information Center (2019), where the air flow organization is the underfloor supply and flooded ceiling return. Figure 2 depicts the overall geometry and layout of the data center. The height of machine room is 4 m, the depth of the raised floor plenum is 0.5 m. There are totally 78 standard 42-U (1-U = 44.45 mm) racks with 2 m height placed around 5 open cold aisles comprised of two rows of standard 0.61 m × 0.61 m (2 ft × 2 ft) perforated tiles. Multiple types of devices including servers, storages, and network facilities, etc., are installed into racks. The machine room houses 5 CRAC units (Emerson Liebert PeX P3080FARMS1R) arranged around the periphery, each one has the cooling capacity of 81.4 kW. The peak power load of a rack is 6 kW, but not all racks are fully occupied. As a result, the overall thermal load is around 65% of the cooling capacity and CRAC-1 is turned off because the data center is currently under utilized. During our experiments, the CRAC units, which supply cold air into the underfloor plenum at a relatively stable rate, operate at a supplying temperature of 23°C (this information is shown on the CRAC dashboard), although the CRAC setpoint is 21°C. Cold air is then delivered into cold aisles via perforated tiles with the porosity of 55% (RLE-Technologies, 2022).
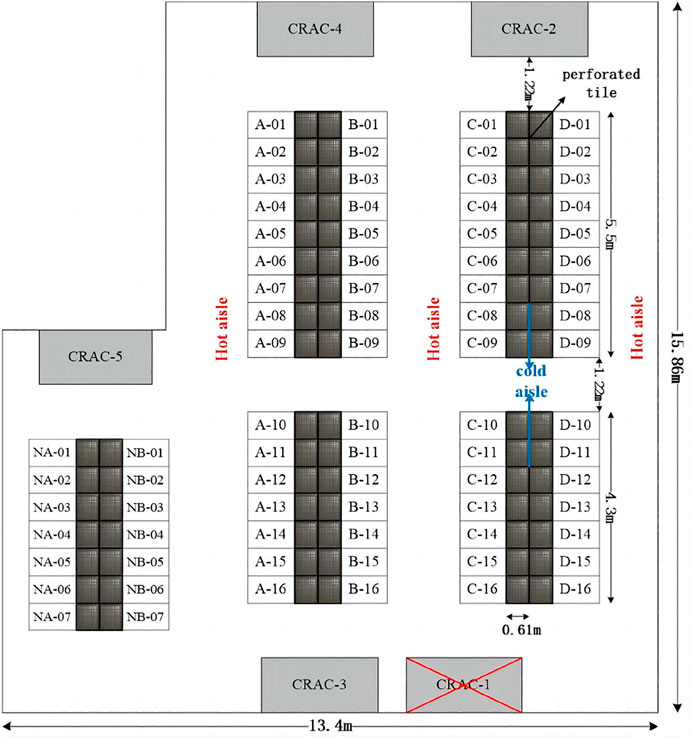
FIGURE 2. Layout of the data center of Inner Mongolia Meteorology Information Center.
We design a prototype of active tile illustrated in Figure 3. 8 auxiliary fans (12 V, 0.7 A) are fixed on a metal plate which is attached to the back of a passive tile. The fan-to-tile distance is 5 cm. Moreover, the active tile is integrated with a switching power supply (Mean Well LRS-150-12) and a speed-controller (AQMD2410NS). Tile fan speed can be varied from 1% to 100% in response to the voltage input determined by the controller. The control signals are sent from a Personal Computer (PC) via RS485 port.
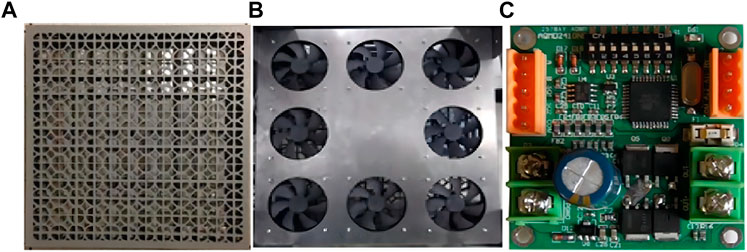
FIGURE 3. The prototype of active tile: (A) Front view, (B) back view, (C) fan speed controller.
To precisely evaluate the performance of the active tiles, measurements are conducted leveraging in-house built and commercially available tools. More specifically, we construct a thermal field and pressure monitoring tool to capture the rack temperature distribution and pressure differential between over and under floor. A hand-held air flow anemometer is used to measure the velocity of air flow out of tiles. Specifications of measurement instruments are briefly summarized in Table 1.
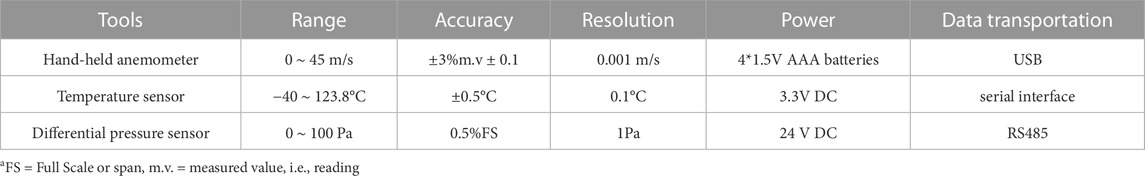
TABLE 1. Experimental tools’ specifications.
Thermal field and pressure differential monitoring tool. The structure of this tool is illustrated in Figure 4 where the temperature and pressure differential data are gathered in a Personal Computer (PC). Zigbee nodes attached with temperature sensors transmit temperature data periodically to a Zigbee WIFI gateway where data are routed to the PC via a wireless network. Pressure differential is captured by a differential pressure sensor and then transmitted to the PC via an RS-485 port. Sensors used in this monitoring tool are described as follows.
• Temperature sensors (Figure 5A) are packaged SHT 10 sensors produced by the Sensirion. The operating temperature range is −40∼123.8°C with ±0.5°C uncertainty at 25°C. The minimal sensitivity to temperature change is 0.1°C.
• The differential pressure sensor is shown in Figure 5B, whose pressure ports are lengthened using Polyvinyl Chloride (PVC) tubes in practical measurement. The measurement range is 0∼100 Pa. The sensor outputs digital signal in hexadecimal with uncertainty 0.5% FS (Full Scale) and resolution 1 Pa. Before the measurement begins, linking high and low ports for calibration is essential.
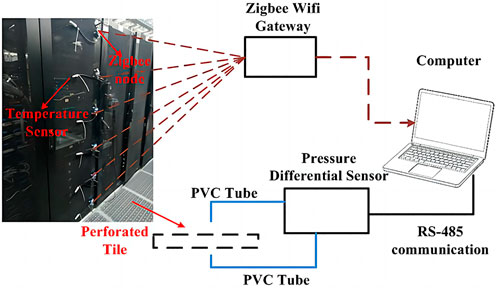
FIGURE 4. The framework of the temperature and pressure differential monitoring tool.
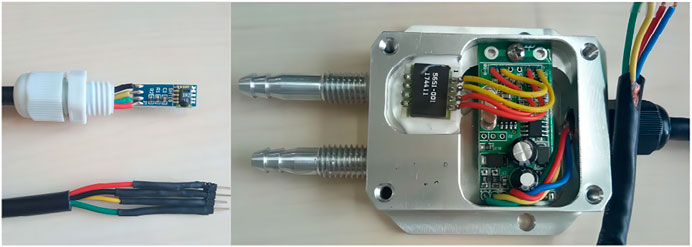
FIGURE 5. Measurement tools: (A) Temperature sensor, (B) differential pressure sensor.
Digital hand-held air flow anemometer. It captures the velocity of air flow through a wind wheel. The measurement range, accuracy, and resolution are 0∼45, ±3% ± 0.1, and 0.001 m/s, respectively. During the measurement process, it is noted that the wheel blades should be aligned with the air outlet to mitigate the air flow bypass. In addition, blades should be kept perpendicular to the flow direction.
Temperature. Rack inlets and outlets are deployed with temperature sensors equispaced from the bottom to the top with vertical distance 0.4 m. Temperature data are collected under 11 different tile configurations (passive tile and active tile fan speed adjusted from 10% to 100% with 10% granularity). Temperature measurement lasts for 30 min for each configuration to characterize the tile’s stationary behavior. Furthermore, measurement starts 10 min later than a configuration change to ensure that the environment achieves a steady state.
Air Flow Velocity. The airflow rate is severely non-uniform at the tile surface. It was observed that nearly 50% air flow velocity fluctuation occurred in different measuring points for a perforated tile (Pervila et al., 2013). In addition, during the real-time measurement, we also notice that the flow direction of different measuring points at the same tile surface is even opposite at some locations, i.e., the room air inversely flows into the underfloor plenum from a cold aisle at some measuring points. To facilitate the tile flow measurement, we place a carton (Figure 6) with the size same as the tile and the height of 43 cm above the tile to regulate the air flow direction and deter the air flow from diffusing and bypassing. The cross-section area of the carton is further divided into 3 × 3 sections. The overall tile flow rate is then estimated by averaging the sensor readings from all nine sections.
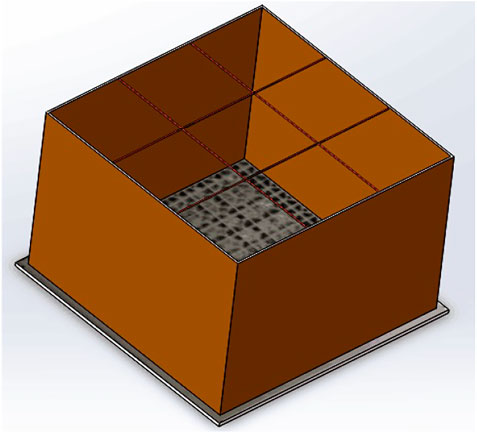
FIGURE 6. Tile flow regulation tool.
Pressure Differential. The airflow pressure differential between the underfloor plenum and cold aisle is one of the most important factors to determine the airflow rate out of tiles. Unfortunately, after interviewing with some large-scale data center operators, we found the pressure differential monitoring was absence in almost all of them. While the pressure differential was involved in several academic studies, e.g., the measurement-based pressure loss factor calculation (Arghode and Joshi, 2015) and the effect of the cold aisle and tile configuration on pressure (Arghode et al., 2016), there were no details about how pressure differential sensors were installed and used.
Based on extensive experiments, we note that the direction and the position of the pressure tube-end have significant effects on the measurement accuracy. The pressure differential measurement scheme in our experiments is presented in Figure 7. The sensor (Figure 5B) is fixed in the center of a cold tile at 0.6 m height above the floor, whose pressure ports are vertically towards the ground. High and low pressure ports are extended to the measurement point via two PVC tubes with 8 mm external diameter and 1.2 m length. An overlength connecting tube would lead to a large measurement error, so it should be as short as possible. One tube-end is on the surface above the perforated tile, and another is in the underfloor plenum. Both ends are opened downward as shown in Figure 7. In the experiments, we observed that quite significant variations exist in different measuring points of the same tile. For example, the pressure differential (the pressure of the underfloor plenum minus that of the cold aisle) is positive in most points, but negative values occasionally appear in others. Therefore, we use the same approach as in the tile flow measurement to compute the overall pressure differential.
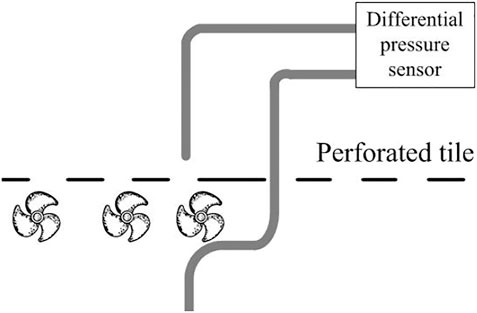
FIGURE 7. Pressure differential measurement for the active tile.
The performance of active tiles are evaluated from three aspects: rack inlet temperature, tile airflow velocity, and tile pressure differential. To select a position to carry out our experiments, the pressure differential of all passive tiles along a cold aisle is measured, which is illustrated in Figure 8, where values in the y axis are equal to subtracting the pressure of tile surface from that of under floor plenum. It is shown that there is remarkable difference in the tile pressure differential along a cold aisle. The pressure differential is negative for sections near the CRAC unit, whereas positive for regions far away from CRAC unit. This phenomenon arises from the Venturi effect, i.e., the cold air flowing out of CRAC blowers at a high speed creates a low-pressure region near the CRAC outlets, leading to a negative pressure differential. Since the rack D-03 has remarkable hot air recirculation and lies in the margin of positive and negative pressure differential, all the experiments are conducted in D-03 except in Section 4.3. In addition, there is gap between rack D-03 and tiles, whose effect on thermal performance is also investigated in Section 4.1.

FIGURE 8. Pressure differential vs. location for passive tiles.
We first investigate the impact of tile fan speed on thermal performance. The average inlet temperatures at different heights of rack D-03 are shown in Figure 9 where temperature curves reflect the thermal distribution with respect to various tile fans speeds. The passive curve refers to the case of traditional perforated tile without assisted fans rather than the unpowered active tile. The temperature of top regions in active tile cases is much lower (up to 4°C) than the passive case, because the amount of cold air supplied to the rack top is increasing with the tile fan speed and the hot air recirculation problem is mitigated. In the middle of rack D-03, the thermal performance in active tile cases is slightly poor than the passive case, which can be explained by that the cold air out of tiles at a higher momentum with the assistant of tile fans rapidly bypasses the rack and less cold air goes through servers to remove heat. The usage of active tile deteriorates the performance in the bottom region compared to the passive tile case. This is because the low pressure created by the Venturi effect due the increased air flow rate at tile surface. Hot air recirculated from the under-rack gap is responsible for the temperature increase in the bottom.
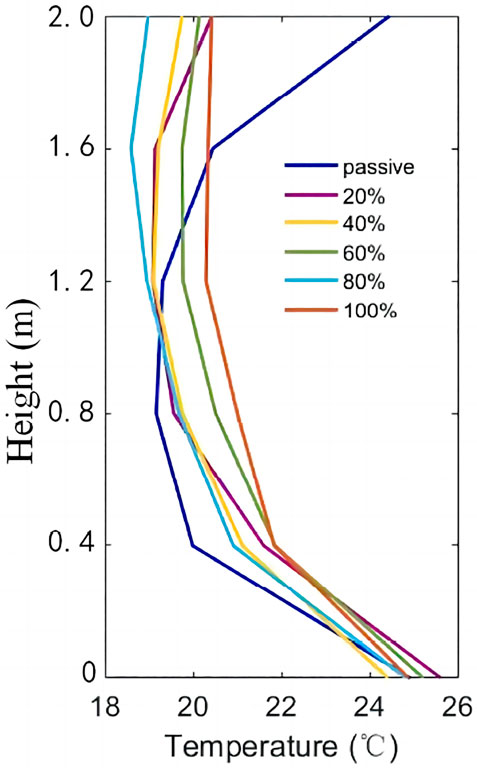
FIGURE 9. Rack inlet temperature distribution.
Further experiment is performed to investigate the effect of under-rack gaps on thermal distribution. The comparison of rack inlet temperatures for blocked and unblocked under-rack gaps at various tile fans speeds are illustrated in Figure 10, where significant thermal performance improvement at the rack bottom is observed when under-rack gaps are covered. Specifically, sealing the under-rack gap reduces the temperature at rack bottom by as much as 6°C at 20% tile fans speed and by over 4°C at other tile fan speed configurations. By contrast, Figure 10 only shows a slight change of rack inlet temperature at top and middle regions, which indicates that these areas are not prone to be affected by the under-rack gaps. To characterize the uniformity of rack inlet temperature distribution, we calculate the Temperature Variance (TV), defined as
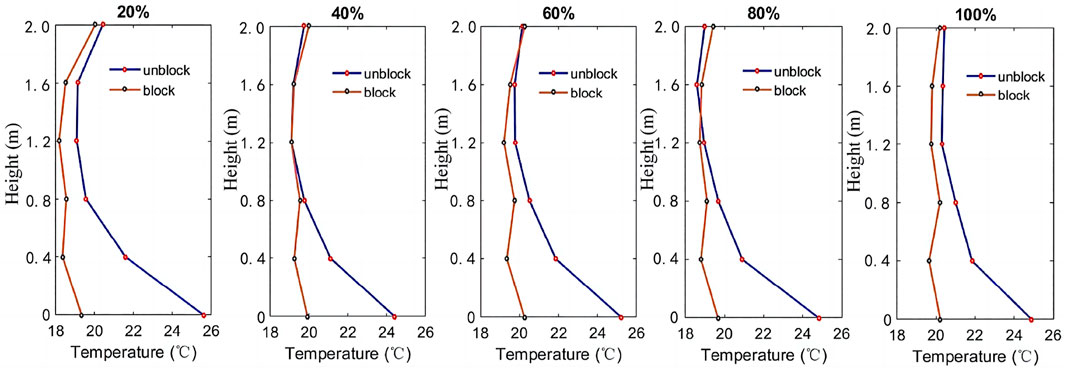
FIGURE 10. Comparison of rack inlet temperature for blocked and unblocked under-rack gaps.
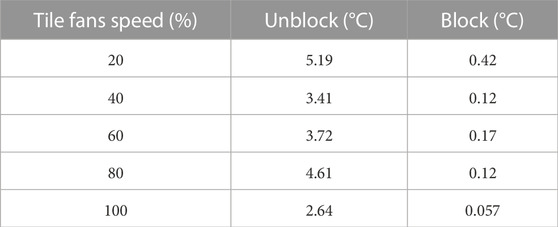
TABLE 2. TVs for both blocked and unblocked under-rack gaps at various tile fans speed.
The tile flow velocities for the passive tile and the unpowered active tile at the same porosity and CRAC blower speed are shown in Figure 11. The tile flow rate for the passive tile is much higher than that for the unpowered active tile (around 0.95 m/s vs. 0.45 m/s), which suggests that the unpowered active tile adds significant flow resistance. Note that our observation is inconsistent with Athavale et al. (2016), where the tile flow rate was approximately the same for both cases. This may be caused by various reasons such as different CRAC blower speeds, fan motor types, and tile fan geometries, etc.

FIGURE 11. Tile airflow velocity for passive and unpowered active tile.
The tile flow velocity for passive and active tiles at different fan speeds is compared from both transient (Figure 12A) and average perspectives (Figure 12B). It is observed that 1) the tile flow rate with the help of tile fans is much higher than that with the passive tile and 2) the flow rate generally increases with respect to the fan speed. Specifically, when the passive tile is replaced by an active tile with 10% fans speed, the average tile flow velocity jumps from 0.92 to 1.37 m/s, a 49% increase. It indicates that the active tile has a remarkable impact on the air flow performance. Furthermore, the average tile flow velocity increases by around 0.1 m/s as tile fans speed up by 10% until the speed achieves 70% of full capacity. Hereafter, the tile flow velocity increasing rate drops as tile fans speed up.
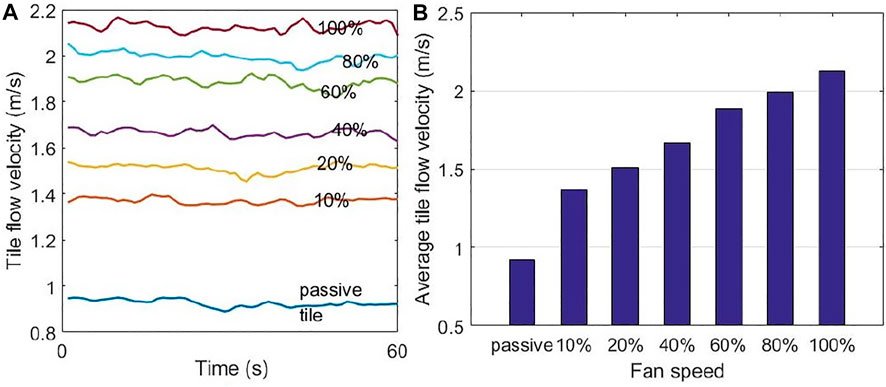
FIGURE 12. Comparison of tile flow velocity between passive and active tiles: (A) Transient, (B) average.
To precisely control the tile fan speed, it is necessary to establish an analytical model to estimate the tile flow rate for various fan speeds. Based on the measurement data, we use the regression technique to characterize the model by linear (Figure 13A) and quadratic (Figure 13B) polynomials, which are shown in Eqs 1, 2:
where V and x are the tile flow velocity and the tile fans speed, respectively. As analysed formerly, the quadratic function may be superior to the liner function in terms of prediction errors. This is further supported by some advanced metrics listed in Table 3: Sum of Squares due to Error (SSE), Root Mean Square Error (RMSE), and R-square. Formulating the air flow rate prediction model by the second order polynomial results in an SSE of 0.4509, which is approximately 0.41 lower than the first order polynomial model (0.8665). However, SSE only decreases slightly as higher order polynomials are used (the SSE are 0.43 and 0.42 for third and forth order polynomials, respectively). Therefore, the second order polynomial reaches a good tradeoff between prediction accuracy and computational complexity. The superiority of quadratic polynomial compared to the linear model is also reflected by RMSE (0.038 vs. 0.027). Another metric to represent the goodness of curve fitting is the R-square, which is defined by
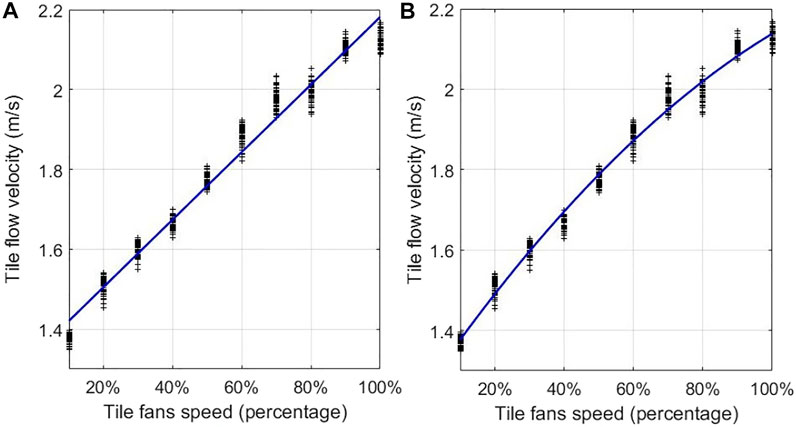
FIGURE 13. Tile air flow velocity is a function of the fan speed up, which is expressed by the polynomial with first order (A) and second order (B).

TABLE 3. Error metrics.
Figure 14 shows the tile pressure differential as a function of tile flow velocity achieved at different tile fans speeds from 10% to 100%. Here, the differential pressure is equal to PDtilesurface—PDplenum, i.e., the pressure above perforated tiles is higher than that below tiles. The pressure differential generally increases with the tile flow rate, since more cold air sucked from the plenum into cold aisles leads to a low pressure region below tiles. However, apparently the relationship is not linear. Therefore, we model it by a quadratic function as Eq. 3
where PD and V represent the pressure differential and the tile flow velocity, respectively. The average prediction error is about 1.8 Pa and cannot be improved remarkably using higher order polynomials.
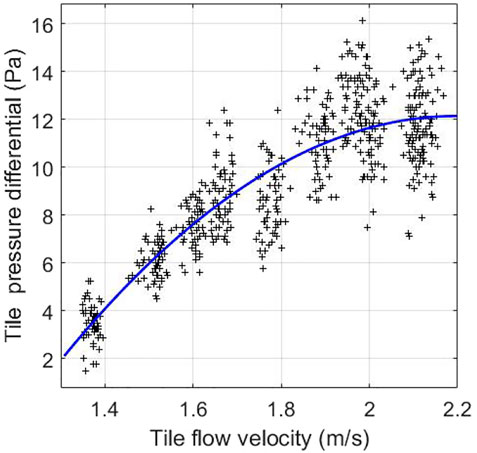
FIGURE 14. The tile airflow velocity vs. tile pressure differential.
We further investigate the joint effects of tile fan speed and tile pressure differential on tile flow velocity. Here, the tile pressure differential refers to the initial counterpart in passive case. Since the CRAC blower speed is not allowed to be adjusted arbitrarily due to operating regulations, we vary the initial tile pressure differential by moving the measurement point along the cold aisle (refer to Figure 8). Figure 15 demonstrates the results, where we observe that the active tile flow velocity only fluctuates slightly as the initial tile pressure differential lies within 1 ∼ 4 Pa, which means the impact of initial tile differential pressure on the active tile flow speed in our data center is tiny or even negligible.
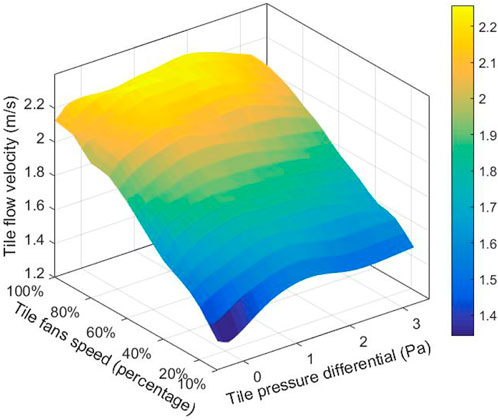
FIGURE 15. Relationship between pressure differential, fan speed and tile airflow velocity.
IT manufactures usually use the inlet temperature as a critical metric to justify whether the operating environment is reliable. However, as the airflow is very complex inside the machine room, the inlet temperature is often non-uniform. As a result, hot spots, which degrade the equipments performance and reliability, emerge. Therefore, prediction of the thermal distribution in rack inlet is essential. It also sheds some light on how to design control strategies to satisfy the IT equipment specification.
However, characterizing the air flow dynamics and heat transfer process is notoriously difficult. Traditional CFD approach is too time-consuming. Recently, some works demonstrated that Machine Learning (ML) can effectively model the thermodynamics based on data obtained in field experiments Mokhtari et al. (2021). In this section, leveraging ML technologies, several data-driven thermal distribution models mapping multiple environmental variables (height in rack box H, tile air flow velocity Vtile, and tile differential pressure DPtile) to the thermal distribution Trackinlet are constructed. The advantage of these ML-based models is that they generally require less computation time than the CFD approach. In addition, as we will see below, they provide estimation with satisfactory precision.
We use 3 ML techniques, namely, GPR, ANN, and MLR, to model the thermal distribution based on field measurement data set, which consists of 3100 input-output pairs where 2500 pairs are used as the training data set and the remainder are used for testing. For different ML methods, this prediction errors are compared and analyzed.
Gaussian Process (GP)-based ML Rasmussen and Williams (2006) is a supervised learning method after the widely-used Support Vector Machine (SVM). It is an effective solution to both regression and classification problems in machine learning and statistics. A GP is a stochastic process where a set of random variables are indexed by continuous domain, e.g., time or space, and it is completely specified by its mean function and covariance function. A real process f(x) with mean function m(x) and covariance function k(x, x′) is defined as Eqs 4, 5.
Specific to the GPR in this work, it is assumed that the prior distribution of observations y is Eq. 6.
where setting the mean function as 0 is a common choice.
Giving n* testing points (X*, y*), the joint prior distribution of the training outputs y and test outputs y* is Eq. 7.
where K(X,X*) is a n × n* covariance matrix quantifying the similarity of training and test points and similarly for the other entries K(X, X), K(X*, X) and K(X*, X*). The expected function values y*, i.e., the prediction values, can be generated by Eq. 8.
The artificial neural network as an intelligent machine learning method can precisely express the non-linear relationship between input variables and output results. The neural network topology used in this experiment is shown in Figure 16, which consists of three layers-an input layer, a hidden layer, and an output layer. The architecture of this neural network is (3-14-1), i.e., three, fourteen, and one neurons are set in input, hidden, and output layers, respectively. Every neuron in a layer is linked to all neurons in adjacent layers and the dependence is expressed by the connection weight. Denote βj as the output of neuron j in the hidden layer and y as the final output, we have Eqs 9, 10.
where f(x) is the ReLU activation function defined as Eq. 11.
In Eqs 9, 10, v and w are connection weights, and b is the bias term. Weights v and w are iteratively updated in the training process to minimize the loss function (12), where
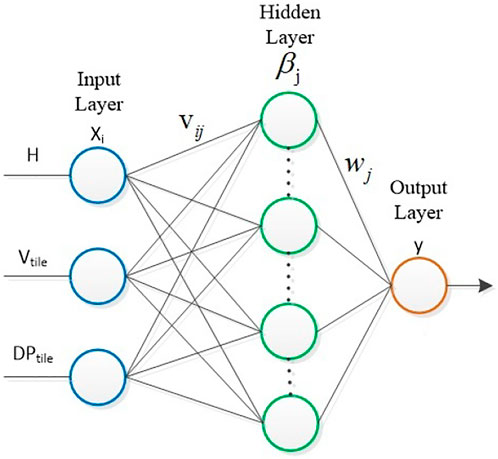
FIGURE 16. Neural network topology.
The number of nodes in the hidden layer has a crucial effect on the model accuracy. To develop an appropriate model for the temperature prediction, extensive configurations with different number of neurons in the hidden layer are considered. The performance of multiple ANN models is shown in Figures 17, 18. We see that MAE converges as the training proceeds to around the 2*104th iteration. Furthermore, the lowest MAE can be found for ANN with 14 neurons in the hidden layer. Therefore, the (3-14-1) architecture is selected as the prediction model.

FIGURE 17. MAE vs. number of iterations in ANN training.
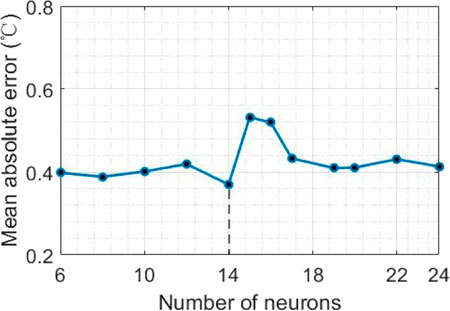
FIGURE 18. MAE vs. the number of neurons in the hidden layer.
In this paper, the relationship between input features x and the output target y is assumed as a linear function, so their relevance is expressed by the following multivariate linear equation Eq. 13.
where
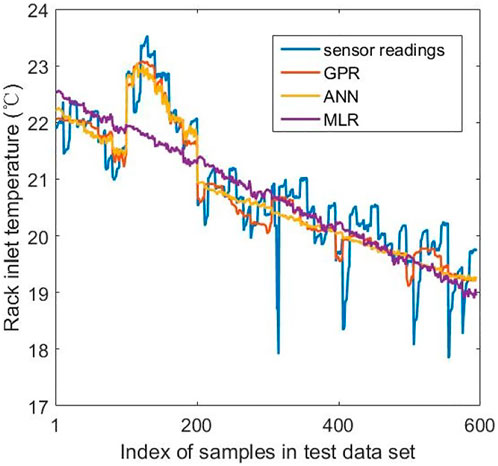
FIGURE 19. Comparison of predicted & measured temperature.
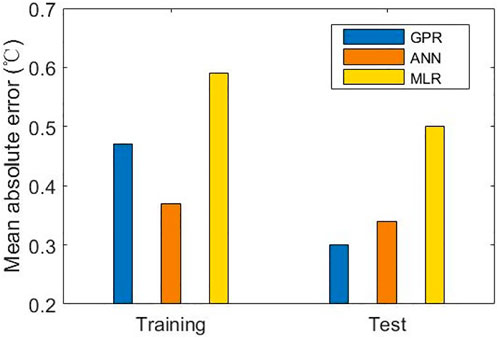
FIGURE 20. Comparison of prediction accuracy in terms of MAE.
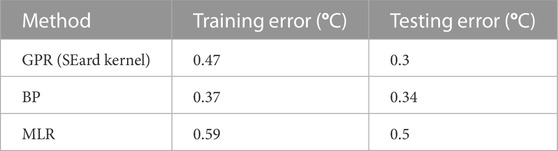
TABLE 4. Prediction errors.
Accurate thermal modeling of the active tile is the prerequisite for designing advanced control policies to improve the energy efficiency in data centers. In this paper, we study the cooling performance of active tiles in a production data center. Our contributions can be summarized as follows:
1. A prototype of active tile, integrated with fans, a speed controller, and a power supply, is designed and deployed into a real data center. Thermal performance data are collected using an in-house developed measurement system based on Wireless Sensor Network (WSN).
2. Comparative studies of the rack inlet temperature distribution and tile air flow characteristics are conducted with respect to various system configurations, e.g., with or without tile fans, different tile fan speeds, whether under-rack gaps are blocked, etc. The active tile remarkably improves the local cooling efficiency for the peripheral rack in an open cold aisle. A surprising observation which does not consist with previous study is that the unpowered active tile adds significant flow resistance such that the tile flow rate suffers from a significant reduction compared with the passive tile. Sealing the under-rack gaps significantly promotes the thermal field uniformity over the rack inlet.
3. Three machine learning approaches, i.e., Gaussian Process Regression (GPR), Artificial Neural Network (ANN), and Multivariate Linear Regression (MLR), are used to construct thermal performance prediction models for an active tile. The performance of multiple approaches is analyzed with respect to Mean Absolute Error (MAE). It is shown that GPR and ANN models have better accuracy with MAE around 0.3°C, compared to MLR where MAE is around 0.5°C.
The original contributions presented in the study are included in the article/supplementary material, further inquiries can be directed to the corresponding author.
Conceptualization, HG and QY; Methodology, QY; Software, LF; Validation, LL; Formal analysis, QY; Investigation, HG; Data curation, YK; Supervision, LL; All authors have read and agreed to the published version of the manuscript.
This work was supported in part by the National Key R and D Program of China (No. 2021YFB2700604); in part by Hainan Province Science and Technology Special Fund (No. GHYF2022010); in part by the Finance Science and Technology Project of Hainan Province (No. ZDKJ2020009); in part by the Research Startup Fund of Hainan University under Grant KYQD(ZR)-21071; in part by Inner Mongolia Key Technological Development Program under Grants 2021CG0033 and 2022YFSJ0013; in part by Inner Mongolia Research Program for Young Talents under Grants NJYT23055 and NJYT22084; in part by Basic Scientific Research Program of Inner Mongolia Colleges under Grant JY20220078, and in part by Local Scientific Research and Development Program under Grant 2022ZY0169.
The authors declare that the research was conducted in the absence of any commercial or financial relationships that could be construed as a potential conflict of interest.
All claims expressed in this article are solely those of the authors and do not necessarily represent those of their affiliated organizations, or those of the publisher, the editors and the reviewers. Any product that may be evaluated in this article, or claim that may be made by its manufacturer, is not guaranteed or endorsed by the publisher.
Arghode, V. K., and Joshi, Y. (2015). Experimental investigation of air flow through a perforated tile in a raised floor data center. J. Electron. Packag. 137, 011011. doi:10.1115/1.4028835
Arghode, V. K., Sundaralingam, V., and Joshi, Y. (2016). Airflow management in a contained cold aisle using active fan tiles for energy efficient data center operation. Heat. Transf. Eng. 37, 246–256. doi:10.1080/01457632.2015.1051386
Athavale, J., Joshi, Y., and Yoda, M. (2018b). “Artificial neural network based prediction of temperature and flow profile in data centers,” in 17th IEEE ITHERM Conference, San Diego, CA, United states, 871–880.
Athavale, J., Joshi, Y., and Yoda, M. (2018a). Experimentally validated computational fluid dynamics model for data center with active tiles. J. Electron. Packag. 140, 010902. doi:10.1115/1.4039025
Athavale, J., Joshi, Y., Yoda, M., and Phelps, W. (2016). “Impact of active tiles on data center flow and temperature distribution,” in 15th IEEE Intersociety Conference on Thermal and Thermomechanical Phenomena in Electronic Systems (ITherm), Las Vegas, NV, United states.
Data center of Inner Mongolia Meteorology Information Center (2019). Data center of Inner Mongolia Meteorology Information Center.
Delforge, P. (2014). America’s data centers are wasting huge amounts of energy. New York, NY: National Resources Defense Council Issued Brief.
Fulpagare, Y., Hsu, P.-H., and Wang, C.-C. (2022). Experimental analysis of airflow uniformity and energy consumption in data centers. Appl. Therm. Eng. 209, 118302. doi:10.1016/j.applthermaleng.2022.118302
Hu, B., Lin, C.-X., Patel, D., Joshi, Y., Vangilder, J., and Seymour, M. (2020). “A comprehensive cfd study of tile flow rate distribution in a compact data center laboratory,” in 2020 19th IEEE Intersociety Conference on Thermal and Thermomechanical Phenomena in Electronic Systems (ITherm) (IEEE), 374–382.
Khalili, S., Mohsenian, G., Desu, A., Ghose, K., and Sammakia, B. (2019). “Airflow management using active air dampers in presence of a dynamic workload in data centers,” in 2019 35th Semiconductor Thermal Measurement, Modeling and Management Symposium (SEMI-THERM) (IEEE), 0101–0110.
Li, C., and Li, J. (2021). Passive cooling solutions for high power server cpus with pulsating heat pipe technology. Front. Energy Res. 9, 755019.
Ling, Y.-Z., Zhang, X.-S., Zhang, K., and Jin, X. (2017). On the characteristics of airflow through the perforated tiles for raised-floor data centers. J. Build. Eng. 10, 60–68. doi:10.1016/j.jobe.2017.01.002
Miyuru Dayarathna, Y. W., and Fan, R. (2016). Data center energy consumption modeling: A survey. IEEE Commun. Surv. Tutorials 18, 732–794. doi:10.1109/comst.2015.2481183
Mohsenian, G., Khalili, S., and Sammakia, B. (2019). “A design methodology for controlling local airflow delivery in data centers using air dampers,” in 2019 18th IEEE Intersociety Conference on Thermal and Thermomechanical Phenomena in Electronic Systems (ITherm) (IEEE), 905–911.
Mohsenian, G., Khalili, S., Tradat, M., Manaserh, Y., Rangarajan, S., Desu, A., et al. (2021). A novel integrated fuzzy control system toward automated local airflow management in data centers. Control Eng. Pract. 112, 104833. doi:10.1016/j.conengprac.2021.104833
Mokhtari, R., Fakouriyan, S., and Ghasempour, R. (2021). Investigating the effect of cloud cover on radiative cooling potential with artificial neural network modeling. Front. Energy Res. 9, 658338. doi:10.3389/fenrg.2021.658338
Nada, S., Said, M., and Rady, M. (2016). Numerical investigation and parametric study for thermal and energy management enhancements in data centers’ buildings. Appl. Therm. Eng. 98, 110–128. doi:10.1016/j.applthermaleng.2015.12.020
Pervila, M., and Kangasharju, J. (2013). “Underfloor air containment,” in IEEE Online Conference on Green Communications (OnlineGreenComm), Piscataway, NJ, United states (), 96–101.
Phan, L., Hu, B., and Lin, C.-X. (2019). An evaluation of turbulence and tile models at server rack level for data centers. Build. Environ. 155, 421–435. doi:10.1016/j.buildenv.2019.03.060
Rasmussen, C. E., and Williams, C. K. I. (2006). Gaussian processes for machine learning. Cambridge, MA, USA: The MIT Press.
Song, Z. (2016a). Numerical cooling performance evaluation of fan-assisted perforations in a raised-floor data center. Int. J. Heat Mass Transf. 95, 833–842. doi:10.1016/j.ijheatmasstransfer.2015.12.060
Song, Z. (2016b). Thermal performance of a contained data center with fan-assisted perforations. Appl. Therm. Eng. 102, 1175–1184. doi:10.1016/j.applthermaleng.2016.03.157
Wan, J., Zhou, J., and Gui, X. (2021). Intelligent rack-level cooling management in data centers with active ventilation tiles: A deep reinforcement learning approach. IEEE Intell. Syst. 36, 42–52. doi:10.1109/mis.2021.3049865
Xiong, X., and Lee, P. S. (2021). Vortex-enhanced thermal environment for air-cooled data center: An experimental and numerical study. Energy Build. 250, 111287. doi:10.1016/j.enbuild.2021.111287
Zhang, S., Liu, X., Ahuja, N., Han, Y., Liu, L., Liu, S., et al. (2015). “On demand cooling with real time thermal information,” in 2015 31st Thermal Measurement, Modeling & Management Symposium (SEMI-THERM), San Jose, CA, United states (), 138–146.
Zhang, Y., Fan, C., and Li, G. (2022). Discussions of cold plate liquid cooling technology and its applications in data center thermal management. Front. Energy Res. 953. doi:10.3389/fenrg.2022.954718
Zhou, R., Wang, Z., Bash, C. E., McReynolds, A., Hoover, C., Shih, R., et al. (2011). A holistic and optimal approach for data center cooling management. Am. Control Conf., 1346–1351.
Keywords: active tiles, data center, energy efficiency, thermal management, thermal modeling and evaluation
Citation: Gao H, Yue Q, Kou Y, Wan J, Li L and Fu L (2023) Performance evaluation and modeling of active tile in raised-floor data centers: An empirical study on the single tile case. Front. Energy Res. 11:1073879. doi: 10.3389/fenrg.2023.1073879
Received: 19 October 2022; Accepted: 03 February 2023;
Published: 17 February 2023.
Edited by:
Wei Ding, Helmholtz Association of German Research Centres (HZ), GermanyCopyright © 2023 Gao, Yue, Kou, Wan, Li and Fu. This is an open-access article distributed under the terms of the Creative Commons Attribution License (CC BY). The use, distribution or reproduction in other forums is permitted, provided the original author(s) and the copyright owner(s) are credited and that the original publication in this journal is cited, in accordance with accepted academic practice. No use, distribution or reproduction is permitted which does not comply with these terms.
*Correspondence: Qiuling Yue, eXVlcWl1bGluZ0BoYWluYW51LmVkdS5jbg==
Disclaimer: All claims expressed in this article are solely those of the authors and do not necessarily represent those of their affiliated organizations, or those of the publisher, the editors and the reviewers. Any product that may be evaluated in this article or claim that may be made by its manufacturer is not guaranteed or endorsed by the publisher.
Research integrity at Frontiers
Learn more about the work of our research integrity team to safeguard the quality of each article we publish.