 Yafei Wang
 Weijun Gao
 You Li
 Fanyue Qian
 Wanxiang Yao5
95% of researchers rate our articles as excellent or good
Learn more about the work of our research integrity team to safeguard the quality of each article we publish.
Find out more
ORIGINAL RESEARCH article
Front. Energy Res. , 06 February 2023
Sec. Process and Energy Systems Engineering
Volume 11 - 2023 | https://doi.org/10.3389/fenrg.2023.1010846
This article is part of the Research Topic Advanced Technologies of Integrated Energy System for Carbon Neutrality View all 7 articles
Distributed energy resources are important measures to increase energy self-sufficiency and overcome the global carbon reduction problem. However, individual planned renewable energy generation poses a significant threat to the power grid. Therefore, virtual power plant (VPP) is attracting considerable attention as a means of aggregating distributed energy in urban areas. This study proposed a VPP model consisting of updating high-efficiency appliances and photovoltaic and energy storage systems. A comprehensive analysis for assessing the technical, economic, and environmental benefits derived from the VPP was presented, indicating the feasibility of a smart community to achieve power self-sufficiency with the support of the VPP. A smart community in Japan was selected as the research object, with a peak power demand of 57,350 kW. The VPP’s load leveling performance, return on investment (ROI), and CO2 emission reduction were analyzed. In addition, external factors, such as electricity price changes and FiT policies, are considered to assess the impact on the economics of the VPP. The results show that the introduction of the VPP system in the community can effectively stabilize the grid load with a peak shaving rate reaching 42.55% and improve the energy self-sufficiency rate of the region reached 100%, besides providing superior economic and environmental benefits (16.26% CO2 emission reduction) on the demand side. Furthermore, the economic performance of VPP shows a good prospect with the fall in equipment prices and the future trend of carbon tax growth. This study provides important insights into the development of VPP in other countries, especially for low-energy self-sufficiency regions.
Consumption of fossil fuels has an increasing trend because of the high growth rate of energy demand, which increases global greenhouse gas (GHG) emissions. Since the Fukushima crisis in 2011, Japan has increased its use of fossil fuels, resulting in a rapid increase in GHG emissions in the energy sector. In 2013, it emitted a record 1.4 billion tons of GHG. Our overreliance on traditional energy sources and strategies has caused environmental degradation, climate change, and various geopolitical issues. As an important environmental issue, global warming diverts governments’ attention toward energy systems with low carbon emissions. Japan has committed to reducing its GHG emissions by at least 46% by 2030 and achieving net zero emissions by 2050, which is one of the world’s most laudable climate goals, given the unique challenges the country faces (IEA, 2021). In addition, the building sector accounts for more than 50% of the electricity usage in different countries, leading to significant GHG emissions (Li et al., 2018; Srivastava et al., 2019). Consequently, all countries worldwide are progressively transforming their energy systems for the building sector to accomplish the Paris Agreement goals.
Development and construction can be achieved by optimizing energy demand and changing energy supply. The Japanese government has been promoting the concept of energy conservation for a long time. Wakiyama and Kuramochi (2017) indicated that electricity consumption in the residential sector could be reduced by introducing energy-saving technologies in Japan. Energy-efficient technologies help reduce total electricity use and maintain the reduction level over time by replacing inefficient technologies with high-efficiency devices (Nishio, 2015). Meanwhile, the penetration of renewable energy resources, such as solar and wind, also allows Japan to reduce its dependence on energy imports and realize the decarbonization goal. According to D’AMBROGIO (2021), Japan will generate 50%–60% of its electricity from renewable sources by 2050. In particular, solar and wind energy will play an important role in the future in countries with low energy self-sufficiency rates. However, as renewable energy increases, its intermittent output puts management pressure on the public grid and system. Under these circumstances, the vulnerability of the energy system has become more obvious. Therefore, energy storage is essential to balance the renewable power system. A new concept called a virtual power plant (VPP) has been proposed to resolve the aforementioned problems.
A VPP is a practical concept that aggregates various renewable energy sources (RESs) to enhance energy management efficiency and promote energy trading (Rouzbahani et al., 2021). The VPP is receiving increasing attention as a means of integrating distributed energy systems (DESs) to provide stable electricity. Compared with conventional power plants, the VPP has substantial advantages in terms of efficient transmission infrastructure, flexible physical characteristics, and highly regulated control architectures (Bhuiyan et al., 2021). Essentially, VPPs are clusters of distributed generation resources, energy storage systems, and controllable loads connected to a centralized entity that superintends the energy flow within the aggregation (Setiawan, 2007). VPP can be divided into commercial VPP (CVPP) and technical VPP (TVPP) (Bhuiyan et al., 2021). The main objective of CVPP is financial efficiency. However, TVPP is always associated with complex computations and analysis, as well as technological applications.
The financial efficiency of CVPP participation in the energy market has been widely discussed in many studies. Baringo et al. (2021) discussed strategies for the provision of VPP for participation in energy and reserve power markets. Shabanzadeh et al. (2017a) and Shabanzadeh et al. (2017b) proposed the modeling of a cooperation system among neighboring CVPPs to maximize the opportunities for power commercialization. Ju et al. (2019) designed a novel concept of power-to-gas-based VPP and considered the variability of VPP profits when risk management participates in competitive markets. Zapata Riveros et al. (2015) provided a stochastic optimization evaluating the optimal bidding strategy of a VPP considering combined heat and power and intermittent renewables. Pandžić et al. (2013) considered a VPP composed of an intermittent source, a storage facility, and a dispatchable power plant, which sells and purchases electricity in both the day-ahead and the balancing markets to maximize its profit. Dietrich et al. (2015) maximized the profit of the VPP and minimized the cost of self-consumption of the VPP by the iterative process using the CPLEX solver. Ju et al. (2022) took the Lankao Rural Energy Revolution Pilot program as an example and proposed a benefit allocation strategy based on Nash negotiations, considering the following factors of risks, benefits, and carbon emission reduction. Naval and Yusta (2021) addressed the participation of VPPs in different electricity markets. The aforementioned studies have well demonstrated the economic feasibility of CVPPs for power commercialization. CVPP can be seen as an aggregator between DERs and the energy market, as it can trade energy on behalf of smaller DERs unable to participate in the electricity market. As CVPP only performs commercial aggregation, the network limitations and the impact on power load are not always considered in its operation.
Regarding TVPP, several studies have focused on the energy management and dispatching of various distributed energy sources (DESs). In view of energy management, Kasaei et al. (2017) developed an optimization meta-heuristic algorithm to determine the optimal energy management of a VPP with RESs, energy storage, and load control in a case study. Azimi et al. (2021) presented the energy management of industrial VPPs using demand response loads and available electric vehicles in car parks to improve grid reliability under peak load conditions. Yang et al. (2021) developed a blockchain-based energy management platform for a VPP. For optimal scheduling, Liu (2022) proposed a multiple-region VPP optimal scheduling method for multi-energy complementarity and low carbon, which solves the threat of high-permeability renewable energy power generation and grid connection faced by the VPP. Rahimi et al. (2021) modeled a stochastic scheduling problem for a VPP while considering network security constraints and uncertainties in power and thermal loads, wind speed, solar radiation, and market prices to satisfy thermal and electrical loads. Sheidaei and Ahmarinejad (2020) proposed a hierarchical model for the simultaneous modeling of microgrid scheduling and VPPs energy management problems. Technologies for integrating different DESs are also a popular topic worldwide. Tan et al. (2021) proposed a VPP model containing carbon capture devices, explored the cooperative operation mode of a carbon capture system and power-to-gas, and developed a comprehensive demand response mechanism for the VPP. Naval et al. (2020) presented a VPP combining large- and small-scale distributed renewable energy generation technologies, and its practical application in the operation of irrigation systems is introduced. Royapoor et al. (2020) aggregated various controllable loads in a commercial office building, including air conditioning, lighting, and elevators, into heterogeneous and reliable components of a VPP and described the substantial flexibility that exists in commercial office buildings. The reviewed studies generally presented models that include control variables of different types of DESs and discussed the optimization of power flow, network architectures within VPPs, and operational specification solutions. However, few of these models involve a combination of distributed rooftop PV self-consumption facilities, energy storage devices, and the management of building-side efficient appliances (this combination of the VPP model always has great application potential in urban areas).
In the current academic field of VPP, the practice of integrating VPP with communities to achieve energy self-sufficiency has limitations. A simulation case study selected a coastal site in Hong Kong comprising eight high-rise residential buildings and two mid-rise office buildings to evaluate the technical and economic feasibility of a zero-energy community using a hybrid offshore wind and tidal stream energy generation (Li M. et al., 2022), and the carbon emission reduction potential was identified. Another simulation case study in Cairo, Egypt, has been conducted to explore different RESs, and different building materials were used to reduce energy consumption and carbon emissions in a community (Fouad et al., 2020). A recent study proposed the concept of Building VPP (Luo et al., 2021), discussing building design and supporting technologies for aggregating buildings into VPP. However, these case studies are based on simulation data and are rarely supported by real-world data. In real-world cases, different building types (e.g., residential, office, commercial, and industrial), geographical locations, and technology combinations will lead to different energy consumption patterns.
Diversification of power loads and uncertainty of renewable energy generation pose challenges to conventional power system operation. According to the aforementioned studies, much uncertainty still exists:
(1) Because of the maturity of the technology, most of the current studies focused on directly connecting to the public grid after integrating distributed energy sources. However, relatively little attention has been paid to the potential, benefits, and feasibility of coupled small-scale photovoltaic energy storage systems (PV-ESSs) and building efficient appliances.
(2) Most studies on VPP are based on idealized software simulations and lack of variation in building types. There is limited knowledge of the VPP design with the goal of regional energy self-sufficiency and the corresponding grid load matching the performance of VPP systems deeply integrated into communities, which is affected by the demand side’s electricity usage characteristics.
To address the aforementioned knowledge gaps, the novelty of this research is as follows:
(1) A VPP model comprising RESs, ESSs, and updated high-efficient appliances was proposed to realize energy self-sufficiency. The effects of each technology applied to different types of buildings are investigated, and the sensitivity analysis between different technologies of VPP is evaluated.
(2) The proposed VPP model was introduced into the community, and the effect after the formation of VPP was simulated. The load characteristics of the community and the corresponding load-matching performance after the formation of the VPP were investigated. The technical, economic, and environmental performances were comprehensively compared based on the demand side.
The remainder of this study is structured as follows: Section 2 introduces the comprehensive methodology, including the optimization and analysis approach of VPP. Section 3 briefly describes the research area, data source, and data pre-processing. Section 4 presents a case study of VPP based on real-world data. Section 5 provides a sensitivity analysis of VPP. Finally, Section 6 summarizes the paper.
Although distributed energy is already widely used worldwide, a concern remains about how to efficiently aggregate and integrate various resources within a community. Against this background, the VPP in this research comprises power-saving technology, distributed photovoltaic (PV), and ESSs. Figure 1 briefly describes the main components of the proposed VPP system, electricity, cash, and information flow. The system boundary is set at the interface with the public grid. The community-owned co-generation power plant and rooftop PV are the main power generators for self-sufficiency. Considering the limited capacity of the co-generation power plant and the intermittence of the PV generation, the community energy system is also connected to the public grid to guarantee a reliable power supply. All buildings are consumers. The planning of the VPP is considered in two stages. First, in terms of electricity demand reduction, high-efficiency appliances (e.g., lighting and AC) are responsible for energy saving to reduce the power demand directly (Step 1). Then (Step 2), the electricity from renewable sources will be consumed by demand sides. In addition, the surplus and shortage of renewable energy can cause the community to export or import power from the public grid at any time of the year. Consequently, the ESS not only stores unconsumed electricity generated by PV, but also has the effect of load leveling in the proposed VPP system. It is worth noting that the aforementioned technologies (including energy-saving technologies, rooftop PV, and energy storage systems) are all distributed rather than centrally deployed. Therefore, the building sector is no longer a mere consumer; it has been converted into a prosumer. The ability to perform energy arbitrage is the biggest motivation for individual users to install distributed technologies. Improving the economic benefits of distributed application technologies on the demand side will facilitate negotiations and profit allocation among upstream stakeholders (government and power contractors). Meanwhile, this is the keystone of the realization of VPP. In the proposed energy-saving technology system, rooftop PV directly reduces electricity bills by reducing electricity demand or by self-supply. The individual EESs are aggregated into a large portfolio to provide community-scale ancillary services (load leveling). Thus, ESS can gain revenue based on optimal market management. Therefore, an overview analysis of the introduction of VPP in the community from the perspectives of “electricity production,” “electricity storage,” and “electricity saving” will be proposed. The aforementioned three aspects will also determine the capacity of the VPP.
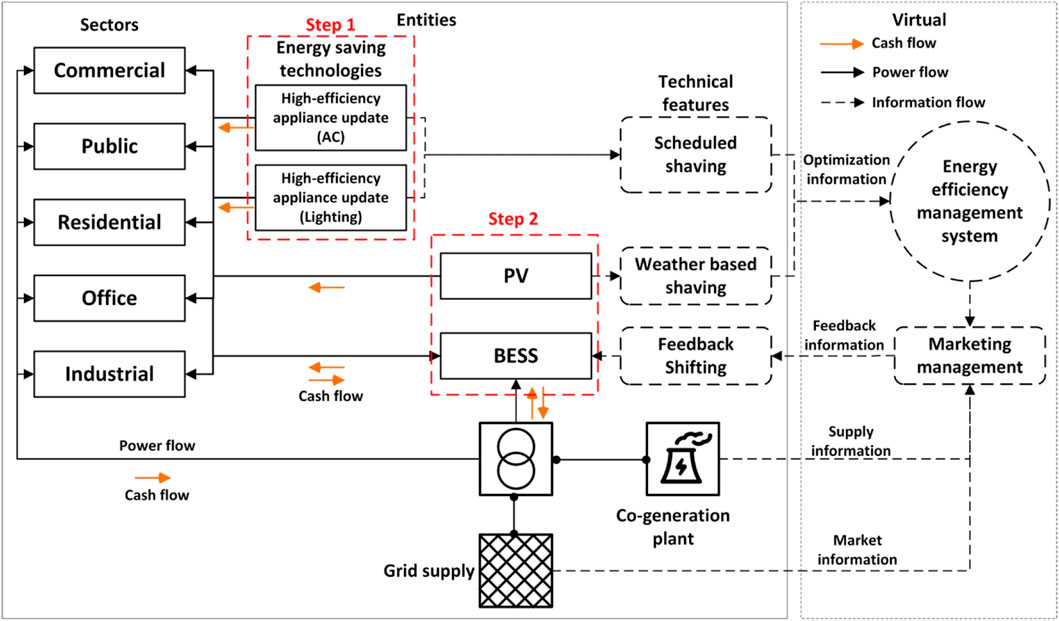
FIGURE 1. System description of the proposed VPP model.
According to the decomposition of carbon emission change factors from 2006 to 2019 by the Ministry of the Environment of (Japan), energy conservation measures contributed more emission reductions until 2011. However, electricity-saving measures were insignificant (even increased carbon emissions in 2007 and 2010). The demand side can reduce energy consumption by upgrading the building with advanced high-efficiency appliances (HEA), such as lighting and air conditioner, which are responsible for a large amount of energy consumption in buildings. Power consumption reduction through improving the electricity efficiency of the appliances can be seen as the VPPs formed among the aggregated buildings on the demand side (Li et al., 2017). Load shedding potential through updating HEA in the building sector will be modeled in this part. According to the Agency for Natural Resources and energy, compared to 10 years ago, high-efficiency lighting can save 20%–86% of electricity. Fluorescent lamps were mainly popular in the market 10 years ago. Therefore, the replacement of fluorescent lamps with LED lamps was adopted with an average energy-saving rate of 21% in the residential sector and 24% in the office, commercial, and public sectors (METI, 2022b; ESCO, 2022). Moreover, high-efficiency AC was updated with an average energy-saving effect of 17% (METI, 2022a).
The HEA update can provide persistent power demand reduction regardless of time. The energy saved by HEA can be described as follows:
Here,
There are many distributed generation technologies. Currently, gas turbine units, wind turbines, and PV are relatively mature distributed generation technology (Zhang et al., 2023). Tidal stream energy and offshore wind energy also attract the attention of many researchers (Fouz et al., 2022; Hoeser and Kuenzer, 2022). The development of renewable and clean energy sources offers a great prescription to ease the increasingly serious energy crisis and environmental issues. PV systems are an essential substitution energy source with a wide range of applications (Azarpour et al., 2022). The maturity of PV technology has been well-studied by many researchers (Ogunjuyigbe et al., 2016; Ghosh and Norton, 2019). Numerous studies have shown that widespread urban rooftop PV deployments can cover a significant portion of electricity consumption (Al-Saqlawi et al., 2018; Schardt and te Heesen, 2021). Kobashi et al. (2021) proposed an integrated system of cities’ rooftop PV and EVs providing affordable and dispatchable electricity to urban research without CO2 emission. In the “2050 Carbon Neutral and Green Growth Strategy,” the plan for the PV industry is included in the “Home and Office” section. This reflects the close integration between Japanese PV power generation and building. Due to terrain constraints, Japan lacks large-scale centralized PV power generation sites, so distributed building attached PV is the main direction of PV development. Its main function is to generate electricity, which does not conflict with the function of the building, does not destroy or weaken the function of the original building, and is not restricted by the site. While renewable energy is widely believed to reduce carbon emissions, challenges, such as the intermittency of renewables, will pose increasing pressure on the stability of the main grid. Consumption of renewable energy locally instead of interacting with the main grid can be one of the solutions. As the FiT price of PV power is declining year by year, dropping to 10 JPY/kWh in 2022, the self-consumed PV gains increasing popularity.
The life expectancy of the PV system used in this research is 20 years. In this research, we adopt Panasonic’s PV module with a unit price of 250,000 JPY/kW (1 USD = 108 JPY; this price already includes the PV panel, construction, and invertor fees, as well as other fees). The module dimension is 1.26 m2 with a capacity of 250 W (Panasonic Industry, 2022). The weather data in Kitakyushu are shown in Table 1. The PV power generation can be described as

TABLE 1. Weather data in Kitakyushu (JMA, 2022).
Here,
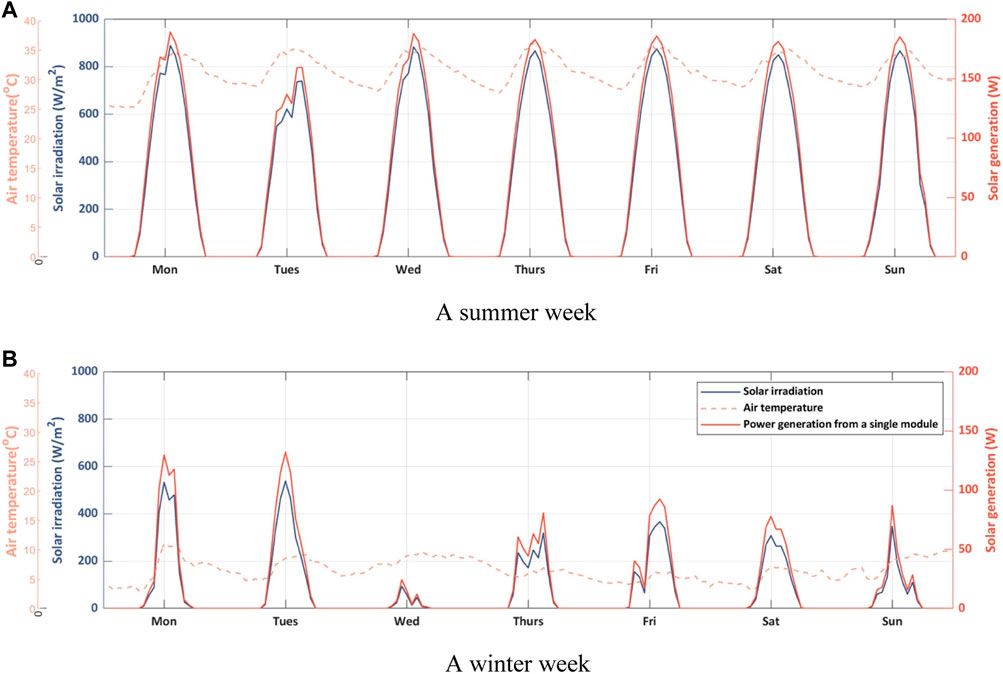
FIGURE 2. Weather factors and PV generation of typical weeks: (A) a summer week, (B) a winter week.
Here,
The weather factors for a summer week and a winter week are shown in Figure 2, and the power generation of a single PV module (250 W) is calculated according to Eq. 4–6.
Because the instability of renewable energy power generation poses a risk to the safety and reliability of the power grid, in regard to providing high-quality power, the renewable energy generation system should be incorporated with other power sources to ensure a steady supply of electricity and increase the local utilization of renewable energy. Galvan et al. (2020) demonstrated that networked microgrids with rooftop solar PV and battery storage systems could improve distribution grid resilience to natural disasters. As an attractive option, ESS can significantly increase the availability of loads while being insufficient to provide long-term energy demand (Ren et al., 2016; Li et al., 2022c). In this research, we select the sodium-sulfur (NAS) battery with a life expectancy of 15 years or approximately 4,500 charge/discharge cycles (NGK, 2022). The charge–discharge efficiency of the NAS battery is 0.9, and there is no self-discharge (Divya and Østergaard, 2009; Rodrigues et al., 2015). The unit price of this NAS ESS is 25,000 JPY/kWh. In this research, the ESS is restricted to work within an allowable range.
An important characteristic of the ESS is the time coupling characteristic in relation to the charge–discharge status (
Here,
There is always a balance between PV generation, energy saved by high-efficiency appliances, the grid, and the actual demand, which can be calculated as follows:
Here,
where
There are two stages for ESS, and it cannot be charged and discharged simultaneously. First is the charging state: when there is surplus PV power generation, for example, when
The second is the discharging state: when there is insufficient PV power generation, for example, when
This research adopts a genetic algorithm (GA) as an optimization algorithm to find the fittest ESS capacity. It is a search heuristic inspired by Charles Darwin’s theory of natural evolution (Wang et al., 2021). Li et al. (2022b) proposed a method using GA that optimally deployed BESS and determined their capacities in an energy-sharing framework. The optimization flow is shown in Figure 3, which describes the design and optimization methods of distributed ESS under a VPP framework.
(1) Input data, such as original load profiles, updated high-efficiency appliances, PV system capacity, solar radiation, and GA parameters. The values of the genetic parameters in this study were as follows: the maximum generations were 100 generations, the population size was 20, the crossover rate was 0.8, the mutation probability was 0.05, the mutation rate was 0.5, and the elitism was 0.5.
(2) Calculate the net load of each building.
(3) Initialize the battery matrix that needs to be optimized.
(4) Calculate the energy exchange between buildings and ESS.
(5) Optimize each building’s ESS capacity to minimize the peak demand for electricity in the area (with the goal of less than 33,000 kW) and maximize the profit. The objective function of this step can be described as
where MP is the max load at time t:
where
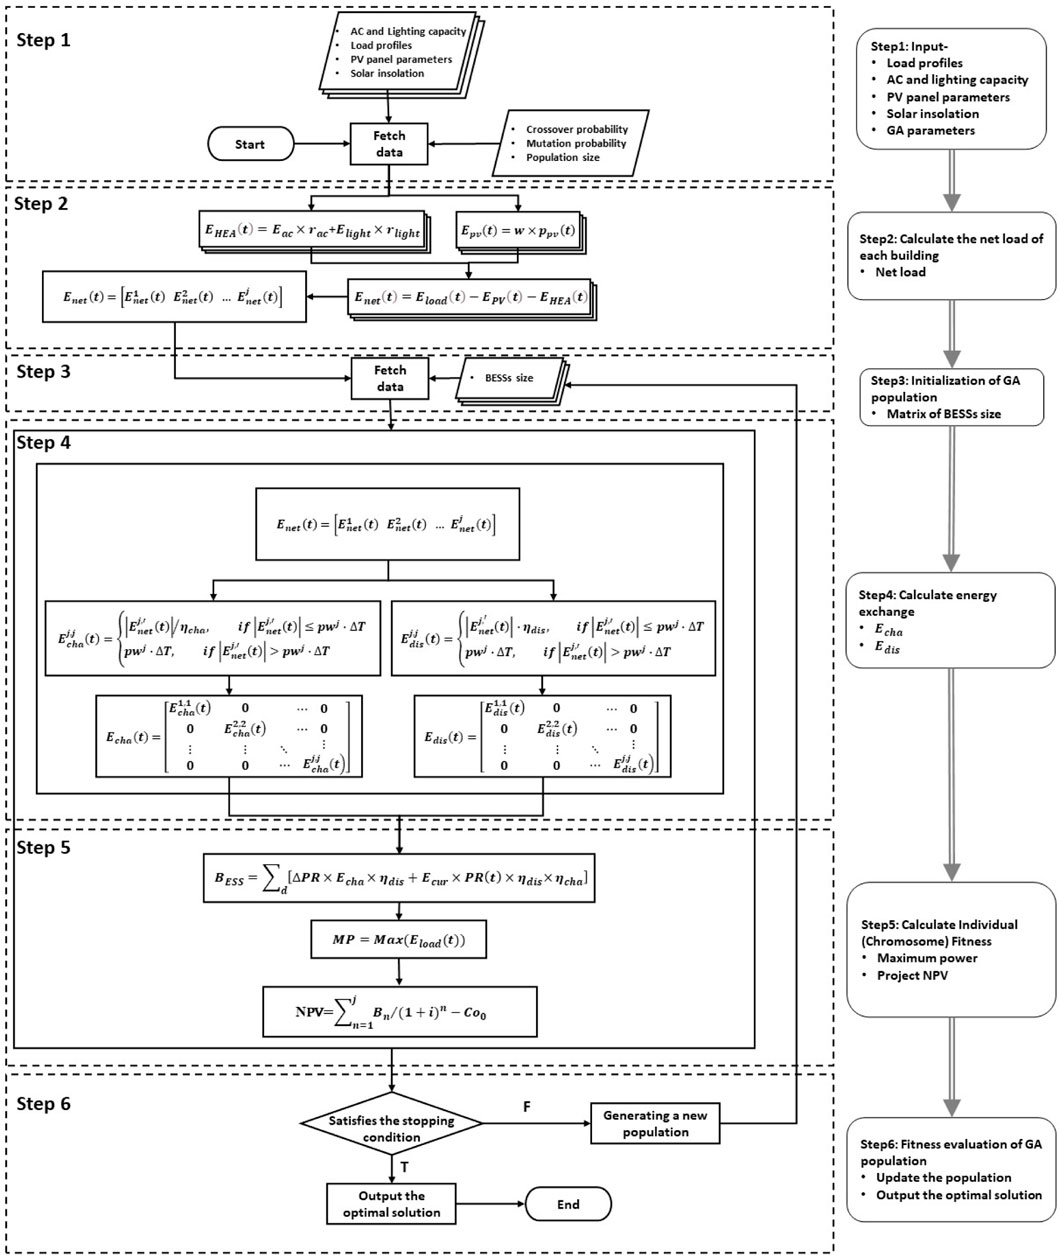
FIGURE 3. Optimization flow of ESS.
The last step is to output the optimal solution.
The optimization process is implemented in MATLAB, while the programming models are also built using GA in MATLAB. Moreover, the entire process is conducted on a computer with an Intel Core i7-8700 processor, 16 GB RAM, and 3.2 GHz Clock Speed. The elapsed time for the process is 493.2 s.
In this research, the economic benefit of VPP comprises the electricity cost saved by updated HEA, PV system, and ESS. Therefore, the economic benefit of the VPP can be determined by the following equation:
Here,
Here,
The overall investment of the VPP can be described as follows:
Here,
In 2012, the Japanese government launched the new feed-in tariff (FiT) act (Wen et al., 2021). This study also adopts different export FiT schemes to evaluate the economy:
This study adopts net present value (NPV) and returns on investment to forecast the economy of VPP’s life cycle. The expense of installing and maintaining the equipment and the energy loss from the depreciation of the equipment are ignored, and only the expense of the equipment is taken as the investment of constructing VPP.
NPV is normally used in capital budgeting and investment planning to analyze the profitability of a projected investment or project. After ignoring the operation and maintenance costs, the NPV of the demand side can be presented as
where
Return on investment (ROI) is a performance measure used to evaluate the efficiency or profitability of an investment or compare the efficiencies of different investments. ROI tries to directly measure returns on a particular investment relative to the investment’s cost. In order to calculate ROI, the benefit (or return) of an investment is divided by the cost of the investment. The result is expressed as a percentage or a ratio:
where
The Higashida Area Smart Community (H Community) is selected for the case study to investigate the techno-economic viability of the proposed VPP model. It is a model project for “Environmentally Symbiotic Town Development” and is a part of the national urban renewal project. By considering the geographical advantages of Kitakyushu, the Imperial Steel Works were established in Yahata in 1901, centered around Higashida. After that, companies and factories sprung up in rapid succession, and Kitakyushu city supported the industrial development of Japan as one of the country’s four major industrial zones. Due to energy advancements following World War 2, coal mines in the Chikuho region were shuttered and steel plants were streamlined. The industrial economy of Kitakyushu slid into decline, and this situation was called “tetsubie” (economic slowdown caused by decreased steel production). The rainbow-colored smoke, seen as a symbol of development as an industrial city, became known as the chief source of air pollution, and pollution became a severe social problem. However, Kitakyushu city went on to overcome the pollution problem and promoted recycling industries. Now the city has a unique presence as an “environmental future city” and is a manufacturing city. The H Community is positively promoting numerous low-carbon techniques to achieve energy self-sufficiency and realize advanced zero-carbon areas early. It covers an area of 1.2 km2 in Yahata Higashi, Kitakyushu, Fukuoka, as shown in Figure 4.
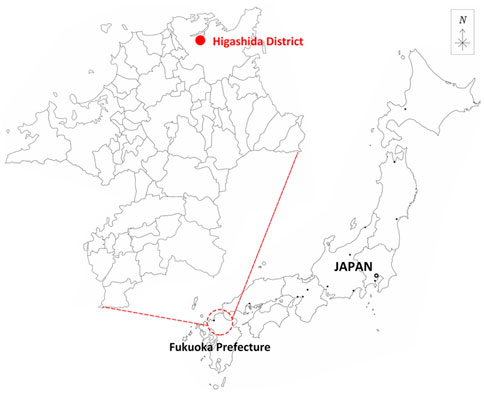
FIGURE 4. Location of Higashida smart community in Japan.
Currently, the regional electricity demand is firstly provided by the Higashida co-generation (capacity of 33,000 kW). Then, the Kyushu Electric Power provided the shortfall of electricity requirements. This study collected the hourly electricity usage between April 2013 and March 2014 in the H Community. The H Community has five types of buildings: residential, commercial, office, public, and industrial. Each building type has different activity schedules. Office buildings are usually closed on weekends. Public buildings always have rest on Sunday. Commercial and industrial buildings are open all year round.
Figure 5 shows the structure of electricity consumption of different building sectors in the H Community, and the locations of buildings are represented by five different colors within the research community. The commercial sector accounts for 36.4% of regional energy consumption, the office sector is 30.4%, the public sector is 16.3%, the residential sector is 11.5%, and the industry sector is 5.4%. We mainly collected the total energy consumption as well as the electric light, heating and cooling loads in residential, public, office and commercial buildings. Electricity consumption by lighting in residential buildings accounts for 33% of total electricity consumption; the electricity heating load, 26%; and the cooling load, 10% of total electricity consumption. In commercial buildings, the cooling load accounts for 28% of the total electricity load, the heat load accounts for 18%, and lighting accounts for 22%. In office buildings, the cooling load accounts for 21% of the total electricity load; the heat load, 10%; and lighting, 24%. In public buildings, the cooling load accounts for 19% of the total electricity load; the heat load, 14%; and lighting, 22%. Due to the relatively complicated electricity consumption of the industrial buildings, we can collect the total electricity load only. We summarize the heating and cooling schedule of different types of buildings. In commercial and public buildings, the cooling season is April–November, and the heating season is December–March. In office and residential buildings, the cooling season is June–September, and the heating season is December–March. The yearly energy consumption of the H community is shown in Figure 6. The colors from blue to red represent the electricity load from low to high. It is clear that the changes in the seasons obviously impact the electrical load. In the same season, the daily energy consumption trend is similar. Moreover, the trends of the electricity load exhibit evident peak-to-valley changes, and the peak electricity consumption in the area is usually around 10–18 o’clock. The electricity consumption is much more in summer than in winter. The peak electricity consumption reached 57,350 kW in a year.
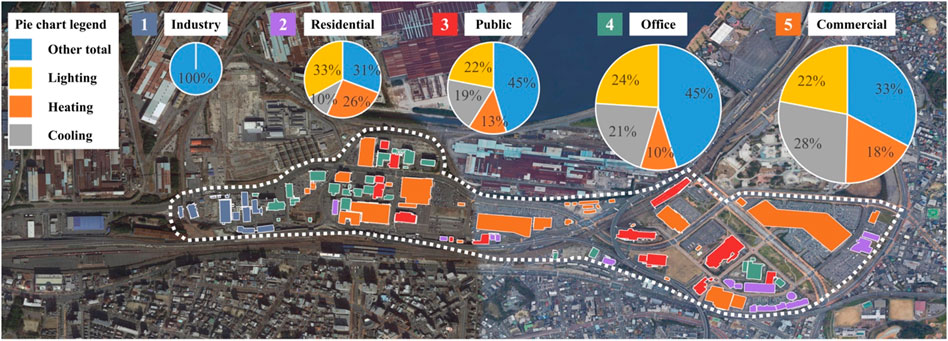
FIGURE 5. Distribution of buildings and structure of electricity consumption in different building sectors.
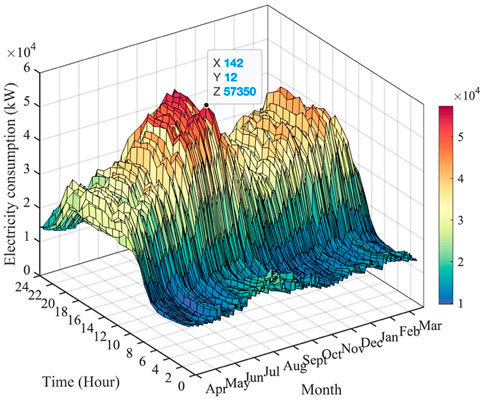
FIGURE 6. Energy consumption of the H Community in 1 year.
In terms of effect analysis, the following assumptions are made to simplify the mathematical model:
(1) Ignore the influence of other factors on the energy conversion efficiency of each device (the efficiency of each component is a fixed value in the optimization process).
(2) Ignore the feedback regulation time of the equipment (the equipment completes the output regulation at the moment of load change).
(3) Ignore the energy consumption of the energy network.
(4) Ignore the cost of building and maintaining the energy network.
(5) Ignore the case where there are multiple devices for the same component.
Table 2 shows the originally installed and after-update capacity of lighting and AC, as well as the saving potential of lighting and AC in different types of buildings. Due to the complex power structure of different types of industrial buildings, the update of high-efficiency electrical appliances in industrial buildings is not considered.
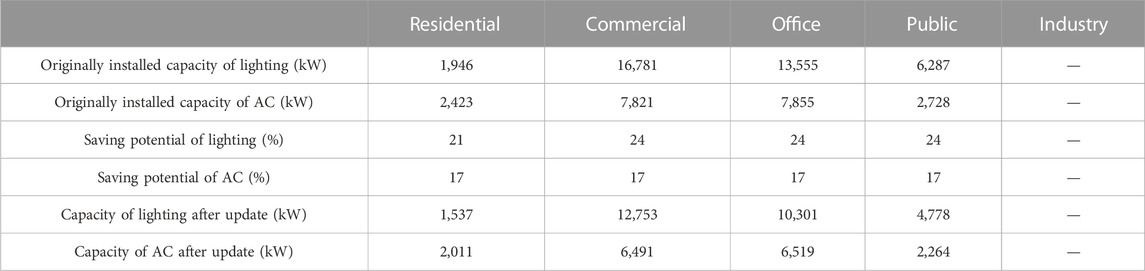
TABLE 2. Capacity and saving potential of lighting and AC.
The installation capacity of the PV system is related to the roof area that can be installed. Commonly, part of the roof area is designed for chimneys and ventilation pipes or sheltered by surrounding buildings. In addition, the PV system also needs to reserve maintenance channels. Therefore, we assumed that the maximum installation ratio of the area on the roof where PV modules can be installed is 50%. According to the statics, when installing a 10 kW PV module on the roof (Japan, 2022), the minimum area of the PV module is 49 m2; the minimum area of 10 kW PV module with an inclination angle of 35° on a flat roof is 100 m2; the minimum area of 10 kW PV module with an inclination angle of 20° on a flat roof is 85 m2 (Solar Partners, 2022). Thus, we can calculate the maximum capacity of the PV system. The calculation results are shown in Table 3. As the integration of renewable energy into the grid will affect the stability of the grid, ESS needs to store surplus PV power first. The capacity of ESS can be simulated by the proposed optimization flow in Section 2, and the results of the installed capacity of PV and ESS are shown in Table 3.
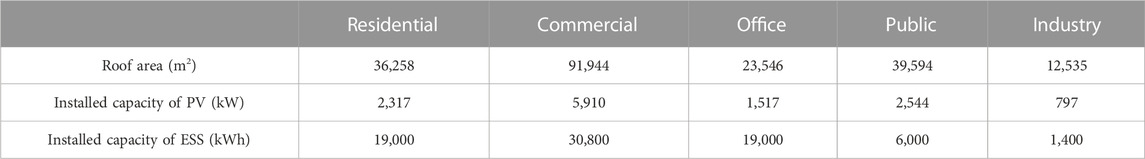
TABLE 3. Installed capacity of PV and ESS.
Based on the obtained capacity of high-efficiency appliances, energy-saving potential, installed PV capacity, and ESS capacity, the effect of different technologies applied in different types of buildings can be obtained. Figure 7 shows the monthly electricity saving ratio and the original monthly electricity demand, the monthly electricity generated by PV, and the monthly electricity savings after updating the appliances. The effect of the ESS is not shown in the figure because the ESS is only used as a carrier for charge–discharge electricity, and it does not produce electricity by itself. The polyline in the figures shows the electricity saving rate. It can be observed that the commercial, office, and public buildings have the same characteristics in that the electricity consumption in July and August is higher than in other months of the year. The electricity consumption of residential buildings in December and January is higher than in other months. PV generation is higher in summer than in winter because of the longer daylight hours and higher intensity of sunlight in summer. Among the five types of buildings, residential buildings have the highest energy-saving rate after introducing VPP, 35.11% in June. It can be observed that the electricity demand of the building is low at this time, but the power generation of PV is the highest in the year. In January, the electricity saving rate in residential buildings is the smallest, 17.53%. The energy-saving potential of PV is significant except for office buildings because the office has a high demand for electricity but a low PV installation capacity. The electricity saving rate of commercial buildings after the introduction of VPP is relatively stable. Although AC saves much electricity and PV systems generate a large amount of electricity because of its large original electricity consumption, the energy-saving rate is 14.61%–27.29%. In office buildings, the energy-saving rate during the summer (June–September) is higher than in other months due to the higher space cooling consumption. Public buildings show similar characteristics to commercial buildings in terms of the trend of electricity saving rate; both commercial and public sectors’ energy saving rates show two peaks in June and November. In industrial buildings, only the PV system was introduced, and the installed capacity is small, so the energy-saving rate is lower than in other buildings.
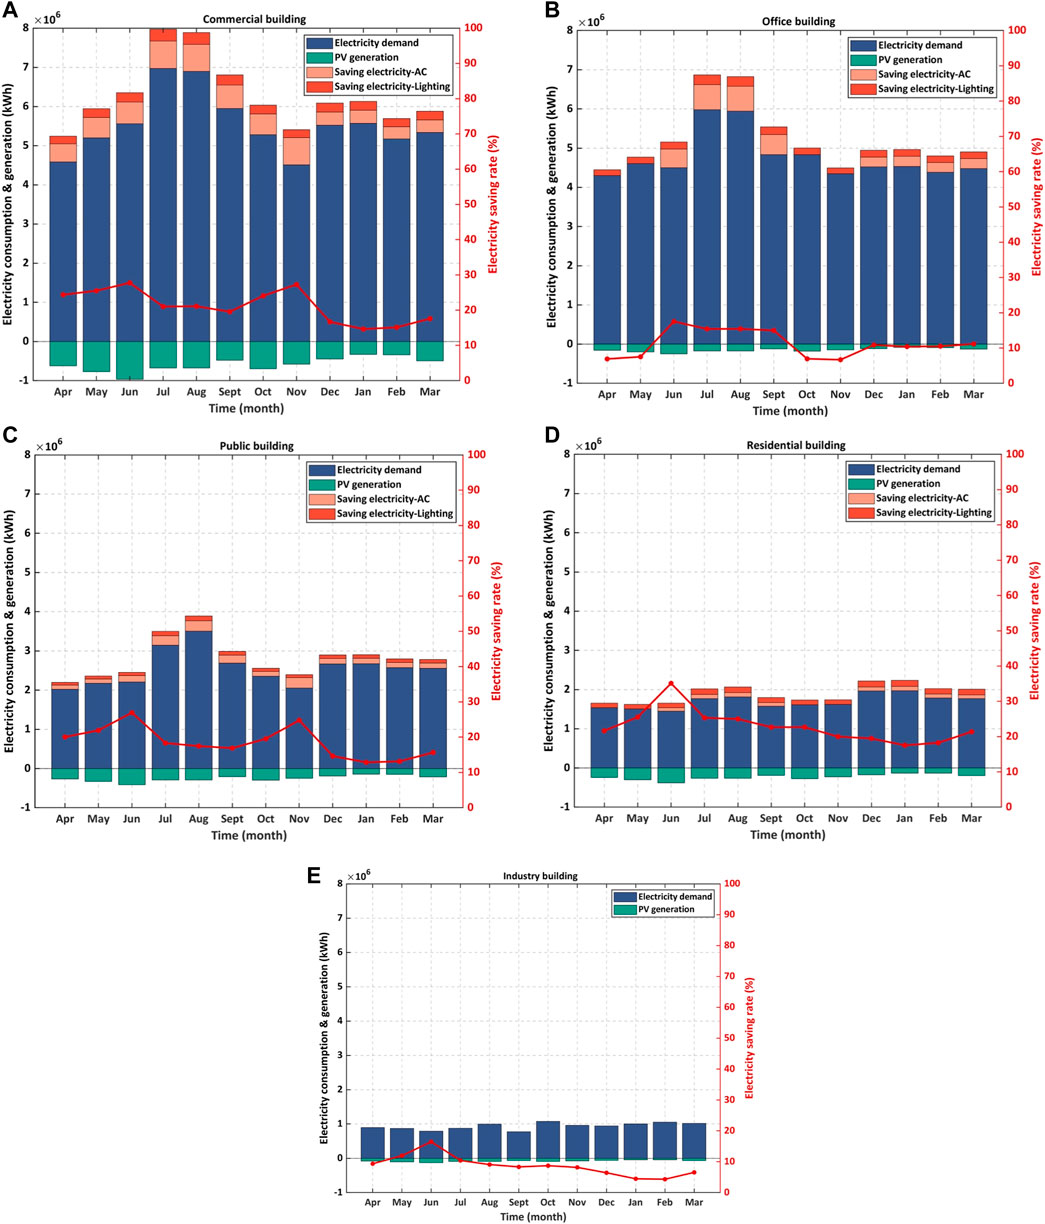
FIGURE 7. Electricity load and saving rate in different building sectors (A) Commercial building (B) Office building (C) Public building (D) Residential building (E) Industry building.
We selected a typical day in each season to simulate the effect of peak load shaving after the introduction of VPP to the H Community; results are demonstrated in Figure 8. The blue line represents the original electricity load. The red line represents the load-leveling effect of the VPP, which shows the final electricity demand load. Figure 8 also shows the electricity load after applying different technologies. The original electricity load presents “double peaks” in summer and winter and “double peaks” in the morning and afternoon throughout the day. In summer and winter, the effect of updating high-efficiency appliances is more pronounced than in spring and fall because of the seasonality of AC use. The part where the green line exceeds the red line means that the ESS is discharging. Otherwise, the ESS is charging. It can be observed that electricity consumption is higher in summer than in the other seasons. The peak electricity consumption in summer reached 57,350 kW at 12 o’clock, and the difference between peak and valley electricity loads reached 41,050 kW. At the same time, after the introduction of the VPP, the peak-to-valley difference between day and night is significantly reduced (41,050–9,610 kW), and the VPP contributes a peak shaving ratio of 42.55% on that day. The capacity of the VPP on that day equals 24,400 kW. Electricity demand is the lowest in spring, and the load after introducing the VPP in spring is the smoothest. The peak-to-valley difference of power load is only 4,450 kW after the introduction of the VPP. The peak of electricity consumption in spring usually occurs in the afternoon, and the peak shaving ratio reaches 42.31%. Electricity loads in the fall are similar to the spring. However, the peak of electricity consumption always occurs around 12 o’clock. In winter, the VPP can achieve a peak shaving rate of 34.81%. In summary, after the introduction of VPP, the uncertainty of renewable energy generation is compensated by the energy diversity of VPP. Note that the capacity of VPP is not constant but will be changed by several factors, such as weather and demand side’s electricity usage habits. The following analysis is based on the results obtained from our proposed VPP.
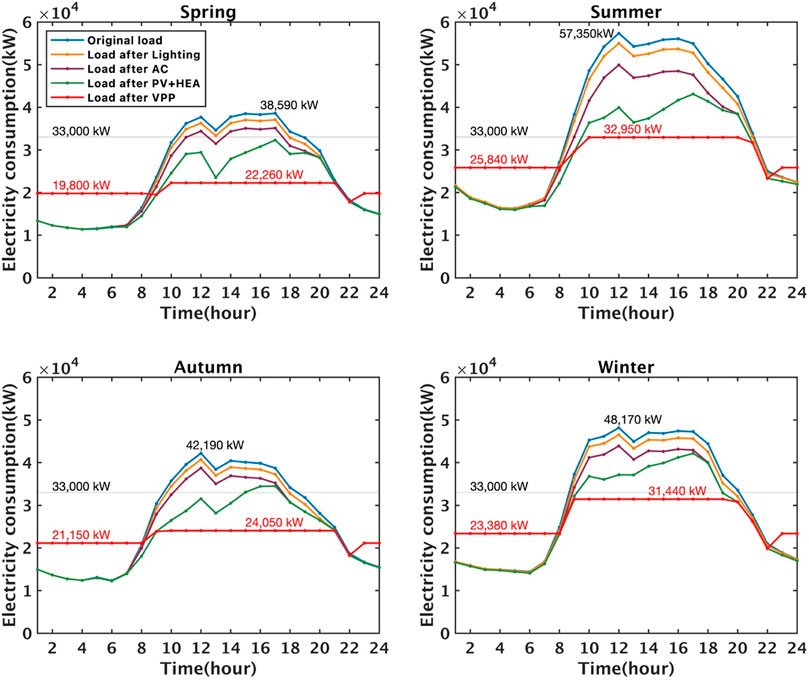
FIGURE 8. Peak-shaving effect of VPP on a typical day of each season.
Under the premise of ensuring the stable operation of the power grid, the technical and economic viability of VPP in the transition to energy self-sufficiency in communities should be taken seriously. As the equipment that the demand side can import spontaneously, economic benefits are often the most concerned factor on the demand side and can even affect the demand side’s willingness to install it. Thus, after the establishment of the VPP model, this section mainly discusses the economic performance of VPP in different building sectors and external network factors that can affect the economic performance of VPP. First, the primary purpose of demand sides installing VPP is to save electricity, and the intuitive economic performance of electricity saving is the electricity bills that demands can save. The electricity price model in the H Community is the peak-to-valley price model, as shown in Table 4, and the corresponding electricity price model can be found on the Kyushu Electric Power official website. Another important parameter for calculating profit is the initial investment. We list the price of the equipment and its lifetime in Table 5. Figure 9 shows the result of annual electricity bill saving for different types of buildings and technologies. Electricity bill saving provided by ESS in residential buildings (about 69 million JPY) is the highest compared to other technologies because the profit model of ESS is energy arbitrage, that is, charging electricity from the grid when the electricity demand is lower than the electricity supply and discharging to the demand side when the electricity demand is insufficient. Another factor is that residential buildings have the highest peak-to-valley price difference, so the bill saving is the largest. In addition, this is also related to the electricity consumption habits of the household sector. The PV system contributes a bill saving of 58 million JPY and about 15 million JPY savings of updating AC for residential buildings. In commercial buildings, the PV system contributes the highest electricity bill saving (about 118 million JPY) because it has installed the most PV panels. In addition, there are considerable benefits to upgrading high-efficiency appliances in commercial buildings, as AC in commercial buildings is operated all year round, resulting in higher electricity savings. Similarly, the electricity savings from upgrading high-efficiency appliances are higher in office buildings. The PV system saves 275 million JPY within a year and 313 million JPY by updating HEA. The ESS saves 237 million JPY within 1 year. The results show that the VPP formed by the various technical technologies introduced in the H Community has significant economic potential.
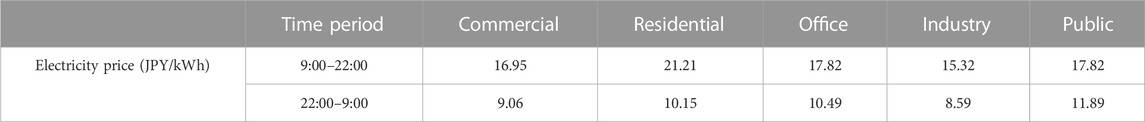
TABLE 4. Electricity price model of different types of buildings.
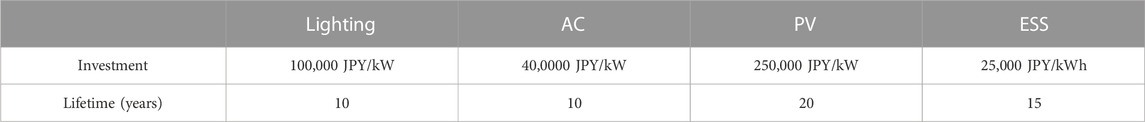
TABLE 5. Equipment price and lifetime.
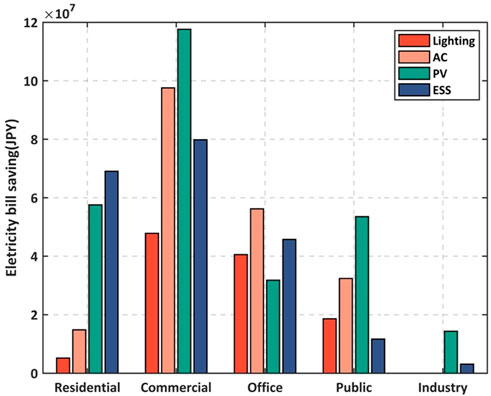
FIGURE 9. Annual electricity bill saving of different technologies.
For the economic analysis, this study also discussed different FiT schemes and renewable energy self-consumption for the community. The different FiT prices can be found at METI (2022d). The analysis compares the economic performance of four FiT scenarios and the renewable energy self-consumption scenario; results are shown in Table 6. In all scenarios, with the FiT price decreasing, the revenue of buildings received from selling PV power to the grid also decreased. When the FiT is less than the building’s corresponding time electricity price, it will no longer be profitable to sell PV power to the grid. Under the current FiT policy, the VPP system investment cannot be compensated through renewable energy export FiT incentives and electricity bill savings, which indicates it is more cost effective for PV owners consume PV generation by themselves than selling to the grid. Therefore, the subsequent analysis of this study is based on the scenario of PV self-consumption.
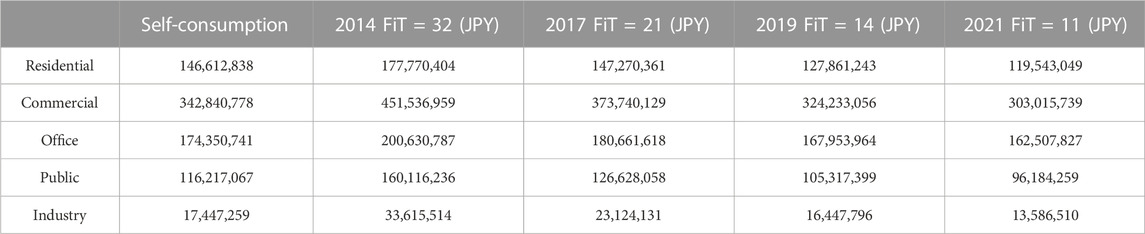
TABLE 6. Summary of the VPP annual electricity bill saving considering different FiT.
Another important issue that can affect the VPP’s economic performance is electricity price. The increased use of fossil fuels in thermal power generation after the Fukushima crisis led to a rise in electricity prices. Therefore, the economic performance considering different electricity price scenarios was evaluated; results are shown in Table 7. With the rise in electricity prices, although the demand side’s electricity bill increased, the electricity bill saving rate increased. With the rising price of electricity in Japan, VPPs have a good future and can bring better benefits to the demand side.
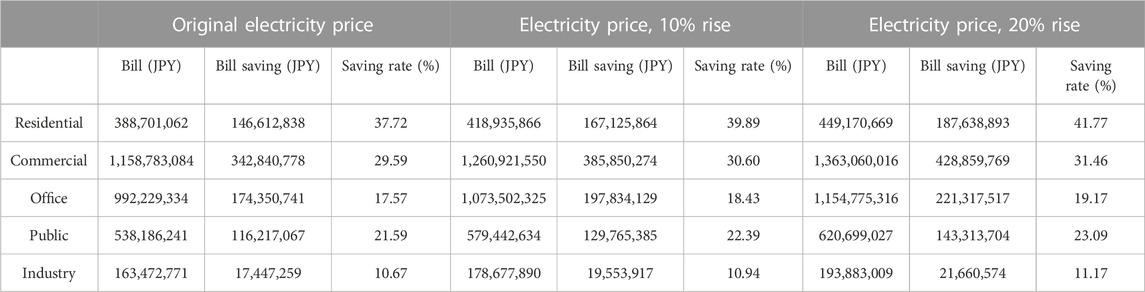
TABLE 7. Summary of the VPP annual electricity bill saving considering different electricity prices.
The reduction in CO2 emissions during the year after the formation of VPP was simulated in this section to explore the environmental impact of the introduction of VPP. Currently, the CO2 emission by electricity generation is 0.488 kg/kWh in the Kitakyushu (METI, 2022c), which is close to the maximum value of the current CO2 emission price in Japan. The carbon tax price is approximately 2.18 JPY/kWh. Based on the simulation of VPP’s load leveling effect, the carbon emission reduction result is shown in Figure 10. After the introduction of the VPP system, CO2 emissions have been significantly reduced. Originally, the highest CO2 emissions appeared in August, 10.49 × 10⁶ kg. After the introduction of the VPP system, CO2 emissions have been reduced to 8.75 × 10⁶ kg. Table 8 lists the CO2 emissions reduction rate of 12 months. In November, the CO2 emission rate decreased the most, with a decrease of 23.69%. The rate of carbon emission reduction is closely related to the energy saving rate.
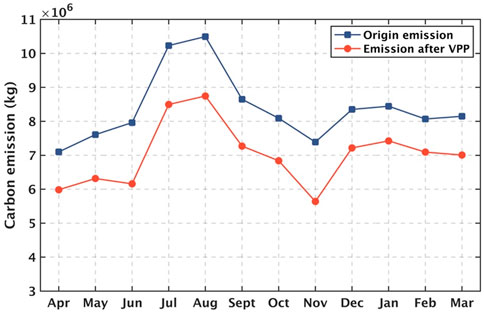
FIGURE 10. Carbon emission reduction.

TABLE 8. CO2 emission reduction rate.
The previous economic and environmental analysis indicates that VPP has certain advantages not only in the economic aspects, but also in the environmental aspect. This section provides analysis and forecasts on the ROI of VPP and capability of carbon emission reduction based on the influence of changes in equipment installation capacities, as well as carbon tax and equipment prices.
System size may be an important factor in the economic performance of the system. The economic adaptability and environmental performance of VPP in different types of buildings are studied in this section, combined with the load characteristics of different buildings. The ROI was adopted to evaluate how well the different VPP technologies have performed in different buildings, and the control variates were used to explore the effect of the installation capacity of different technologies on ROI in different buildings. The results are shown in Figure 11. The overall ROI for the community was 8.31%. Firstly, when all technologies are 100% installed, the ROI of residential buildings is the highest (10.89%), the ROI of the commercial building is 8.29%, the ROI of the public building is 7.63%, the ROI of the industrial building is 7.49%, and the ROI of the office building is the lowest (6.78%). This shows that VPPs bring the highest economic benefits and the best adaptability to residential buildings. It can be observed from the relationship between ROI and PV installation ratio, while the other technologies’ installation ratio is 100%, that when the installation rate of PV increases, the ROI of commercial, public, and office buildings increases. ROI of residential buildings decreases with the increase in the update ratio for lighting. Updating AC gains increasing ROI in public, office, residential, and commercial buildings. In all five building types, the ROI of ESS tends to increase as the installation rate increases. In residential buildings, ESS has the most significant ROI ups and downs; however, the ROI is relatively stable in public, commercial, and industrial buildings. This is mainly influenced by the electricity price difference. In industrial buildings, with the increase in PV installation ratio, the ROI decreases significantly. In summary, updating AC has good adaptability and is more profitable in the community. As a renewable energy generation technology with a high initial investment, PV has poor economic adaptability to buildings.

FIGURE 11. Relationship between return on investment and equipment installation ratio.
Carbon emission is an important factor leading to global warming, accounting for 80% of GHG. With the development of society, population and energy demand increase, and CO2 emissions progressively increase. The relationship between carbon emission reduction and equipment installation capacity was studied. Results are shown in Figure 12. With the increase in equipment installation ratio, the VPP’s capability of carbon emission reduction also increased. The installed capacity of ESS does not affect carbon emission reduction, as ESS does not generate electricity. PV is the most effective approach to reducing carbon emissions in all sectors except in office buildings because the installed capacity of PV is small in office buildings. Commercial buildings have the biggest emission reductions because they have the largest HEA replacement capacity and PV installation capacity. In summary, updating HEA and installing PV provide good environmental benefits.
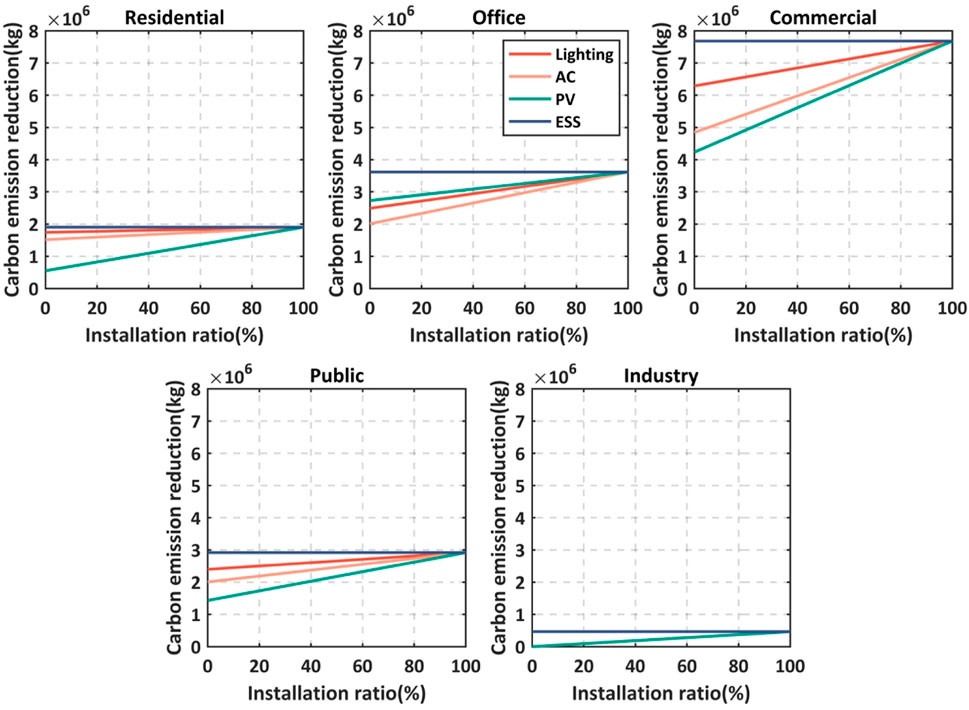
FIGURE 12. Relationship between carbon emission reduction and equipment installation ratio.
Research on carbon pricing is becoming a hot topic as an essential intervention for global energy conservation and GHG emission reduction (Qian et al., 2020; Zhao et al., 2020). Some studies have shown the contribution of VPP in energy saving and GHG emission reduction (Hadayeghparast et al., 2019; Shafiekhani et al., 2019). A carbon trading mechanism is introduced to the VPP system to achieve low-carbon operation (Yan et al., 2022). Compared with conventional power plants, VPPs mainly aggregate renewable energy and various energy-saving technologies, which can reduce carbon emissions. Therefore, when considering the benefits of VPPs, it is necessary to consider the effects of carbon emission price on holistic benefits. Carbon emission prices are commonly used to compare technologies and build life cycle analysis (Zhang and Wang, 2017). Since 2010, Japan has begun promoting the application of carbon tax. Carbon emitters need to refer to the original carbon footprint and reduce their emissions yearly according to a fixed target (first stage 2010–2014; second stage 2015–2019). The World Energy Outlook (WEO) has presented the prediction of future carbon tax changes. The carbon tax shows an upward trend from 2020 to 2040, as shown in Table 9. By keeping the equipment prices steady and introducing the carbon tax as the only variable in the system to calculate the economic performance, the change in the NPV of the VPP after introducing the carbon tax is presented in Figure 13. The life cycle of the VPP system was set to 30 years. It needs to invest three times in HEA and two times in the ESS. When the NPV is exceeds 0, the VPP system starts generating revenue. With the increase in the carbon tax price, the payback period shows a trend of shortening year by year because, after the introduction of the VPP system on the demand side, CO2 emissions have been reduced, increasing the operating profit and shortening the payback period. When the carbon tax is 2.18 JPY/kWh, the payback period of VPP is reduced from 18 to 9 years. It shows that when the carbon tax price reaches 15.23 JPY, the payback period is reduced by more than half (∼5 years) compared to the original situation (14 years).
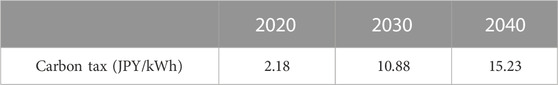
TABLE 9. Carbon tax.
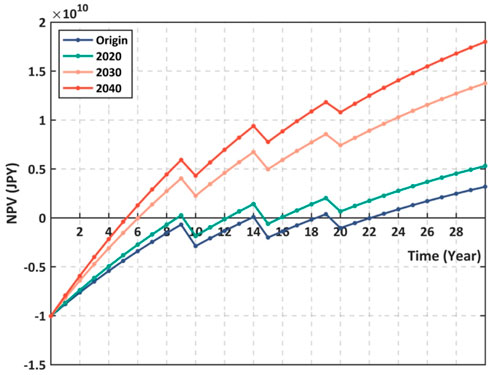
FIGURE 13. Net present value of VPP with a different carbon tax.
The equipment price plays an essential role in the formation of the VPP. There is great uncertainty in the costs chosen for economic evaluation, especially the cost of capital investment. This uncertainty can significantly affect the economic performance of the system and potentially alter the economic advantages between them. Currently, the prices of PV and ESS equipment are relatively high. In recent years, in order to promote the DES to more buildings, the prices of PV and ESS have also been declining year by year with the efforts of the Japanese government. The price of PV is expected to drop to 150,000 JPY/KW within 10 years, and the price of ESS will drop to 5,000 JPY/kWh (METI, 2021). On the basis of this situation, the ROI of VPP regarding the initial cost decrease in the lighting, AC, PV, and ESS is calculated, and the results are shown in Figure 14. When the equipment price decreases, the ROI of the entire VPP system increases. The lines show the change in ROI with the different technologies’ prices decreasing while other equipment prices remain unchanged. The lighting price has the most significant impact on ROI: with the decrease in lighting price, the ROI of lighting increases rapidly. The green line shows that the ROI of PV also increases with the price decrease. Good returns from falling equipment prices show a bright future for VPP.
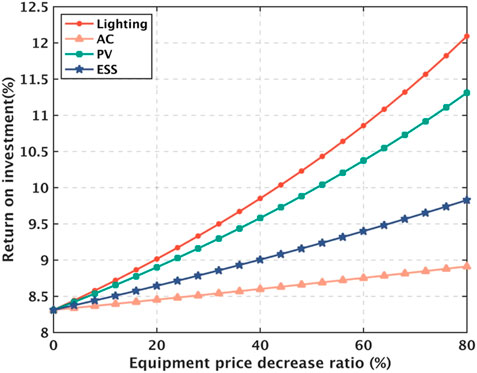
FIGURE 14. ROI of VPP with different equipment prices.
This study proposes an optimized VPP model comprising HEA, PV, and ESS, with the goal of energy self-sufficiency. Then, the effectiveness of the VPP in reducing electricity demand from the power grid is verified based on the real-world case study. The techno-economic feasibility and the adaptability performance of VPP in different buildings are evaluated. The environmental benefits of VPP are confirmed. Based on this study, the following conclusions can be derived:
(1) The proposed VPP model in this research promotes the realization of regional energy self-sufficiency, and the peak shaving rate can reach 42.55%. The economic evaluation shows that VPP can bring electricity bill saving of 825 million JPY/year for the Higashida area smart community. Compared with a conventional power plant, VPP can contribute 16.26% annual carbon emission reduction for the community.
(2) In different building sectors, VPP brings the highest economic benefits and the best adaptability to residential buildings. In general, upgrading high-efficiency AC has better economic benefits compared to lighting. The installation of PV in commercial, office, and public buildings is more beneficial than in other buildings. The installation ratio of the PV system has a greater impact on ROI than other technologies.
(3) The introduction of the carbon tax could significantly increase the economic benefits of VPP. As the FiT prices continue to drop, it is better to self-consume than sell PV power to the grid. With a continuous increase in electricity prices in Japan, the future operation of VPP will be more economical. Moreover, the expensive investment costs remain the main obstacle to more widespread implementation of VPP. When the costs of these key components fall in the future, the market competitiveness of the proposed VPP system can be enhanced.
The findings of this research have high practical reference value. This is particularly important in the context of the decarbonization revolution of the power system.
The data that support the findings of this study are available from the corresponding author, [Z2Fvd2VpanVuQG1lLmNvbQ==], upon reasonable request.
The manuscript was written through the contributions of all authors. All authors have approved the final version of the manuscript. YW: conceptualization, methodology, validation, visualization, and writing—original draft. WG: supervision, conceptualization, and writing—review and editing. YL: software, visualization, and writing—review and editing. FQ: methodology, and writing—review and editing. WY: review.
The authors declare that the research was conducted in the absence of any commercial or financial relationships that could be construed as a potential conflict of interest.
All claims expressed in this article are solely those of the authors and do not necessarily represent those of their affiliated organizations or those of the publisher, the editors, and the reviewers. Any product that may be evaluated in this article, or claim that may be made by its manufacturer, is not guaranteed or endorsed by the publisher.
Al-Saqlawi, J., Madani, K., and Mac Dowell, N. (2018). Techno-economic feasibility of grid-independent residential roof-top solar PV systems in Muscat, Oman. Energy Convers. Manag. 178, 322–334. doi:10.1016/j.enconman.2018.10.021
Azarpour, A., Mohammadzadeh, O., Rezaei, N., and Zendehboudi, S. (2022). Current status and future prospects of renewable and sustainable energy in North America: Progress and challenges. Energy Convers. Manag. 269, 115945. doi:10.1016/j.enconman.2022.115945
Azimi, Z., Hooshmand, R.-A., and Soleymani, S. (2021). Optimal integration of demand response programs and electric vehicles in coordinated energy management of industrial virtual power plants. J. Energy Storage 41, 102951. doi:10.1016/j.est.2021.102951
Baringo, L., Freire, M., García-Bertrand, R., and Rahimiyan, M. (2021). Offering strategy of a price-maker virtual power plant in energy and reserve markets. Sustain. Energy, Grids Netw. 28, 100558. doi:10.1016/j.segan.2021.100558
Bhuiyan, E. A., Hossain, M. Z., Muyeen, S., Fahim, S. R., Sarker, S. K., and Das, S. K. (2021). Towards next generation virtual power plant: Technology review and frameworks. Renew. Sustain. Energy Rev. 150, 111358. doi:10.1016/j.rser.2021.111358
Dietrich, K., Latorre, J. M., Olmos, L., and Ramos, A. (2015). Modelling and assessing the impacts of self supply and market-revenue driven Virtual Power Plants. Electr. Power Syst. Res. 119, 462–470. doi:10.1016/j.epsr.2014.10.015
Divya, K., and Østergaard, J. (2009). Battery energy storage technology for power systems—an overview. Electr. power Syst. Res. 79, 511–520. doi:10.1016/j.epsr.2008.09.017
Esco (2022). Example of LED cost reduction. Available at: https://www.esco-co.jp/service/led/simulation/.
Fouad, M., Iskander, J., and Shihata, L. A. (2020). Energy, carbon and cost analysis for an innovative zero energy community design. Sol. Energy 206, 245–255. doi:10.1016/j.solener.2020.05.048
Fouz, D., Carballo, R., López, I., and Iglesias, G. (2022). Tidal stream energy potential in the Shannon Estuary. Renew. Energy 185, 61–74. doi:10.1016/j.renene.2021.12.055
Galvan, E., Mandal, P., and Sang, Y. (2020). Networked microgrids with roof-top solar PV and battery energy storage to improve distribution grids resilience to natural disasters. Int. J. Electr. Power & Energy Syst. 123, 106239. doi:10.1016/j.ijepes.2020.106239
Ghosh, A., and Norton, B. (2019). Optimization of PV powered SPD switchable glazing to minimise probability of loss of power supply. Renew. Energy 131, 993–1001. doi:10.1016/j.renene.2018.07.115
Hadayeghparast, S., Soltaninejad Farsangi, A., and Shayanfar, H. (2019). Day-ahead stochastic multi-objective economic/emission operational scheduling of a large scale virtual power plant. Energy 172, 630–646. doi:10.1016/j.energy.2019.01.143
Hoeser, T., and Kuenzer, C. (2022). Global dynamics of the offshore wind energy sector monitored with Sentinel-1: Turbine count, installed capacity and site specifications. Int. J. Appl. Earth Observation Geoinformation 112, 102957. doi:10.1016/j.jag.2022.102957
Iea (2021). Japan 2021 energy policy review. Available at: https://www.iea.org/reports/japan-2021.
Industry, P. (2022). Panasonic is closing its business for photovoltaic modules. Available: https://industry.panasonic.eu/solar-closing.
Japan (2022). List of statistical surveys conducted under the Statistics Act. Available at: https://www.env.go.jp/doc/toukei/survey/index.html.
Jma (2022). Weather data in Kyushu. Japan meteorological angency. Available at: https://www.data.jma.go.jp/multi/yoho/yoho_detail.html?code=400020&lang=cn_zt.
Ju, L., Yin, Z., Zhou, Q., Li, Q., Wang, P., Tian, W., et al. (2022). Nearly-zero carbon optimal operation model and benefit allocation strategy for a novel virtual power plant using carbon capture, power-to-gas, and waste incineration power in rural areas. Appl. Energy 310, 118618. doi:10.1016/j.apenergy.2022.118618
Ju, L., Zhao, R., Tan, Q., Lu, Y., Tan, Q., and Wang, W. (2019). A multi-objective robust scheduling model and solution algorithm for a novel virtual power plant connected with power-to-gas and gas storage tank considering uncertainty and demand response. Appl. Energy 250, 1336–1355. doi:10.1016/j.apenergy.2019.05.027
Kasaei, M. J., Gandomkar, M., and Nikoukar, J. (2017). Optimal management of renewable energy sources by virtual power plant. Renew. Energy 114, 1180–1188. doi:10.1016/j.renene.2017.08.010
Kobashi, T., Jittrapirom, P., Yoshida, T., Hirano, Y., and Yamagata, Y. (2021). SolarEV City concept: Building the next urban power and mobility systems. Environ. Res. Lett. 16, 024042. doi:10.1088/1748-9326/abd430
Li, C., Song, Y., and Kaza, N. (2018). Urban form and household electricity consumption: A multilevel study. Energy Build. 158, 181–193. doi:10.1016/j.enbuild.2017.10.007
Li, M., Cao, S., Zhu, X., and Xu, Y. (2022a). Techno-economic analysis of the transition towards the large-scale hybrid wind-tidal supported coastal zero-energy communities. Appl. Energy 316, 119118. doi:10.1016/j.apenergy.2022.119118
Li, Y., Gao, W., and Ruan, Y. (2017). Feasibility of virtual power plants (VPPs) and its efficiency assessment through benefiting both the supply and demand sides in Chongming country, China. Sustain. Cities Soc. 35, 544–551. doi:10.1016/j.scs.2017.08.030
Li, Y., Qian, F., Gao, W., Fukuda, H., and Wang, Y. (2022b). Techno-economic performance of battery energy storage system in an energy sharing community. J. Energy Storage 50C, 104247. doi:10.1016/j.est.2022.104247
Li, Y., Wang, Y., Fukuda, H., Gao, W., and Qian, F. (2022c). Analysis of energy sharing impacts in a commercial community: A case of battery energy storage system deployment for load leveling. Front. Energy Res. 10. doi:10.3389/fenrg.2022.929693
Liu, X. (2022). Research on optimal dispatch method of virtual power plant considering various energy complementary and energy low carbonization. Int. J. Electr. Power & Energy Syst. 136, 107670. doi:10.1016/j.ijepes.2021.107670
Luo, F., Dorri, A., Ranzi, G., Zhao, J., and Jurdak, R. (2021). Aggregating buildings as a virtual power plant: Architectural design, supporting technologies, and case studies. IET Energy Syst. Integr. 4. doi:10.1049/esi2.12047
Meti (2022a). Agency for natural resources and energy. Available at: https://www.enecho.meti.go.jp/category/saving_and_new/saving/general/choice/.
Meti (2022b). Basis for calculation of energy-saving effects. Available at: https://www.enecho.meti.go.jp/category/saving_and_new/saving/general/howto/index.html#konkyo.
Meti (2022c). Energy conservation policy. Available at: https://www.enecho.meti.go.jp/category/saving_and_new/saving/general/howto/index.html#konkyo.
Meti (2022d). New feed-in tariff Act (FIT) in Japan. Available at: https://www.enecho.meti.go.jp/category/saving_and_new/saiene/kaitori/kakaku.html#2019.
Meti (2021). Price prediction of PV and BESS. Available at: https://www.meti.go.jp/shingikai/santeii/pdf/20210127_1.pdf.
Naval, N., Sánchez, R., and Yusta, J. M. (2020). A virtual power plant optimal dispatch model with large and small-scale distributed renewable generation. Renew. Energy 151, 57–69. doi:10.1016/j.renene.2019.10.144
Naval, N., and Yusta, J. M. (2021). Virtual power plant models and electricity markets - a review. Renew. Sustain. Energy Rev. 149, 111393. doi:10.1016/j.rser.2021.111393
Ngk (2022). Power storage system for stable supply of renewable energy. Available: https://www.ngk.co.jp/sdgs/.
Nishio, K. (2015). Ex-post analysis of electricity saving measures in the residential sector in the summers of 2011–14: Continuous observations after the Great East Japan Earthquake. Yokosuka-shi, Japan: Socio-economic Research Center Report, Y14014.
Ogunjuyigbe, A. S. O., Ayodele, T. R., and Akinola, O. A. (2016). Optimal allocation and sizing of PV/Wind/Split-diesel/Battery hybrid energy system for minimizing life cycle cost, carbon emission and dump energy of remote residential building. Appl. Energy 171, 153–171. doi:10.1016/j.apenergy.2016.03.051
Pandžić, H., Morales, J. M., Conejo, A. J., and Kuzle, I. (2013). Offering model for a virtual power plant based on stochastic programming. Appl. Energy 105, 282–292. doi:10.1016/j.apenergy.2012.12.077
Qian, F., Gao, W., Yang, Y., and Yu, D. (2020). Economic optimization and potential analysis of fuel cell vehicle-to-grid (FCV2G) system with large-scale buildings. Energy Convers. Manag. 205, 112463. doi:10.1016/j.enconman.2019.112463
Rahimi, M., Ardakani, F. J., and Ardakani, A. J. (2021). Optimal stochastic scheduling of electrical and thermal renewable and non-renewable resources in virtual power plant. Int. J. Electr. Power & Energy Syst. 127, 106658. doi:10.1016/j.ijepes.2020.106658
Ren, H., Wu, Q., Gao, W., and Zhou, W. (2016). Optimal operation of a grid-connected hybrid PV/fuel cell/battery energy system for residential applications. Energy 113, 702–712. doi:10.1016/j.energy.2016.07.091
Rodrigues, E., Osório, G., Godina, R., Bizuayehu, A., Lujano-Rojas, J., Matias, J., et al. (2015). Modelling and sizing of NaS (sodium sulfur) battery energy storage system for extending wind power performance in Crete Island. Energy 90, 1606–1617. doi:10.1016/j.energy.2015.06.116
Rouzbahani, H. M., Karimipour, H., and Lei, L. (2021). A review on virtual power plant for energy management. Sustain. Energy Technol. Assessments 47, 101370. doi:10.1016/j.seta.2021.101370
Royapoor, M., Pazhoohesh, M., Davison, P. J., Patsios, C., and Walker, S. (2020). Building as a virtual power plant, magnitude and persistence of deferrable loads and human comfort implications. Energy Build. 213, 109794. doi:10.1016/j.enbuild.2020.109794
Schardt, J., and Te Heesen, H. (2021). Performance of roof-top PV systems in selected European countries from 2012 to 2019. Sol. Energy 217, 235–244. doi:10.1016/j.solener.2021.02.001
Setiawan, E. A. (2007). Concept and controllability of virtual power plant. Kassel, Germany: kassel university press GmbH.
Shabanzadeh, M., Sheikh-El-Eslami, M.-K., and Haghifam, M.-R. (2017a). An interactive cooperation model for neighboring virtual power plants. Appl. Energy 200, 273–289. doi:10.1016/j.apenergy.2017.05.066
Shabanzadeh, M., Sheikh-El-Eslami, M. K., and Haghifam, M. R. (2017b). Risk-based medium-term trading strategy for a virtual power plant with first-order stochastic dominance constraints. IET Generation, Transm. Distribution 11, 520–529. doi:10.1049/iet-gtd.2016.1072
Shafiekhani, M., Badri, A., Shafie-Khah, M., and Catalão, J. P. S. (2019). Strategic bidding of virtual power plant in energy markets: A bi-level multi-objective approach. Int. J. Electr. Power & Energy Syst. 113, 208–219. doi:10.1016/j.ijepes.2019.05.023
Sheidaei, F., and Ahmarinejad, A. (2020). Multi-stage stochastic framework for energy management of virtual power plants considering electric vehicles and demand response programs. Int. J. Electr. Power & Energy Syst. 120, 106047. doi:10.1016/j.ijepes.2020.106047
Solar.Partners (2022). How much area is needed to install 10 kW Photovoltaic? Available at: https://standard-project.net/solar/baiden/zenryou_kaitori.html.
Srivastava, C., Yang, Z., and Jain, R. K. (2019). Understanding the adoption and usage of data analytics and simulation among building energy management professionals: A nationwide survey. Build. Environ. 157, 139–164. doi:10.1016/j.buildenv.2019.04.016
Tan, C., Wang, J., Geng, S., Pu, L., and Tan, Z. (2021). Three-level market optimization model of virtual power plant with carbon capture equipment considering copula–CVaR theory. Energy 237, 121620. doi:10.1016/j.energy.2021.121620
Wakiyama, T., and Kuramochi, T. (2017). Scenario analysis of energy saving and CO2 emissions reduction potentials to ratchet up Japanese mitigation target in 2030 in the residential sector. Energy Policy 103, 1–15. doi:10.1016/j.enpol.2016.12.059
Wang, Z., Cao, L., and Si, H. (2021). An improved genetic algorithm for determining the optimal operation strategy of thermal energy storage tank in combined heat and power units. J. Energy Storage 43, 103313. doi:10.1016/j.est.2021.103313
Wen, D., Gao, W., Kuroki, S., Gu, Q., and Ren, J. (2021). The effects of the new Feed-In Tariff Act for solar photovoltaic (PV) energy in the wake of the Fukushima accident in Japan. Energy Policy 156, 112414. doi:10.1016/j.enpol.2021.112414
Yan, Q., Zhang, M., Lin, H., and Li, W. (2022). Two-stage adjustable robust optimal dispatching model for multi-energy virtual power plant considering multiple uncertainties and carbon trading. J. Clean. Prod. 336, 130400. doi:10.1016/j.jclepro.2022.130400
Yang, Q., Wang, H., Wang, T., Zhang, S., Wu, X., and Wang, H. (2021). Blockchain-based decentralized energy management platform for residential distributed energy resources in a virtual power plant. Appl. Energy 294, 117026. doi:10.1016/j.apenergy.2021.117026
Zapata Riveros, J., Bruninx, K., Poncelet, K., and D’haeseleer, W. (2015). Bidding strategies for virtual power plants considering CHPs and intermittent renewables. Energy Convers. Manag. 103, 408–418. doi:10.1016/j.enconman.2015.06.075
Zhang, L., Liu, D., Cai, G., Lyu, L., Koh, L. H., and Wang, T. (2023). An optimal dispatch model for virtual power plant that incorporates carbon trading and green certificate trading. Int. J. Electr. Power & Energy Syst. 144, 108558. doi:10.1016/j.ijepes.2022.108558
Zhang, X., and Wang, F. (2017). Analysis of embodied carbon in the building life cycle considering the temporal perspectives of emissions: A case study in China. Energy Build. 155, 404–413. doi:10.1016/j.enbuild.2017.09.049
Keywords: virtual power plant, energy management, economic assessment, energy self-sufficiency, community
Citation: Wang Y, Gao W, Li Y, Qian F and Yao W (2023) Techno-economic analysis of the transition toward the energy self-sufficiency community based on virtual power plant. Front. Energy Res. 11:1010846. doi: 10.3389/fenrg.2023.1010846
Received: 03 August 2022; Accepted: 17 January 2023;
Published: 06 February 2023.
Edited by:
IMR Fattah, University of Technology Sydney, AustraliaReviewed by:
Prakash Chandra Sahu, Veer Surendra Sai University of Technology, IndiaCopyright © 2023 Wang, Gao, Li, Qian and Yao. This is an open-access article distributed under the terms of the Creative Commons Attribution License (CC BY). The use, distribution or reproduction in other forums is permitted, provided the original author(s) and the copyright owner(s) are credited and that the original publication in this journal is cited, in accordance with accepted academic practice. No use, distribution or reproduction is permitted which does not comply with these terms.
*Correspondence: Weijun Gao, Z2Fvd2VpanVuQG1lLmNvbQ==; You Li, bGl5b3VqYXBhbkBvdXRsb29rLmNvbQ==
Disclaimer: All claims expressed in this article are solely those of the authors and do not necessarily represent those of their affiliated organizations, or those of the publisher, the editors and the reviewers. Any product that may be evaluated in this article or claim that may be made by its manufacturer is not guaranteed or endorsed by the publisher.
Research integrity at Frontiers
Learn more about the work of our research integrity team to safeguard the quality of each article we publish.