- 1National Engineering Laboratory for Reducing Emissions from Coal Combustion, Engineering Research Center of Environmental Thermal Technology of Ministry of Education, Shandong Key Laboratory of Energy Carbon Reduction and Resource Utilization, School of Energy and Power Engineering, Shandong University, Jinan, Shandong, China
- 2Shandong Environmental Protection Industry Group Co., Jinan, Shandong, China
In this paper, two types of adsorption materials SA-C-Fe and SA-C-Fe(C) were prepared using bagasse biochar produced by one-step microwave pyrolysis and activation for Cr(VI) removal of wastewater. The adsorption materials were characterized, and Cr(VI) adsorption performance, kinetics and thermodynamics on adsorption materials were studied. Results show that microwave pyrolysis/activation contributes to developed pore structure and abundant active functional groups, resulting in high Cr(VI) adsorption capacities. The optimal preparation conditions for biochar is: microwave power 500 W, ZnCl2/bagasse ratio 2.5:1 and pyrolysis/activation time 15 min, and the specific surface area of biochar is 1,787.64 m2/g. The Cr(VI) adsorption of the two materials is more in line with the pseudo-second-order kinetic model, and the adsorption process is dominated by chemical adsorption. The static removal experiment of Cr(VI) using SA-C-Fe and SA-C-Fe(C) has the best removal effect at pH = 2, and the whole adsorption process is more in line with the Langmuir-Freundlich isotherm model. Calculated by the pseudo-two-order kinetic model and the Langmuir-Freundlich isothermal model, the maximum adsorption rate for Cr(VI) of SA-C-Fe and SA-C-Fe(C) are 211.87 mg/g and 388.92 mg/g, respectively. The removal process is mainly dominated by three mechanisms: electrostatic adsorption, ion exchange and redox reactions. The improvement of Cr(VI) adsorption capacity is attributed to more developed pore structure. The results offer beneficial reference for the application of low-cost carbon-based adsorption materials for pollutants separation, and effectively realize the utilization of bagasse pyrolysis by-products.
1 Introduction
With the rapid development of society and increasingly serious pollution, wastewater treatment has now become an important environmental problem. Chromium is a typical heavy metal contaminant, which exists in large quantities in the wastewater of many industries such as chemical industry, electroplating, mining, metallurgy, and tanning (Huang et al., 2016a; Li K. et al., 2019). Because of its high mobility, strong toxicity and high carcinogenicity, it is listed as one of the most toxic pollutants in wastewater (Shi et al., 2020).
Chromium ions mainly exist in the form of compounds of hexavalent chromium (Cr(VI)) and trivalent chromium (Cr(III)) in water, and Cr(VI) is the most toxic kind of chromium (Liu et al., 2020). Cr(VI) can enter the human body through skin contact, respiratory tract and other means and cause the cell tissue to become cancerous and deformed (Hilbrandt et al., 2019). In addition, directly release of Cr(VI) into the environment will cause greater harm to water and soil (Zhao et al., 2015; Wang et al., 2020). Therefore, in accordance with environmental protection requirements, chromium-containing wastewater must be effectively treated to protect the environment and human health.
Cr(VI) has been usually removed from wastewater by adsorption, chemical precipitation, electrocoagulation, ion exchange, membrane separation, reduction, and biosorption (Alvarado et al., 2013; Zhang et al., 2018). At present, the adsorption method is considered to be the method with low operating cost and the simplest operation for treating Cr(VI) in wastewater (Barrera-Diaz et al., 2012; Zhu et al., 2018; Liu et al., 2019; Zhao et al., 2020). Among the common adsorbents, because of its high specific surface area, good pore structure, rich surface functional groups and stable properties, biochar is widely regarded as a high-quality carbon-based adsorption material with strong adsorption capacity (Li R. et al., 2019).
The removal capacity of biochar for heavy metal pollutants depends on its physical and chemical properties, which are affected by raw materials, pyrolysis process and modification conditions (Zhang et al., 2017). There are two common pyrolysis methods for biochar preparation. One is conventional pyrolysis, and the other one is microwave pyrolysis. Microwave pyrolysis is an attractive technology compared to conventional pyrolysis, as it provides internal and volumetric heating, there is no physical contact between the biochar and the heating source, the microwave penetrates the sample and the energy is converted to thermal energy within the particles (Haeldermans et al., 2019), resulting in numerous advantages of high energy utilization rate, promoting chemical reaction and higher performance of pyrolysis products (Haeldermans et al., 2020; Luo et al., 2021). Besides, previous studies have shown that modification can change the physical and chemical properties of biochar, improve its surface oxygen-containing and carbon-containing functional groups, specific surface area and pore structure of biochar, and further improve its adsorption performance for heavy metals (Nair and Vinu, 2016; Tang et al., 2021). One-step microwave pyrolysis and activation method combines chemical activation and microwave pyrolysis, greatly shortening the reaction time, improving the process quality, and producing biochar with developed pore structure and high specific surface area with excellent performance (Liu et al., 2021).
Sodium alginate (SA) hydrogel, a natural polysaccharide extracted from brown algae, has been widely used as a adsorbent for cationic metals like Cr(VI) because of its natural non-toxicity, low cost, abundant functional groups and surface negativity (Yi et al., 2018). It is noteworthy that various techniques had been adopted to modify pristine hydrogels for overcoming its shortcomings such as low retention capacity of anions and marginal electrical conductivity. Cross-linking with Fe3+ could compensate the negative charges resulting from alginate structure. Besides, Fe3+ and hydroxyl groups could make a buffering pair to resist change of solution pH, which guarantees good performance of adsorbents over a larger pH range (Zhao et al., 2021).
Therefore, in this paper, bagasse was used as raw material, zinc chloride (ZnCl2) as activator, and biochar with high specific surface area and good adsorption performance was prepared by one-step microwave pyrolysis and activation. Then, two kinds of adsorptive materials were prepared by sol-gel method and embedding method, using the widely used and environmentally friendly sodium alginate (SA) as carrier, named as SA-C-Fe and SA-C-Fe(C), combining the advantages of biochar and alginate gel for improvement for Cr(VI) adsorption, easy separation and non-cracking crack. The removal experiments of Cr(VI) with SA-C-Fe and SA-C-Fe(C) were carried out to explore the influences of pH, adsorbent dosage, contact time and initial concentration on the Cr(VI) removal performances. The characterizations, potential adsorption mechanism, and kinetics were also investigated.
2 Material and methods
2.1 Materials
Bagasse was used as raw material to prepare biochar. The bagasse was collected from Jinan City, Shandong Province, China, and the proximate and ultimate analyses are shown in Table 1. The volatile of bagasse is high, about 68.7 wt.%, and the ash content is low due to its biomass properties. The content of C and O element of bagasse is high, about 58.29 wt.% and 31.57 wt.%, respectively, showing a good material for preparation of porous carbon materials. The analytical reagents used including: ZnCl2, FeCl3·3H2O, SA, and K2Cr2O7, these were obtained from Aladdin Industries.
2.2 Adsorbent preparation
2.2.1 Preparation of biochar
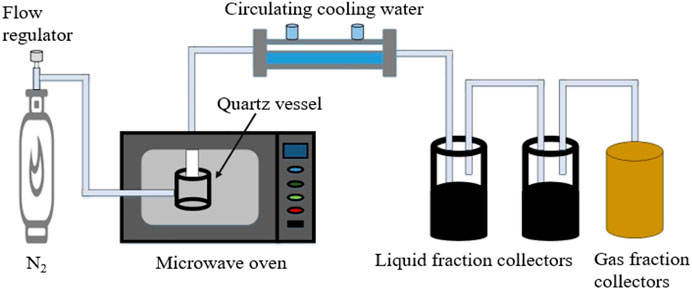
In order to obtain biochar with good performance, the optimal preparation conditions (microwave power: 500 W, ZnCl2/bagasse ratio: 2.5:1 and pyrolysis/activation time: 15 min) were selected to prepare biochar from orthogonal tests. It takes at least 120 min to complete the drying, carbonization and activation process of bagasse by conventional heating. However, the one-step microwave pyrolysis and activation method to prepare biochar only takes 15 min, which greatly shortens the process time and improves the process quality. The preparation process of adsorbent is shown in Figure 1.
Weigh 10 g of spare bagasse after pre-treatment and add 25 g of dried zinc chloride, mechanically stir to make it evenly mixed, add 10 g of silicon carbide to improve its absorbing performance, put the mixed sample into a quartz reactor in a microwave oven, and 0.2 L/min of N2 is used as the protective gas. First, N2 flow is introduced for 10 min to drive off the air in the reactor. The sample is rapidly pyrolyzed and activated for 15 min at microwave power 500 W. After collecting the solid products, the sample is washed continuously with hydrochloric acid or deionized water until the pH reaches 7, and it is dried at 105°C to obtain the required biochar.
2.2.2 Preparation of adsorbent
Dissolve a certain amount of SA in purified deionized water to obtain a 1.5% SA solution. After ground and sieved through a 60 mesh sieve, the biochar is added to the SA and heated to 50°C with mechanical stirring for 6 h until the sodium alginate and biochar are evenly mixed to obtain a SA-C mixed solution. Weigh different mass of FeCl3·3H2O and dissolve them in 100 ml of deionized water to obtain a FeCl3 solution of the required concentration. Using a pipette to add 40 ml of SA-C solution into 100 ml of FeCl3 to form pellets, and stir slowly at 25°C for 1 h. After the mixture was allowed to stand for 12 h, the pellets were collected and washed with deionized water several times to remove free Fe ions. The prepared pellets were dried in a vacuum freeze dryer for 24 h and then collected to obtain the SA-C-Fe composite material. The prepared SA-C-Fe composite material was heated at 400°C for 2 h, and then the SA-C-Fe(C) composite material was obtained.
2.3 Material and adsorbent characterization
The proximate and ultimate analysis of materials were carried out via PRC National Standard (GB/T 212-2008), and CHNS/O analyzer (Elementar Vario Micro cube, Germany), respectively. The surface area, and pore size were analyzed with an automated gas sorption analyzer (Autosorb iQ, Quantachrome, United States) and calculated using Brunauer-Emmett-Teller (BET) theory.
The adsorbents were characterized with a scanning electron microscope (SEM, SUPRA-55, Carl Zeiss, Germany) for surface morphology of SA modified microspheres, X-ray diffractometer (XRD, Panalytical, Netherland) for identification of Fe-bearing crystals by scanning 2θ from 10° to 80° with a 1.2°/min rate, X-ray photoelectron spectroscopy (XPS, Thermo ESCALAB 250XI, United States) for elemental composition, valence states and functional groups of fresh and spent adsorbents, and Fourier transform infrared spectroscopy equipped with a Thermo Nicolet spectrometer (FTIR, Thermo Fisher Nicolet 6700, United States) to determine functional groups of the SA modified microspheres.
The total Cr content was detected by ICP (ICP-AES, Perkin Elmer Optima 7000 DV, United States), and the content of Cr(VI) was detected though a spectrophotometry. Cr(VI) can react with diphenylcarbazide formed a purple complex, which can be determined by a UV spectrophotometer at the wavelength of 540 nm. The content of Cr(III) was calculated by the difference between the total Cr content and Cr(VI) (Zhang et al., 2018).
2.4 Adsorption experiments
2.4.1 Experimental methods
K2Cr2O7 was dissolved into deionized water to obtain a 1,000 mg/L Cr(VI) stock solution. And desirable concentration (25 mg/L, 50 mg/L, 75 mg/L, 100 mg/L, 200 mg/L, 300 mg/L, 400 mg/L, and 500 mg/L) of Cr(VI) solutions were prepared by diluting the stock solution. 50 mg of adsorbent was added to 50 ml Cr(VI) solution and shaken mechanically at 150 r/m in 25°C water bath oscillator for 24 h. The supernatant was taken to measure the Cr(VI) concentration in each sample, and the removal rate and removal amount were calculated, and different initial effect of concentrations on the removal effect can be obtained.
Adding 50 mg of adsorbent to 50 ml of 50 mg/L Cr(VI) solution, putting it in a 25°C water bath oscillator, shaking for 48 h at 150 r/m. After suction filtration with a 0.45 µm filter membrane, the supernatant was taken at different time to measure the concentration of Cr(VI), and the removal rate and amount were calculated, and the influence of contact time on the removal effect was obtained.
The pH of the Cr(VI) stock solution was adjusted to 2, 3, 4, 5, 7, and 9. Adding 50 mg of adsorbent to 50 ml of 50 mg/L Cr(VI) solution, and shaking it in 25°C water bath oscillator at 150 r/m for 24 h, taking the supernatant to measure the concentration of Cr(VI) in each sample, and the removal rate and removal amount were calculated, and effect of pH on the removal effect was obtained.
2.4.2 Data processing
The removal amount Qt (mg/g) is used to reflect the removal ability of different materials to Cr(VI). According to the change of Cr(VI) concentration before and after the reaction, the removal Qt is calculated by Eq. 1:
The removal rate of Cr(VI) is expressed by η(%), which is calculated by Eq. 2:
Qt is the total removal amount, mg/g; η is the total removal rate, %; C0 is the initial concentration of Cr(VI) in the solution, mg/L; V is the volume of the reaction solution, L; Ce is the concentration of Cr(VI) after the experiment is completed, mg/L; m is the mass of material dosing, g.
Langmuir isothermal adsorption model:
Qe is the removal amount in equilibrium reaction, mg/g; Qm is the maximum removal amount, mg/g; KL is Langmuir adsorption equilibrium constant, L/mg; Ce is the concentration of Cr(VI) in the solution at equilibrium reaction, mg/L.
Freundlich isothermal adsorption model:
KF is Freundlich adsorption equilibrium constant, L/mg; n is Freundlich constant.
Langmuir-Freundlich adsorption model:
Kb is Langmuir-Freundlich adsorption equilibrium constant, L/mg; n is Langmuir-Freundlich constant.
Pseudo-first-order kinetic model (Lagergren, 1898):
Qt is the removal amount when reaction to T, mg/g; k1 is the pseudo-first-order adsorption rate constant, min−1.
Pseudo-second-order kinetic model (Ho and McKay, 1998; Bujdak, 2020):
k2 is the pseudo-second-order adsorption rate constant, g/(mg min).
Intra-particle diffusion model (Weber and Morris, 1963):
kp is the diffusion rate constant in particles, mg/(g min0.5).
3 Results and discussion
3.1 Characterization of biochar
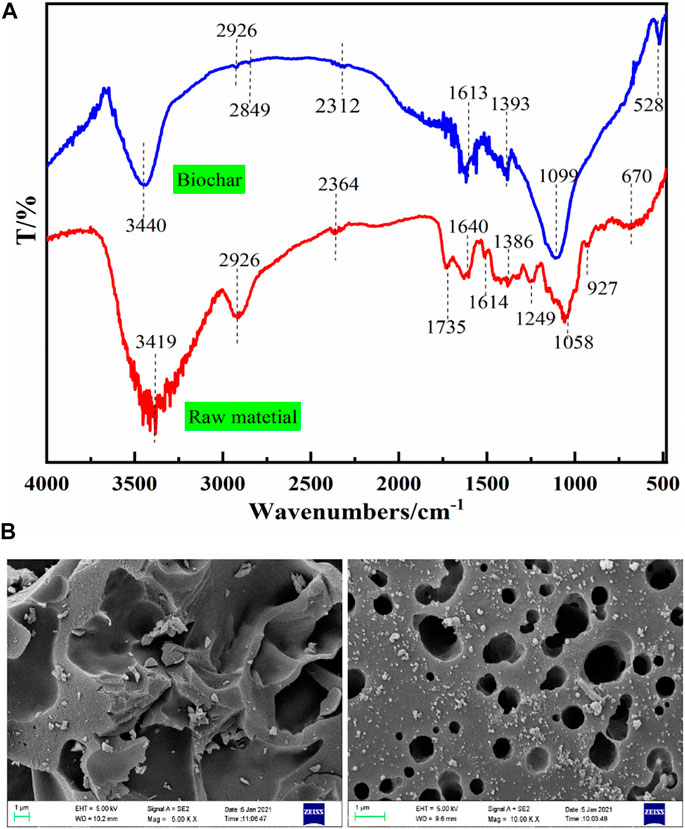
In order to better understand the chemical properties of biochar, the bagasse before and after microwave pyrolysis and activation were characterized and analyzed by FTIR. It can be seen from Figure 2A that bagasse contains O-H peak (3,419 cm−1) and C-H peak (2,926 cm−1), indicating the presence of alcohols, aliphatic-CH2- and alkane-CH3. In the frequency band with low wave number, there are C=O (1735 cm−1), C-H (1,386 cm−1 and 927 cm−1), C-O (1,249 cm−1), C-O-C (1,058 cm−1) and other groups, representing the existence of carbonyl, alkane, aliphatic, unsaturated ether, and ether bond, respectively (Zhao et al., 2014). In addition, there are absorption peaks caused by P-H stretching vibration at 2,364 cm−1 and first-hand peaks caused by bending vibration in N-H bond plane at 1,600–1,640 cm−1, indicating the existence of P and N elements in raw materials.
From the infrared spectrum of biochar, new C-H peaks (2,849 cm−1) and C-N (528 cm−1) appeared, indicating the formation of -CH3 group and N-containing group. Part of the absorption peak shifted, and the absorption peak of O-H shifted to 3,400 cm−1. The P-H absorption peak shifts to 2,312 cm−1. The N-H absorption peak shifted to 1,613 cm−1. The C-H bond absorption peak shifts to 1,393 cm−1, and the C-O-C bond superposition vibration absorption peak shifts to 1,099 cm−1, and the peak intensity becomes larger.
It can be found that some oxygen-containing and carbon-containing functional groups increase for the bagasse biochar obtained by microwave pyrolysis and activation, and the position of some absorption peaks shifts. The oxygen-containing functional groups can effectively improve the adsorption performance of the material for metal ions through electrostatic attraction, redox and complexation. The carbon-containing functional groups can increase the protonation reaction intensity of the adsorption material in acidic environment, generating more positive charge and promote the removal of Cr(VI) (Zhu et al., 2018).
The scanning electron microscopes (SEM) of bagasse biochar are shown in Figure 2B. There are a large number of folds and semi porous gullies on the surface of biochar. After magnification, many pore structures of different sizes are found, and a small amount of activator is attached to the outside. Compared with raw material, the biochar prepared by zinc chloride activation method produces more mesopores and micropores, the specific surface area is greatly increased, and the pore structure is more excellent, which provides a theoretical basis for improving the adsorption performance of bagasse biochar.
The N2 adsorption/desorption isotherm curves and pore size distribution of biochar are shown in Figures 3A,B. The N2 adsorption/desorption isotherm of biochar obtained from microwave pyrolysis and activation is type IV. When the relative pressure in the early stage of adsorption is low, the curve is convex upward, and the force between adsorbate and adsorbent is strong. Due to micropore filling, the adsorption capacity of bagasse biochar for nitrogen increases sharply with the increase of relative pressure, and the adsorption rate is very fast at this time. Then the relative pressure gradually increases, the adsorption capacity gradually increases, but the rate slows down, and there is no horizontal adsorption platform, indicating that there is a mesoporous structure in bagasse biochar. In the range of high relative pressure, the adsorption isotherm does not coincide with the desorption isotherm, which is due to the desorption hysteresis caused by capillary condensation of adsorbate. Calculated by BET method, the specific surface area of biochar is 1787.64 m2/g, the total pore volume is 1.535 cm3/g, and the average pore diameter is 3.434 nm. The pore size of biochar is mainly concentrated at 2–5 nm, indicating that bagasse biochar prepared by one-step microwave pyrolysis and activation of zinc chloride is mesoporous material.
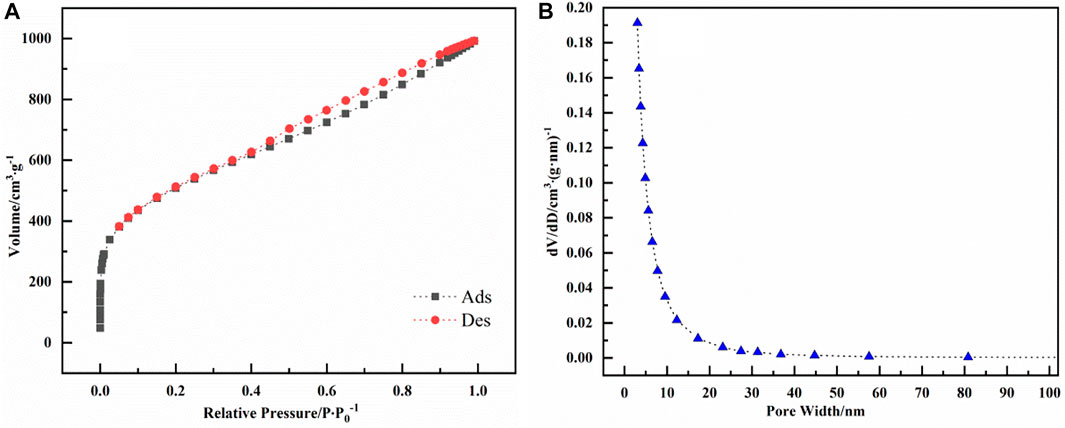
FIGURE 3. (A) shows the N2 adsorption/desorption isotherm curves of bagasse biochar prepared by microwave one-step pyrolysis activation of zinc chloride, and (B) shows the pore size distribution curve of biochar.
3.2 Preparation of biochar-embedding iron-alginate microspheres
3.2.1 Effect of sodium alginate concentration on pelletizing effect
Using FeCl3 as crosslinking agent, Na+ in SA will exchange with Fe3+ to form a three-dimensional network structure. Slowly drop different concentrations of SA solution into the same concentration of Fe3+ solution to study the effect of SA concentration on the balling effect.
When the concentration of SA is low, the viscosity of the solution is too small, making it difficult to form a ball, and the ball is easy to break and deform. When the concentration of SA is high, the viscosity of the solution is too high, making it difficult for the solution to drop out from the syringe pump. After the ball is formed, the ball is in a small cone shape with obvious tail, and the effect is not good. When the concentration of SA is 1.5%, the ball is round and has a better shape. Therefore, the concentration of SA is 1.5%.
3.2.2 Effect of FeCl3 concentration on pelletizing effect
When 1.5% SA solution and 1% biochar are mixed and added into FeCl3 solution of different concentrations, there is no significant difference in the shape of balls. In this experiment, Cr(VI) was used as the object for treatment. With the increase of FeCl3 concentration, the removal rate of Cr(VI) would be slightly reduced, probably because the FeCl3 concentration was at the time of 0.1 mol/L. The concentration of Fe3+ has reached the saturation value of the ion exchange reaction completely with Na+. When the FeCl3 concentration is too high, the excessive Fe3+ will occupy a small number of gel balls, and the three-dimensional network structure is too dense, resulting in a slight decrease in Cr(VI) removal rate. Therefore, the concentration of FeCl3 is 0.1 mol/L in the follow-up experiment.
3.2.3 Effect of biochar addition on pelletizing effect
Adding different quality of biochar into 1.5% SA solution and mixing evenly, and then dropping it into 0.1 mol/L FeCl3 solution. When the biochar addition amount is 0.5 and 1 g, the shape of the gel ball is no significant difference, and the shape of the ball is better. When the biochar addition is 1.5 g, the gel ball is easy to block the syringe. In this experiment, heavy metal Cr(VI) was used as the object of treatment, and three kinds of gel balls of the same quality were used to remove Cr(VI). With the increase of biochar content, Cr(VI) removal increased first from 79.94% (0.5 g) to 80.36% (1 g) and then decreased to 74% (1.5 g). This is because the excessive mass of biochar may affect the acid base stability, mechanical properties and mass transfer performance of pellets. Therefore, the biochar added in subsequent experiments is 1 g.
3.3 Properties of iron-alginate modified microspheres
The SEM of SA-C-Fe and SA-C-Fe (C) are shown in Figures 4A,B,C,D. The color of SA-C-Fe gel ball is black and the diameter is about 2–3 mm. The surface of SA-C-Fe has an irregular fold shape, and the surface is rougher with some pores. The inside of the gel ball has a through three-dimensional interlaced fibrous structure, which shows that the SA-C-Fe gel ball has rich pores and strong adsorption capacity for pollutants. The surface wrinkles of SA-C-Fe(C) disappear, and there are many protrusions of different sizes and shapes. The inner fibrous structure of the gel ball disappears, and many regular polygons appeared on the surface of the inner layer, which greatly increase the specific surface area of the material. This may be because the carbonation changes the molecular structure of SA itself and the morphology of iron ions, and a variety of iron-containing substances appears in SA-C-Fe(C).
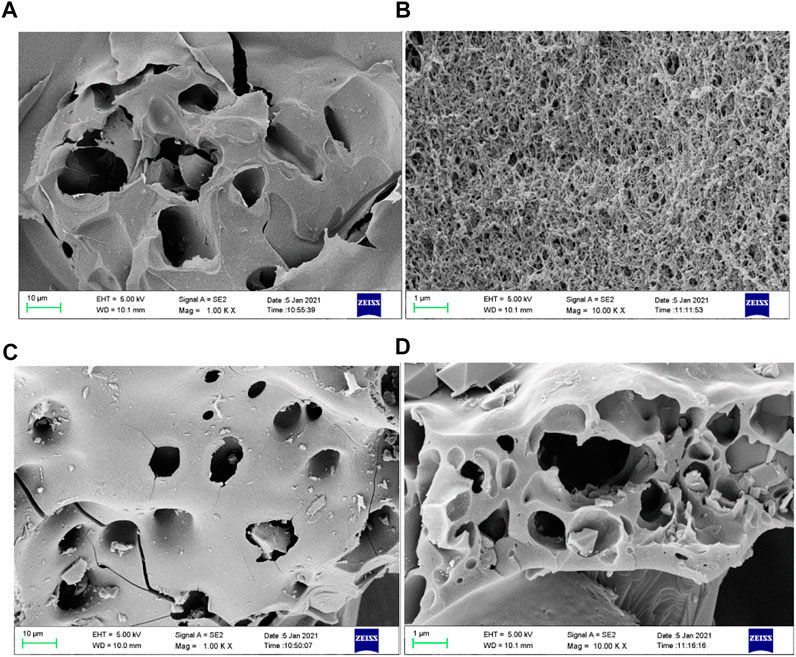
FIGURE 4. SEM of SA-C-Fe [(A) 1,000 times; (B) 10,000 times] and SA-C-Fe(C) [(C) 1,000 times; (D) 10,000 times].
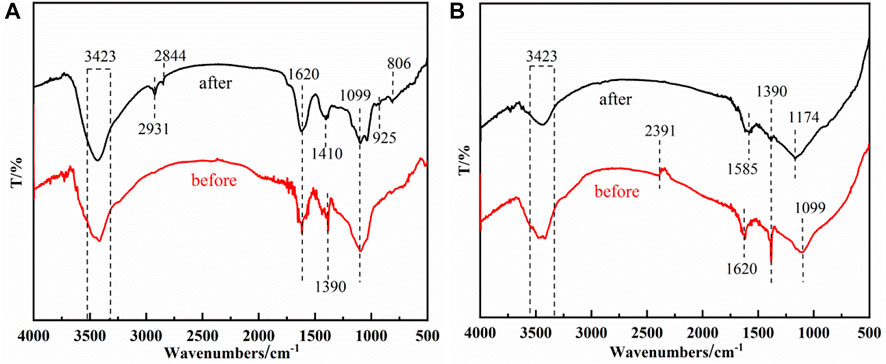
As shown in Figures 5A,B, the sodium alginate (SA) and iron-alginate modified microspheres (SA-C-Fe, SA-C-Fe(C)) were characterized by FTIR. In the infrared spectra of iron-alginate modified microspheres (SA-C-Fe, SA-C-Fe(C)), the three materials have common obvious characteristic peaks at 3,423 cm−1, 1,620 cm−1, 1,390 cm−1, and 1,099 cm−1. Compared with SA powder, the peak intensity of characteristic peaks at 3,423 cm−1, 1,620 cm−1 and 1,099 cm−1 decrease, and 1,390 cm−1 produces a new absorption peak, which is generated by CH3 symmetrical variable angle vibration. Due to the cross-linking of sodium alginate and iron ions, the characteristic peaks at 2,922 cm−1, 1,305 cm−1, 1,037 cm−1, 954 cm−1, 890 cm−1, 821 cm−1, and 627 cm−1 disappeared.
The test results showed that the specific surface area of SA-Fe ball is 85.58 m2/g. In contrast, the specific surface area of SA-C-Fe ball is 756.25 m2/g, and after carbonization at 400°C for 2 h, the specific surface area of SA-C-Fe(C) ball has increased to 987.55 m2/g. It is proved that carbonization also successfully increases the specific surface area of the material. The total pore volume of SA-C-Fe ball and SA-C-Fe(C) ball are 0.659 cm3/g and 0.841 cm3/g, respectively. After carbonization, the total pore volume of SA-C-Fe(C) ball becomes larger, which relatively improves the capacity of the material to hold heavy metal particles.
3.4 Removal of Cr(VI) by iron-alginate modified microspheres
3.4.1 Analysis of different initial concentrations and isotherm adsorption models
Figures 6A,B show the effect of the initial concentration of Cr(VI) from 25 mg/L to 500 mg/L on the removal performance of SA-C-Fe and SA-C-Fe(C). It can be seen that as the initial concentration of Cr(VI) gradually increases, the Cr(VI) removal of SA-C-Fe and SA-C-Fe(C) both increases, and the removal rate shows a downward trend. On the one hand, the available adsorption and reduction sites on a certain dose of material are fixed, as the concentration of Cr(VI) increases, it will be gradually saturated by Cr(VI) ions. The concentration of Cr(VI) will accelerate the passivation of the iron surface and the adhesion of Fe/Cr (hydrogen) oxide precipitates on the surface of materials. These negative factors caused by increasing the initial Cr(VI) concentration hinder the continuous reaction of Cr(VI) with the material, which in turn leads to a decrease in removal efficiency. The maximum removal of Cr(VI) by SA-C-Fe reaches 156.8 mg/g when the initial concentration is 500 mg/L, and 31.3% of Cr(VI) is removed from the solution. The maximum removal of Cr(VI) by SA-C-Fe(C) reaches 237.4 mg/g when the initial concentration is 500 mg/L, which reflects the effect of initial concentrations on the powerful Cr(VI) removal ability of material.
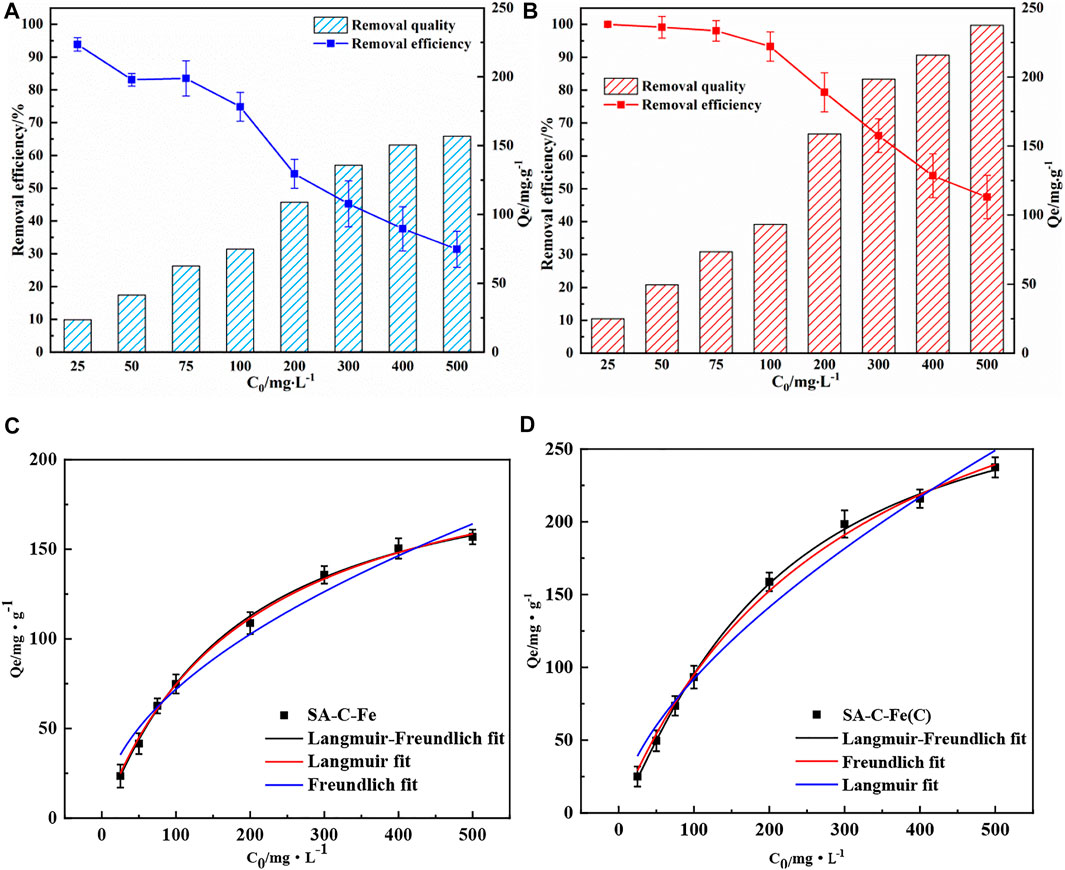
FIGURE 6. Initial concentrations on Cr(VI) removal efficiency (A)SA-C-Fe; (B)SA-C-Fe(C) and Langmuir-Freundlich, Langmuir and Freundlich isothermal models for isotherm adsorption (C)SA-C-Fe; (D)SA-C-Fe(C).
For SA-C-Fe (Figure 6C), the correlation coefficient of the Langmuir-Freundlich isotherm model (R2 = 0.998) is the largest compared with the correlation coefficient of the Langmuir isotherm model (R2 = 0.997) and Freundlich isotherm model (R2 = 0.975), so Langmuir-Freundlich isotherm adsorption model can better fit the experimental data of SA-C-Fe to remove Cr(VI) with different initial mass concentration (Hadi et al., 2010; Sen Gupta and Bhattacharyya, 2011). As shown in Table 2, the maximum theoretical removal of Cr(VI) by the SA-C-Fe calculated by the Langmuir-Freundlich isotherm adsorption model is 211.87 mg/g. For the SA-C-Fe(C) (Figure 6D), the correlation coefficient of the Langmuir-Freundlich isotherm model (R2 = 0.999) is the largest compared with the correlation coefficient of the Langmuir isotherm model (R2 = 0.997) and Freundlich isotherm model (R2 = 0.975), so the Langmuir-Freundlich isotherm adsorption model can better fit the experimental data of SA-C-Fe(C) to remove Cr(VI) with different initial mass concentrations, and use the Langmuir-Freundlich isotherm adsorption model to calculate the SA-C-Fe(C) ball to Cr(VI) the maximum theoretical removal of 311.24 mg/g. Compared to similar studies (Gokila et al., 2017; Wang et al., 2017; Ahmad et al., 2021), obviously, the adsorption capacity of SA-C-Fe and SA-C-Fe(C) for Cr(VI) in this study was higher than that of other adsorbents, showing excellent prospects for Cr(VI) removal.
3.4.2 Effect of contact time and adsorption kinetic model
Figure 7 shows the effect of contact time on the Cr(VI) removal of SA-C-Fe and SA-C-Fe(C) materials. The reaction process can be divided into three stages. For SA-C-Fe(C), in the initial stage, the removal rate of Cr(VI) increases rapidly, reaching 53.3% at 0.25 h, belonging to the fast reaction stage. The removal rate of Cr(VI) increases from 53.3% to 99.4% at the interval of 0.25–8 h. The removal rate at this stage increases slowly, belonging to the slow reaction stage. After the contact time of 8 h, the removal rate changes little, and the reaction is basically completed in the dynamic equilibrium stage.
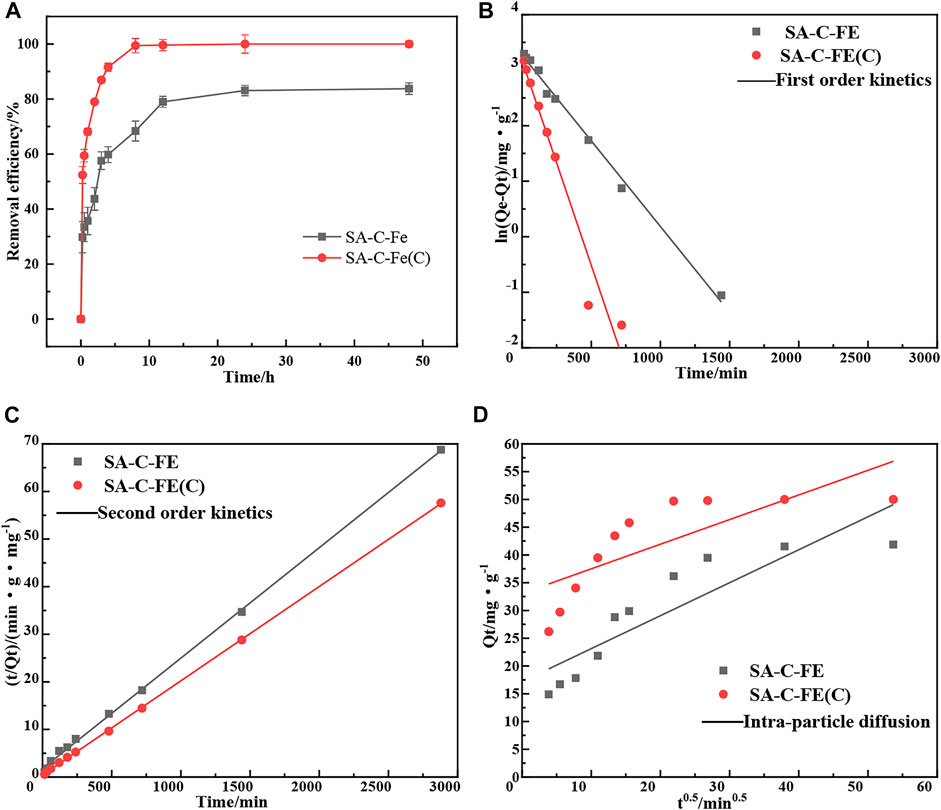
FIGURE 7. Effect of contact time (A) on Cr(VI) removal efficiency and fitting of pseudo-first-order kinetic model (B), pseudo-second-order kinetic model (C) and intra-particle diffusion model (D) for Cr(VI) removal.
For SA-C-Fe, the removal rate of Cr(VI) increases rapidly to 29.7% at the interval of 0–0.25 h, which is a fast reaction stage. At the interval of 0.25–24 h, the removal rate of Cr(VI) increases slowly from 29.7% to 83.1%, which is a slow reaction stage. Within 24 h thereafter, the removal rate of Cr(VI) is basically unchanged, and it is at the dynamic equilibrium stage after the reaction is completed. There are a large number of active sites on the surface at the beginning of the reaction. Cr(VI) will rapidly diffuse to the surface and pores of the material, and the reaction rate is faster, which significantly improves the removal rate. However, when the reaction continues, the active sites on the surface of materials are constantly consumed, causing the adsorption rate to gradually slow down, and then the dynamic adsorption equilibrium is reached. In addition, it can be seen that the Cr(VI) removal rate of SA-C-Fe(C) is higher than that of SA-C-Fe, and the reaction rate is faster. The adsorption of SA-C-Fe(C) reaches the dynamic equilibrium stage in 8 h, but for SA-C-Fe, it does not reach the dynamic equilibrium stage until 24 h, which proves that the carbonization method successfully improves the removal performance of the material for Cr(VI).
The kinetics of SA-C-Fe and SA-C-Fe(C) for removing Cr(VI) in solution is an important part of evaluating the material in the specific application process, which is helpful to further study the removal mechanism of Cr(VI) and the description of the removal process of Cr(VI) in solution. Herein, the pseudo-first-order kinetic model (Bozkurt et al., 2011; Naushad et al., 2019), the pseudo-second-order kinetic model (Jang et al., 2018; Sharma et al., 2019) and intra-particle diffusion model are used to fit the reaction kinetic data of 0.05 g material to remove 50 mg/L Cr(VI) (Figures 7B–D), and analyze its kinetic characteristics.
The relevant parameters of the adsorption kinetic models are shown in Table 3. Obviously, from the perspective of the correlation coefficient, the R2 of the pseudo-second-order kinetic model of SA-C-Fe and SA-C-Fe(C) are both greater than the R2 of the other two models. Compared with the equilibrium removal amount of Cr(VI) calculated by the pseudo-first-order kinetic model and intra-particle diffusion model, the fitting adsorption value of Cr(VI) by the pseudo-second-order kinetic model is closer to the measured value (41.88 mg/g and 50 mg/g), and the fitting adsorption values are 43.10 mg/g and 50.48 mg/g, respectively. And the correlation coefficient R2 of the pseudo-second-order kinetic model of the two materials is greater than 0.99, and the fitting effect is quite good. Therefore, the adsorption process is more consistent with the pseudo-second-order kinetic model. This may be due to the fact that pseudo-first-order kinetics equations generally apply to processes that are relatively unitary in adsorption kinetics.
The pseudo-second-order kinetic model includes all the adsorption processes, such as liquid film diffusion and surface adsorption. As the adsorption rate k1 of the pseudo-first-order kinetic model is higher than that of k2 of the pseudo-second-order kinetic model, it can be inferred that the adsorption is balanced by rapid physical adsorption, and then fixed in the form of chemical adsorption. The fitting curve of intra-particle diffusion model does not pass through the origin, which indicates that intra-particle diffusion cannot solely control the adsorption rate (Liu et al., 2015). Based on the analysis of different kinetic models, the adsorption of Cr(VI) on these two materials is controlled by the processes of intra-particle diffusion and chemisorption.
3.4.3 Effect of pH
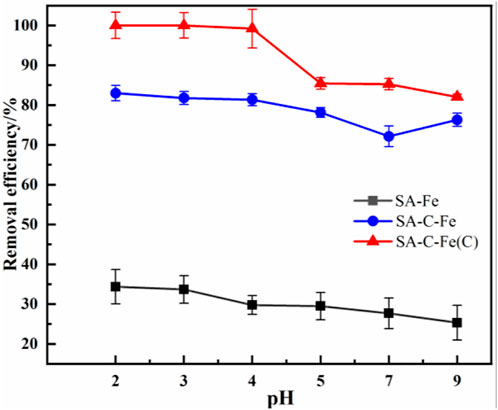
The pH of the solution is one of the main factors that affect the removal of heavy metal ion pollutants from the water environment (Lin et al., 2018). In order to select the optimal pH value of iron-alginate modified microspheres to remove Cr(VI), the adsorption properties of SA-Fe, SA-C-Fe and SA-C-Fe(C) were studied at the pH = 2, 3, 4, 5, 7, and 9. It can be seen from Figure 8 that the removal effect of Cr(VI) is better when the pH is lower. With the increase of pH, the removal efficiency for Cr(VI) of the three materials gradually decreases. After 24 h of reaction, with the pH increasing from 2 to 5, 7, and 9, the removal efficiency of Cr(VI) by SA-C-Fe(C) decreased from 100% to 99.2%, 85.4%, 85.2%, the final removal efficiency of 24 h at pH = 9 drops to 82.0%, and the removal rate reaches more than 99% under the condition of pH ≤ 4.0. The removal efficiency of Cr(VI) by SA-C-Fe decreased from 83.0% to 81.8%, 81.3%, 78.1%, 72.1%, and the final removal efficiency of 24 h at pH = 9 is 76.2%.
Previous studies have shown that the effect of pH on the removal efficiency is mainly achieved by changing the surface charge characteristics of the adsorption material and changing the existing form of heavy metal ion pollutants. Affected by different pH conditions, Cr(VI) has many different forms in aqueous solution, including Cr2O72−, HCr2O7−, CrO42−, HCrO4− and H2CrO4. The forms of HCrO4− and H2CrO4 mainly exist in acidic conditions, while the forms of CrO42− mainly exist when the pH of the solution is higher than 6 (Huang et al., 2016b). HCrO4− and Cr2O72− have lower free energy of adsorption than CrO42−, so they are easier to be adsorbed on the surface of the material (Duan et al., 2017). On the other hand, Cr(VI) species are negatively charged in any state, so the positively charged adsorbent will be more electrostatically attracted to Cr(VI) anions (Dong et al., 2014). However, as the pH increases, the -COOH and -OH groups in the beads gradually dissociate and the surface is negatively charged, which inevitably leads to low efficiency (Lin et al., 2018).
3.5 Proposed removal mechanism
The XPS spectra of SA-C-Fe and SA-C-Fe(C) before and after reaction were characterized and shown in Figure 9 for studying the main mechanism of the Cr(VI) removal process. It can be seen from Figure 9A that after the reaction, the SA-C-Fe has a new Cr2p peak, proving that SA-C-Fe has successfully absorbed Cr(VI). In Figure 9B, for SA-C-Fe before reaction, the spectra of Fe2p shows two main peaks at the binding energies of 709.3 and 721.7 eV, corresponding to Fe2p3/2 and Fe2p1/2 respectively. After the reaction (Figure 9C), the binding energies of Fe2p3/2 and Fe2p1/2 peaks change to 709.4 and 721.9 eV. The loss of electrons is accompanied by the increase of binding energy, and the gain of electrons is accompanied by the decrease of binding energy, indicating that there is a change of electron flow between metal ions in the adsorption process. In the narrow scan XPS spectrum of Cr2p for SA-C-Fe after reaction in Figure 9D, the peak with binding energy of 584.6 eV belongs to Cr(VI) of Cr2p1/2 orbit, the peak with binding energy of 578.3 eV belongs to Cr(VI) of Cr2p3/2 orbit, and the peak with binding energy of 574.7 eV belongs to Cr(III) of Cr2p3/2 orbit. It is proved that Cr(VI) and Cr(III) coexist in SA-C-Fe.
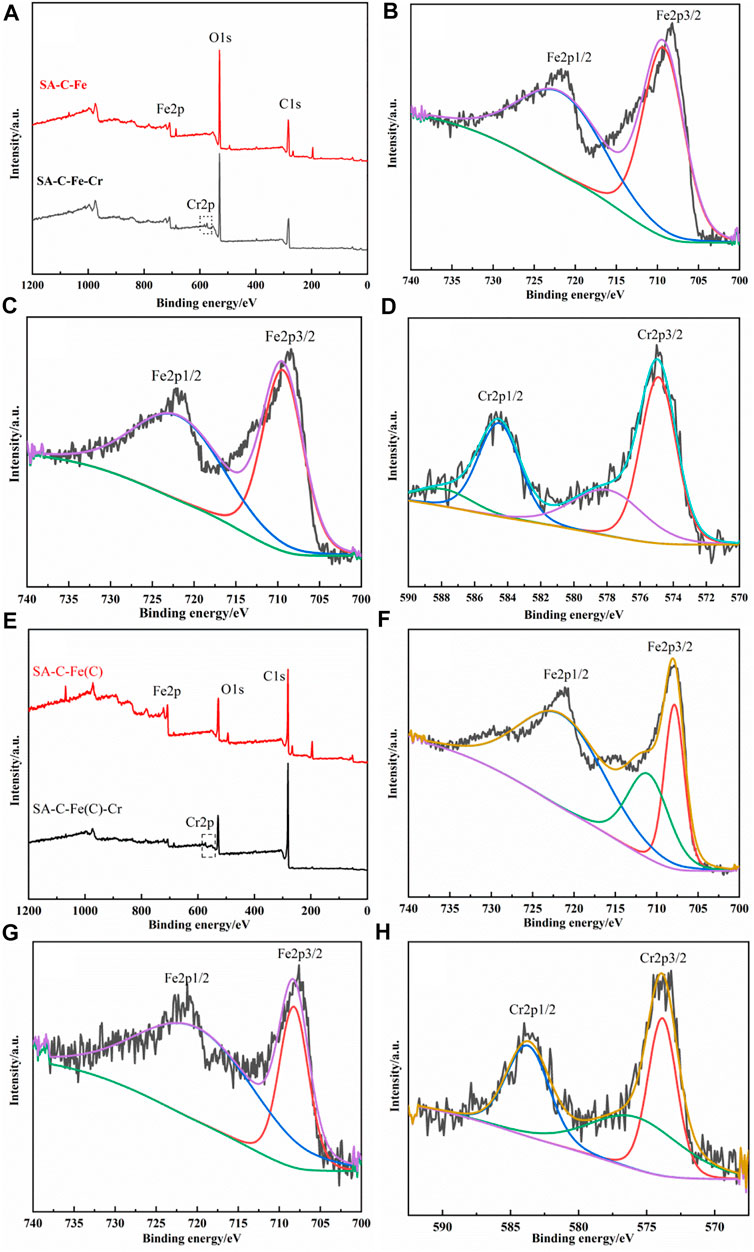
FIGURE 9. XPS spectra of SA-C-Fe and SA-C-Fe(C) before and after reaction. SA-C-Fe:(A)Total spectrum of XPS energy spectrum before and after the reaction; (B) High-resolution Fe region energy spectrum before the reaction; (C) High-resolution Fe region energy spectrum after the reaction; (D) High-resolution Cr region energy spectrum after the reaction. SA-C-Fe(C): (E) Total spectrum of XPS energy spectrum before and after the reaction; (F) High-resolution Fe region energy spectrum before the reaction; (G) High-resolution Fe region energy spectrum after the reaction; (H) High-resolution Cr region energy spectrum after the reaction.
It can be seen from Figure 9E that after reaction, the SA-C-Fe(C) adds a clear Cr2p peak at 575 eV, proving that the chromium has been successfully removed by SA-C-Fe(C), and compared with Figure 9A, the height of the C1s peak of the SA-C-Fe(C) increases after carbonization, the proportion of carbon content increases, and the O1s peak height decreases significantly. In Figure 9F, the narrow scan XPS spectrum of Fe2p of the SA-C-Fe(C) before the reaction has an obvious peak at the binding energy is 721.4 eV, which corresponds to the Fe3O4 of Fe2p1/2 orbital. The peaks at 711.0 and 707.8 eV corresponds to the Fe2O3 and Fe (0) of the Fe2p3/2 orbital respectively. Compared with Figure 9B, the existing form of iron has changed after the material is carbonized, which is consistent with the above SEM characterization results. In Figure 9G, the narrow scan XPS spectra of Fe2p of the SA-C-Fe(C) after reaction, due to the change of electron flow between the metal ions during the adsorption process, the binding energy of Fe3O4 of Fe2p1/2 orbital changes to 720.0 eV, and the peak position at 708.2 eV corresponding to Fe2O3, Fe (0) of Fe2p3/2 orbital disappears, which confirms that during the process of removing Cr(VI) by SA-C-Fe(C), redox reaction occurred. For the narrow scan XPS spectrum of Cr2p of SA-C-Fe(C) after reaction in Figure 9F, the peak position of binding energy of 584.7 eV belongs to Cr(VI) of Cr2p1/2 orbital, and the peak position of binding energy 575.7 eV belongs to Cr(VI) of Cr2p3/2 orbital, and the peak position of 573.8 eV belongs to Cr(III) of Cr2p3/2 orbital, which proves that Cr(VI) and Cr(III) coexist in SA-C-Fe(C).
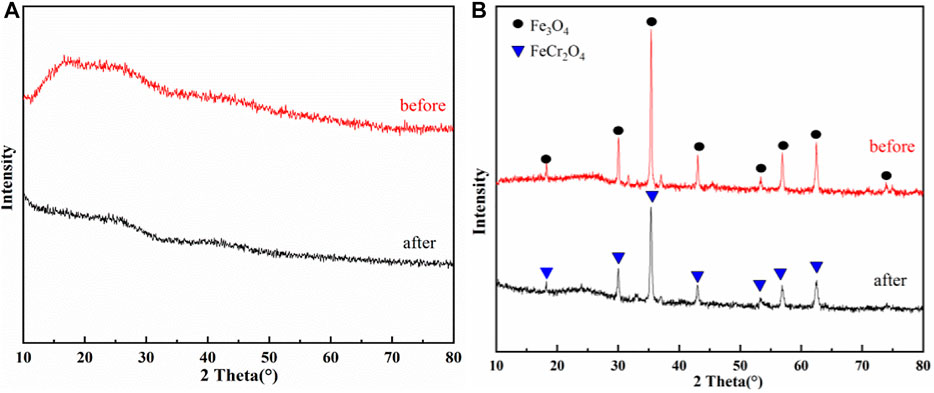
As shown in Figures 10A,B, XRD diffraction analysis of iron-alginate modified microspheres (SA-C-Fe, SA-C-Fe(C)) shows that there are no obvious diffraction peaks in the spectra of SA-C-Fe, which proves that there is no obvious crystal structure in the material. There are six obvious characteristic absorption peaks of Fe3O4 at 2θ = 30.1°, 35.5°, 43.1°, 53.4°, 57.0°, and 62.6° for the carbonized material SA-C-Fe(C), which proves that the main existing form of Fe3+ changes to Fe3O4 after carbonization at 400°C for 2 h. For SA-C-Fe, the carbon structure exists before reaction in the range of 2θ = 15°–23°, but it disappears after the reaction, which proves that carbon participates in the removal of Cr(VI). For SA-C-Fe(C) after reaction there are seven characteristic peaks corresponding to FeCr2O4 precipitation at 2θ = 18.3°, 30.1°, 35.4°, 37.1°, 43.1°, 53.5°, 57.0°, and 62.7° (Lv et al., 2013), which proves that Cr(III) is one of the main existing forms after chromium removal and exists in the material in the form of Fe/Cr oxide (Zhou et al., 2022).
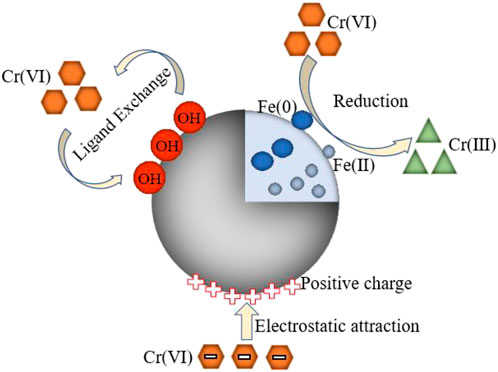
Based on the above analysis, the removal mechanism of Cr(VI) mainly includes the following three parts as shown in Figure 11:
(1) Redox reactions
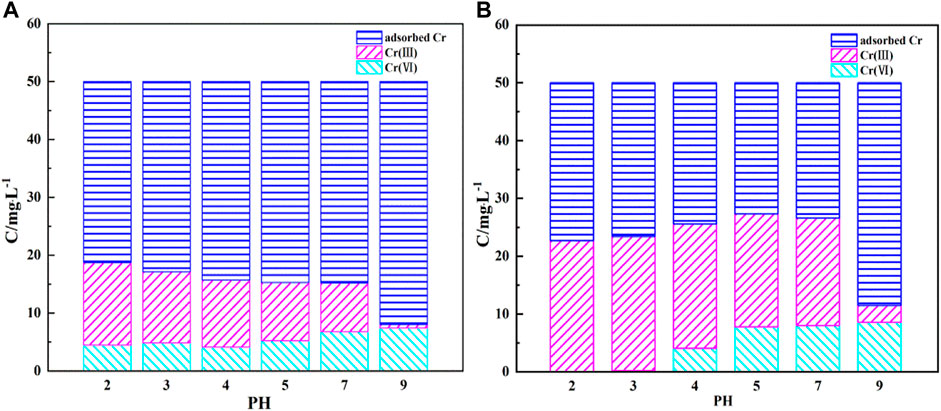
For better understanding the Cr(VI) removal process, the changes of chromium concentration in the solution after the reaction are studied, including total chromium, Cr(III) and Cr(VI). It can be seen from Figure 12 that after SA-C-Fe removes Cr(VI), there is Cr(III) in the solution, which proves that a certain oxidation-reduction reaction has occurred during the removal process. The concentration of Cr(III) in the solution under acidic conditions is relatively high, indicating that the oxidation-reduction reaction of Cr(VI) accounts for a relatively large amount under this condition. This is because the higher the H+ concentration, the higher the positive redox potential of Cr(VI). The amino, hydroxyl, carboxyl and other functional groups in the SA-C-Fe ball material act as electron donors, and the electrons can supply Cr(VI) is reduced to Cr(III), the reduction reaction is as follows (Lin et al., 2018; Xu et al., 2020):
The higher the H+ concentration, the easier Cr(VI) is to be reduced. This is because a large amount of H+ needs to be consumed during the reaction. However, as the pH of the solution increases to neutral or alkaline, the redox potential of Cr(VI) and the adsorption force between Cr(VI) and the adsorbent will decrease. Therefore, less Cr(VI) will be reduced and the concentration of Cr(III) will gradually decrease. The concentration of Cr(III) in solution decreases with the increase of initial pH. There is less Cr(III) when the initial pH = 9, because when the solution contains a large amount of OH−, Cr(III) and OH− are easy to combine to form a precipitate, as shown in Eq. 12:
It can be seen from Figure 12 that compared to SA-C-Fe, after SA-C-Fe(C) removing Cr(VI), there is a higher concentration of Cr(III) in the solution. The redox reaction accounts for a higher proportion of Cr(III) in the entire removal process. This is because in addition to the redox reaction of the functional group as an electron donor, Fe (0) and Fe3O4 are produced in the carbonized material SA-C-Fe(C), in the initial stage of the removal reaction, Fe2+ in Fe (0) and Fe3O4 is used to consume a large amount of H+ to achieve Cr(VI) reduction, as shown in Eqs 13–16 (Lv et al., 2013):
Therefore, the reaction rate of SA-C-Fe(C) is faster, and the concentration of Cr(VI) drops rapidly at the beginning of the reaction. Compared with SA-C-Fe SA-C-Fe(C) has a stronger effect on the theoretical removal capacity of Cr(VI) is also higher.
(2) Adsorption
The adsorption effect in the removal process of Cr(VI) is mainly divided into electrostatic adsorption and ion exchange.
The electrostatic adsorption is mainly the process of removing Cr(VI) through electrostatic attraction after the active groups such as hydroxyl and carboxyl groups in the adsorbing material have changed. Affected by different pH conditions, Cr(VI) has a variety of different forms in aqueous solutions, including Cr2O72−, HCr2O7−, CrO42−, HCrO4−, and H2CrO4, all of which are negatively charged. Hydrogen ions can protonate seaweeds under acidic conditions. Active adsorption sites such as hydroxyl group (Rojas et al., 2018) and carboxyl group (Zheng et al., 2011) on the adsorbent material make the surface of the adsorbent material present a positive charge, and the electrostatic attraction with negatively charged pollutant ions increases, so the adsorption capacity is higher under acidic conditions.
Ion exchange refers to the exchange of ions on the functional groups of the adsorbent material with the different existing forms of chromium in the solution, so that chromium ions replace the original ions to attach to the functional groups of the material, and always maintain the anion and cation balance in the solution. The part of ion exchange adsorption can be recycled (Maleki et al., 2015). The forms of HCrO4− and Cr2O72− mainly exist in acidic conditions, and the form of CrO42− mainly exists when the pH of the solution is greater than 6. In contrast, HCrO4− has lower adsorption free energy. Therefore, the higher the concentration of HCrO4−, the easier the ion exchange reaction between HCrO4− and functional groups will occur.
4 Conclusion
The Cr(VI) adsorption performances over the iron-alginate microspheres (SA-C-Fe, SA-C-Fe(C)) produced by one-step microwave pyrolysis and activation of bagasse biochar were investigated in this study. Results show that the iron-alginate microspheres prepared by one-step microwave pyrolysis and activation exhibit excellent Cr(VI) adsorption performance due to more developed pore structure and larger specific surface area. The removal process of Cr(VI) by SA-C-Fe and SA-C-Fe(C) is greatly affected by pH, and the removal rate gradually decreases with the increase of pH, and the removal effect is best when pH = 2. The entire adsorption process is more in line with the Langmuir-Freundlich isotherm model and the pseudo-two-order kinetic model. Using Langmuir-Freundlich isothermal model and the pseudo-two-order kinetic model, the maximum removal rates of Cr(VI) by SA-C-Fe and SA-C-Fe(C) were 211.87 mg/g and 311.24 mg/g, respectively. The removal mechanism for Cr(VI) is divided into adsorption and redox reaction. The redox reaction of SA-C-Fe(C) accounts for a larger proportion, because the morphology of Fe changes after carbonization, resulting in a reduced valence state of Fe, which better promotes the reduction of Cr(VI).
Data availability statement
The raw data supporting the conclusion of this article will be made available by the authors, without undue reservation.
Author contributions
HW: Writing. XZ: Conceptualization, writing—review and editing. XY: Resources, validation. SS: Writing—original draft preparation, investigation, methodology. WW: Resources, conceptualization. YM: Resources, validation. ZS: Funding acquisition, supervision.
Funding
This work was supported by the Key R&D Plan of Shandong Province (2019JZZY020310).
Conflict of interest
XY was employed by Shandong Environmental Protection Industry Group Co.
The remaining authors declare that the research was conducted in the absence of any commercial or financial relationships that could be construed as a potential conflict of interest.
Publisher’s note
All claims expressed in this article are solely those of the authors and do not necessarily represent those of their affiliated organizations, or those of the publisher, the editors and the reviewers. Any product that may be evaluated in this article, or claim that may be made by its manufacturer, is not guaranteed or endorsed by the publisher.
References
Ahmad, W., Qaiser, S., Ullah, R., Mohamed Jan, B., Karakassides, M. A., Salmas, C. E., et al. (2021). Utilization of tires waste-derived magnetic-activated carbon for the removal of hexavalent chromium from wastewater. Materials 14, 34. doi:10.3390/ma14010034
Alvarado, L., Rodriguez Torres, I., and Chen, A. (2013). Integration of ion exchange and electrode ionization as a new approach for the continuous treatment of hexavalent chromium wastewater. Sep. Purif. Technol. 105, 55–62. doi:10.1016/j.seppur.2012.12.007
Barrera-Diaz, C. E., Lugo-Lugo, V., and Bilyeu, B. (2012). A review of chemical, electrochemical and biological methods for aqueous Cr(VI) reduction. J. Hazard. Mat. 223, 1–12. doi:10.1016/j.jhazmat.2012.04.054
Bozkurt, S. S., Molu, Z. B., Cavas, L., and Merdivan, M. (2011). Biosorption of uranium (VI) and thorium (IV) onto ulva gigantea (kutzing) bliding: Discussion of adsorption isotherms, kinetics and thermodynamic. J. Radioanal. Nucl. Chem. 288, 867–874. doi:10.1007/s10967-011-1010-5
Bujdak, J. (2020). Adsorption kinetics models in clay systems. The critical analysis of pseudo-second order mechanism. Appl. Clay Sci. 191, 105630. doi:10.1016/j.clay.2020.105630
Dong, X., Ma, L. Q., Gress, J., Harris, W., and Li, Y. (2014). Enhanced Cr(VI) reduction and As(III) oxidation in ice phase: important role of dissolved organic matter from biochar. J. Hazard. Mat. 267, 62–70. doi:10.1016/j.jhazmat.2013.12.027
Duan, S., Ma, W., Pan, Y., Meng, F., Yu, S., and Wu, L. (2017). Synthesis of magnetic biochar from iron sludge for the enhancement of Cr(VI) removal from solution. J. Taiwan Inst. Chem. Eng. 80, 835–841. doi:10.1016/j.jtice.2017.07.002
Gokila, S., Gomathi, T., Sudha, P. N., and Anil, S. (2017). Removal of the heavy metal ion chromiuim(VI) using Chitosan and Alginate nanocomposites. Int. J. Biol. Macromol. 104, 1459–1468. doi:10.1016/j.ijbiomac.2017.05.117
Hadi, M., Samarghandi, M. R., and McKay, G. (2010). Equilibrium two-parameter isotherms of acid dyes sorption by activated carbons: study of residual errors. Chem. Eng. J. 160, 408–416. doi:10.1016/j.cej.2010.03.016
Haeldermans, T., Campion, L., Kuppens, T., Vanreppelen, K., Cuypers, A., and Schreurs, S. (2020). A comparative techno-economic assessment of biochar production from different residue streams using conventional and microwave pyrolysis. Bioresour. Technol. 318, 124083. doi:10.1016/j.biortech.2020.124083
Haeldermans, T., Claesen, J., Maggen, J., Carleer, R., Yperman, J., Adriaensens, P., et al. (2019). Microwave assisted and conventional pyrolysis of MDF – characterization of the produced biochars. J. Anal. Appl. Pyrolysis 138, 218–230. doi:10.1016/j.jaap.2018.12.027
Hilbrandt, I., Ruhl, A. S., Zietzschmann, F., Molkenthin, M., and Jekel, M. (2019). Competition in chromate adsorption onto micro-sized granular ferric hydroxide. Chemosphere 218, 749–757. doi:10.1016/j.chemosphere.2018.11.152
Ho, Y. S., and McKay, G. (1998). Sorption of dye from aqueous solution by peat. Chem. Eng. J. 70 (2), 115–124. doi:10.1016/s0923-0467(98)00076-1
Huang, X., Hou, X., Song, F., Zhao, J., and Zhang, L. (2016). Facet-dependent Cr(VI) adsorption of hematite nanocrystals. Environ. Sci. Technol. 50, 1964–1972. doi:10.1021/acs.est.5b05111
Huang, X., Liu, Y., Liu, S., Tan, X., Ding, Y., Zeng, G., et al. (2016). Effective removal of Cr(VI) using beta-cyclodextrin-chitosan modified biochars with adsorption/reduction bifuctional roles. RSC Adv. 6, 94–104. doi:10.1039/c5ra22886g
Jang, H. M., Yoo, S., Choi, Y.-K., Park, S., and Kan, E. (2018). Adsorption isotherm, kinetic modeling and mechanism of tetracycline on Pinus taeda-derived activated biochar. Bioresour. Technol. 259, 24–31. doi:10.1016/j.biortech.2018.03.013
Lagergren, S. K. (1898). About the theroy of so-called adsorption of soluble substances. Sven. Vetenskapsakad. Hand. 24 (4), 1–39.
Li, K., Huang, Z., Zhu, S., Luo, S., Yan, L., Dai, Y., et al. (2019). Removal of Cr(VI) from water by a biochar-coupled g-C3N4 nanosheets composite and performance of a recycled photocatalyst in single and combined pollution systems. Appl. Catal. B Environ. 243, 386–396. doi:10.1016/j.apcatb.2018.10.052
Li, R., Deng, H., Zhang, X., Wang, J. J., Awasthi, M. K., Wang, Q., et al. (2019). High-efficiency removal of Pb(II) and humate by a CeO2-MoS2 hybrid magnetic biochar. Bioresour. Technol. 273, 335–340. doi:10.1016/j.biortech.2018.10.053
Lin, C., Luo, W., Luo, T., Zhou, Q., Li, H., and Jing, L. (2018). A study on adsorption of Cr(VI) by modified rice straw: characteristics, performances and mechanism. J. Clean. Prod. 196, 626–634. doi:10.1016/j.jclepro.2018.05.279
Liu, C., Liu, X., He, Y., An, X., Fan, D., and Wu, Z. (2021). Microwave-assisted catalytic pyrolysis of apple wood to produce biochar: co-pyrolysis behavior, pyrolysis kinetics analysis and evaluation of microbial carriers. Bioresour. Technol. 320, 124345. doi:10.1016/j.biortech.2020.124345
Liu, N., Charrua, A. B., Weng, C.-H., Yuan, X., and Ding, F. (2015). Characterization of biochars derived from agriculture wastes and their adsorptive removal of atrazine from aqueous solution: a comparative study. Bioresour. Technol. 198, 55–62. doi:10.1016/j.biortech.2015.08.129
Liu, N., Zhang, Y., Xu, C., Liu, P., Lv, J., Liu, Y., et al. (2020). Removal mechanisms of aqueous Cr(VI) using apple wood biochar: a spectroscopic study. J. Hazard. Mat. 384, 121371. doi:10.1016/j.jhazmat.2019.121371
Liu, W., Jin, L., Xu, J., Liu, J., Li, Y., Zhou, P., et al. (2019). Insight into pH dependent Cr(VI) removal with magnetic Fe3S4. Chem. Eng. J. 359, 564–571. doi:10.1016/j.cej.2018.11.192
Luo, J., Sun, S., Chen, X., Lin, J., Ma, R., Zhang, R., et al. (2021). In-depth exploration of the energy utilization and pyrolysis mechanism of advanced continuous microwave pyrolysis. Appl. Energy 292, 116941. doi:10.1016/j.apenergy.2021.116941
Lv, X., Jiang, G., Xue, X., Wu, D., Sheng, T., Sun, C., et al. (2013). Fe-0-Fe3O4 nanocomposites embedded polyvinyl alcohol/sodium alginate beads for chromium (VI) removal. J. Hazard. Mat. 262, 748–758. doi:10.1016/j.jhazmat.2013.09.036
Maleki, A., Hayati, B., Naghizadeh, M., and Joo, S. W. (2015). Adsorption of hexavalent chromium by metal organic frameworks from aqueous solution. J. Industrial Eng. Chem. 28, 211–216. doi:10.1016/j.jiec.2015.02.016
Nair, V., and Vinu, R. (2016). Peroxide-assisted microwave activation of pyrolysis char for adsorption of dyes from wastewater. Bioresour. Technol. 216, 511–519. doi:10.1016/j.biortech.2016.05.070
Naushad, M., Ahamad, T., Alothman, Z. A., and Al-Muhtaseb, A. A. H. (2019). Green and eco-friendly nanocomposite for the removal of toxic Hg(II) metal ion from aqueous environment: adsorption kinetics & updates isotherm modelling. J. Mol. Liq. 279, 1–8. doi:10.1016/j.molliq.2019.01.090
Rojas, S. I., Duarte, D. C., Mosquera, S. D., Salcedo, F., Hinestroza, J. P., and Husserl, J. (2018). Enhanced biosorption of Cr(VI) using cotton fibers coated with chitosan - role of ester bonds. Water Sci. Technol. 78, 476–486. doi:10.2166/wst.2018.284
Sen Gupta, S., and Bhattacharyya, K. G. (2011). Kinetics of adsorption of metal ions on inorganic materials: a review. Adv. Colloid Interface Sci. 162, 39–58. doi:10.1016/j.cis.2010.12.004
Sharma, M., Singh, J., Hazra, S., and Basu, S. (2019). Adsorption of heavy metal ions by mesoporous ZnO and TiO2@ZnO monoliths: adsorption and kinetic studies. Microchem. J. 145, 105–112. doi:10.1016/j.microc.2018.10.026
Shi, Y., Shan, R., Lu, L., Yuan, H., Jiang, H., Zhang, Y., et al. (2020). High-efficiency removal of Cr(VI) by modified biochar derived from glue residue. J. Clean. Prod. 254, 119935. doi:10.1016/j.jclepro.2019.119935
Tang, J., Zhao, B., Lyu, H., and Li, D. (2021). Development of a novel pyrite/biochar composite (BM-FeS2@BC) by ball milling for aqueous Cr(VI) removal and its mechanisms. J. Hazard. Mat. 413, 125415. doi:10.1016/j.jhazmat.2021.125415
Wang, R., Jing, G., Zhou, X., and Lv, B. (2017). Removal of chromium(VI) from wastewater by Mg-aminoclay coated nanoscale zero-valent iron. J. Water Process Eng. 18, 134–143. doi:10.1016/j.jwpe.2017.05.013
Wang, X., Li, L., Yan, X., Meng, X., and Chen, Y. (2020). Processes of chromium (VI) migration and transformation in chromate production site: a case study from the middle of China. Chemosphere 257, 127282. doi:10.1016/j.chemosphere.2020.127282
Weber, W., and Morris, J. (1963). Kinetics of adsorption on carbon from solution. J. Sanit. Engrg. Div. 89 (17), 31–59. doi:10.1061/jsedai.0000430
Xu, J., Dai, Y., Shi, Y., Zhao, S., Tian, H., Zhu, K., et al. (2020). Mechanism of Cr(VI) reduction by humin: role of environmentally persistent free radicals and reactive oxygen species. Sci. Total Environ. 725, 138413. doi:10.1016/j.scitotenv.2020.138413
Yi, X., Sun, F., Han, Z., Han, F., He, J., Ou, M., et al. (2018). Graphene oxide encapsulated polyvinyl alcohol/sodium alginate hydrogel microspheres for Cu (II) and U (VI) removal. Ecotoxicol. Environ. Saf. 158, 309–318. doi:10.1016/j.ecoenv.2018.04.039
Zhang, H., Chen, C., Gray, E. M., and Boyd, S. E. (2017). Effect of feedstock and pyrolysis temperature on properties of biochar governing end use efficacy. Biomass Bioenergy 105, 136–146. doi:10.1016/j.biombioe.2017.06.024
Zhang, X., Lv, L., Qin, Y., Xu, M., Jia, X., and Chen, Z. (2018). Removal of aqueous Cr(VI) by a magnetic biochar derived from Melia azedarach wood. Bioresour. Technol. 256, 1–10. doi:10.1016/j.biortech.2018.01.145
Zhao, C., Hu, L., Zhang, C., Wang, S., Wang, X., and Huo, Z. (2021). Preparation of biochar-interpenetrated iron-alginate hydrogel as a pH-independent sorbent for removal of Cr(VI) and Pb(II). Environ. Pollut. 287, 117303. doi:10.1016/j.envpol.2021.117303
Zhao, L., Pu, S., Yang, J., Yu, J., and Wang, Y. (2015). The Cr(VI) pollution characteristics of groundwater and soil in the surroundings of a chromium slag site. Environ. Eng. 33, 117–121. doi:10.13205/j.hjgc.201502026
Zhao, M., Zhang, C., Yang, X., Liu, L., Wang, X., Yin, W., et al. (2020). Preparation of highly-conductive pyrogenic carbon-supported zero-valent iron for enhanced Cr(VI) reduction. J. Hazard. Mat. 396, 122712. doi:10.1016/j.jhazmat.2020.122712
Zhao, X., Wang, W., Liu, H., Ma, C., and Song, Z. (2014). Microwave pyrolysis of wheat straw: product distribution and generation mechanism. Bioresour. Technol. 158, 278–285. doi:10.1016/j.biortech.2014.01.094
Zheng, Y.-M., Liu, T., Jiang, J., Yang, L., Fan, Y., Wee, A. T. S., et al. (2011). Characterization of hexavalent chromium interaction with Sargassum by X-ray absorption fine structure spectroscopy, X-ray photoelectron spectroscopy, and quantum chemistry calculation. J. Colloid Interface Sci. 356, 741–748. doi:10.1016/j.jcis.2010.12.070
Zhou, H., Ye, M., Zhao, Y., Baig, S. A., Huang, N., and Ma, M. (2022). Sodium citrate and biochar synergistic improvement of nanoscale zero-valent iron composite for the removal of chromium (VI) in aqueous solutions. J. Environ. Sci. 115, 227–239. doi:10.1016/j.jes.2021.05.044
Keywords: biochar, microwave pyrolysis, Cr(VI) removal, sodium alginate (SA), adsorption mechanism
Citation: Wang H, Zhao X, Yang X, Sun S, Wang W, Mao Y and Song Z (2022) Biochar-embedding iron-alginate microspheres derived from bagasse by one-step microwave pyrolysis/activation for enhanced Cr(VI) removal. Front. Energy Res. 10:999724. doi: 10.3389/fenrg.2022.999724
Received: 21 July 2022; Accepted: 08 August 2022;
Published: 31 August 2022.
Edited by:
Hui Shang, China University of Petroleum, Beijing, ChinaReviewed by:
Longzhi Li, Shandong University of Science and Technology, ChinaHuacheng Zhu, Sichuan University, China
Copyright © 2022 Wang, Zhao, Yang, Sun, Wang, Mao and Song. This is an open-access article distributed under the terms of the Creative Commons Attribution License (CC BY). The use, distribution or reproduction in other forums is permitted, provided the original author(s) and the copyright owner(s) are credited and that the original publication in this journal is cited, in accordance with accepted academic practice. No use, distribution or reproduction is permitted which does not comply with these terms.
*Correspondence: Xiqiang Zhao, zxq@sdu.edu.cn
 Hongfei Wang
