 Yunfeng Lu
 Quanhu Zhang
- Xi’an Research Institute of High Technology, Xi’an, China
In this paper, an optimized boron-coated straw tube neutron multiplicity counter is used to simulate neutron multiplicity for six different shapes of weapons-grade plutonium samples. It was found that under the point model equation, the mass simulation results for samples of different shapes showed different degrees of negative deviations with increasing mass, and the deviations increased with increasing mass. On this basis, the reasons for the deviation are analyzed and a multilayer perceptron is introduced, and three counting rates and preset qualities of samples of different qualities under six shapes are trained. The results showed that the multi-layer perceptron could better fit the relationship between the counting rates of different shapes and the preset quality. The sparrow search algorithm was introduced to optimize the initial weights and thresholds of the multilayer perceptron, and the optimized model was used to predict another four samples of different shapes. The results show that the optimized multilayer perceptron can better fit the relationship between the counting rate and the mass of samples with different shapes. When the sample mass is less than 3 kg, the relative deviation of the three counting rates for samples with four shapes to the sample mass prediction is less than 2%, which meets the requirements of neutron multiplicity measurement.
Introduction
The rapid development of the nuclear security field has more demand for neutron multiplicity counters, but the international production of 3He gas is decreasing, and new alternative products are emerging, among which the boron-coated straw tube is a new type of neutron detector to replace 3He, which has its unique advantages over 3He gas (Lacy et al., 2009). Some experimental studies on neutron multiplicity measurement using boron coated straw tubes have been carried out internationally. The results show that the performance of neutron multiplicity counting can approach or even exceed 3He (Lacy et al., 2014; McElroy, 2015).
Analytical equations for neutron multiplicity measurements based on the point model were originally proposed by Bohnel, where the most important assumption is that all neutrons are emitted from a single point with the same energy and probability of induced fission (Böhnel, 1985), such an assumption simplifies the derivation of the equations, but for plutonium metal samples and large mass, high-density plutonium oxide samples, the assumptions on the neutron multiplication of the samples are significantly different from reality and can lead to significant mass analysis bias (Krick et al., 2005a). Because of this, different correction methods have been proposed by numerous scholars. Geist obtained correction factors for a generalized weighted point model for cylindrical samples by simulating and studying plutonium oxide samples with different mass, density, and high diameter ratios using the polynomial fitting, and compared them experimentally with the point model (Geist et al., 2004a). Geist and Krick simulated plutonium metal cylinders with different height/diameter ratios and masses, respectively, and performed multiple counting analyses to obtain correction factors and empirically determined calibration curves for neutron multiplication using the correction factors for geometrically similar plutonium metal samples (Geist et al., 2004b; Krick et al., 2005b). Krick also pointed out that the generalized calibration curves with weighting factors are valid for cylindrical geometry, but the bias correction will not be fully effective for different geometry (Krick et al., 2005b). The corresponding general correction equation obtained by Quanhu Zhang et al. by the polynomial fitting of several different shapes of cylindrical sample parameters reduces the measurement error to some extent (Zhang et al., 2020) but sacrifices a certain accuracy to achieve the generalized correction of the equation for different shaped samples. Xiaobo Liu et al. introduced a two-parameter iterative method for multiplicative correction based on the weighted point model. The method was validated by simulation experiments and experimentally verified for real metal plutonium parts. Using a pre-obtained set of correction factors, the method can greatly improve the bias in analyzing plutonium metal parts with geometry such as spherical, hemispherical, and spheres of unknown radius and thickness (Liu and Chen, 2021). Kaile Li et al. introduced a neural network to implement a method for rapid prediction of sample quality by three parameters and effectively reduce the error by a genetic algorithm (Li et al., 2021a).
In general, the proposed correction method improves the measurement accuracy of plutonium samples to a certain extent, but the calculation process becomes more complicated, and different correction methods are limited by the geometric shape. In the actual measurement, the shape of the sample is often unknown, so it is difficult to use an accurate correction model. In this paper, the trends of single, double, and triple counting rates of spherical, two different spherical shell shapes, and three different cylindrical shape samples at 100 g-3 kg were simulated and studied. A multilayer perceptron is introduced, and the three counts of six samples and the preset mass (the mass of plutonium material simulating spontaneous fission) are used for training. The sparrow search algorithm is introduced to find the initial weight and threshold to improve the prediction accuracy. Finally, the quality information of the other four shape samples is predicted on the trained model.
Principle and method
Simulation of neutron multiplicity measurements
The analytical method for neutron multiplicity measurement of plutonium samples processes the neutron time information obtained from the detector through the multiplicity shift register to obtain the neutron multiplicity distribution of the sample and then calculates the singles, doubles, and triples count rates of the detector for the sample (Langner et al., 1998), and then solves for the mass according to the neutron multiplicity equation (Hage and Cifarelli, 1992), with the main equations as 1–3.
where: vin and vsn denote the first, second, and third-order moments of spontaneous/induced fission, the plutonium isotope in the plutonium sample is usually equivalent to 240Pu for calculation (Langner et al., 1998). In this paper, the first, second and third moments of spontaneous fission and the first, second and third moments of induced fission are 2.15, 3.79, 5.21, 3.13, 8.13, and 16.89, respectively. ε, F0, m, M, α are detection efficiency, spontaneous fission rate, sample mass, neutron multiplication, and (α, n) emission rate, respectively. fd and fT are double and triple coincidence gate factors respectively and are calculated as:
Where τ is the decay time of the detector, G and P are the coincidence gate width and pre-delay in the multiplicity shift registers respectively, the pre-delay is usually taken as 0 in the simulation, and the coincidence gate width is taken as 64 μs in this paper. The detection efficiency and recession time are calibrated in advance. The above equations combined with the three counting rates can calculate the equivalent mass of 240Pu in the sample, and then the sample isotopic abundance is measured according to the γ detector to achieve the measurement of the sample mass.
Simulation studies of neutron multiplicity
The boron-coated straw tube structure used in this paper is referenced from the literature (Klausz et al., 2019), a cluster-type straw tube consists of 7 base tubes as shown in Figure 1, each base tube is coated with 1 μM thick 90% 10B abundance B4C on the inner wall, and the tube length is 50 cm. The detector system is referenced from AWCC (Canberra, 2005) for the rest of the dimensional structure except for the detector tube. 200 cluster-type straw tubes are used to arrange inside it, and the arrangement is optimized as shown in Figure 2. 3 mm spherical 252Cf source was calibrated to obtain detector detection efficiency and recession time of 28% and 64 μs, respectively.
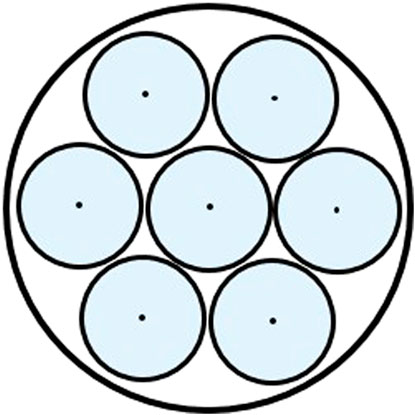
FIGURE 1. Schematic diagram of the structure of cluster-type straw.
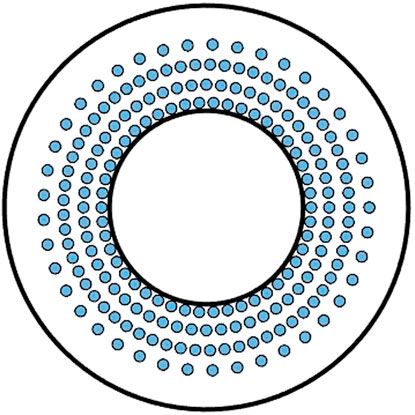
FIGURE 2. Optimized straw tube detector layout.
Simulated of different shape samples were performed using this detection system. The simulated sample material composition is US DOE 3013 WGPu (McConn et al., 2011), Its composition is 0.05%238Pu,93.5%239Pu,6%240Pu,0.4%241Pu,0.05%242Pu. The simulated 10 sample shape parameters are shown in Table 1, shape samples 1-6 are used to analyze the measurement bias and train the multilayer perceptron, and samples 7–10 are used for conclusion testing.
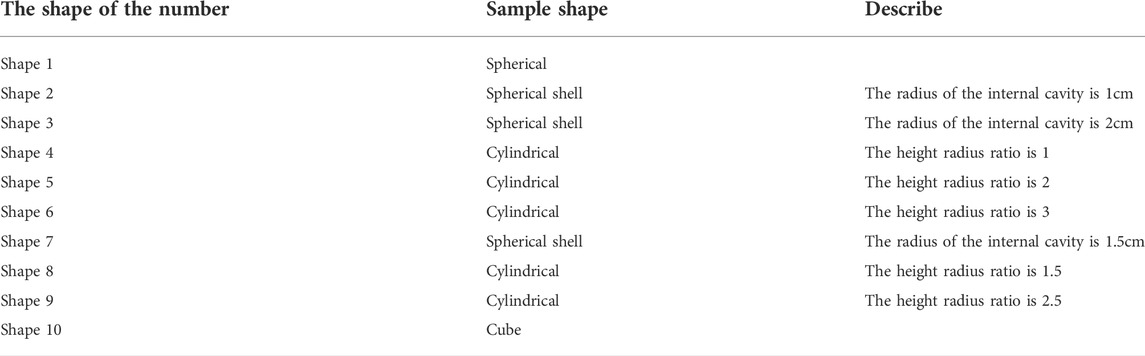
TABLE 1. Sample parameters of shape 1–10.
The simulation process is divided into two parts. The first part is to simulate the neutron time information of the sample detected by the detector, and then process this information. The simulation detector detects plutonium samples using MCNP program, the density of plutonium sample is 19.84g/cm3, the simulation 10B neutron capture using F8: N combined with FT8 CAP 5010 card, neutron capture counting PTRAC card, neutron source using built-in SF card, record the time of each neutron disappearance. After establishing the model and setting the sample information, the neutron capture time information can be obtained by running. The processing of the operation data is carried out by MATLAB, and the neutron time information detected by the detector is obtained by further processing of all the emitted spontaneous fission and induced fission neutrons. It is worth noting that in the process of MATLAB, due to the influence of random numbers in the computer, the neutron time information obtained each time is different, which is also different in the actual measurement, but when the amount of data is large enough, these effects can be reduced to an acceptable range. Refer to (Langner et al., 1998) for subsequent processing.
The detector structure shown in Figure 2 was built in Monte Carlo software, and simulations were performed for each 100 g mass of shape samples 1-6 at 100 g-3 kg mass, and 10 different masses were selected for each of samples 7–10 at 100 g-3 kg. In neutron multiplicity measurements, the effect of statistical rise and fall is usually reduced by increasing the measurement time. In this paper, the simulation time is set to 200 s, and the spontaneous fission of the sample is simulated in a Monte Carlo program to obtain the neutron capture time detected by the detector. The neutron multiplicity equation is substituted into the singles, doubles, and triples counting rates to obtain the mass, neutron multiplication, and (α, n) emission rate of the sample.
Analysis of results and improvement
Point model equation results analysis
The average Singles, Doubles, and Triples of different shaped samples with different masses simulated 20 times respectively are plotted in Figure 3.
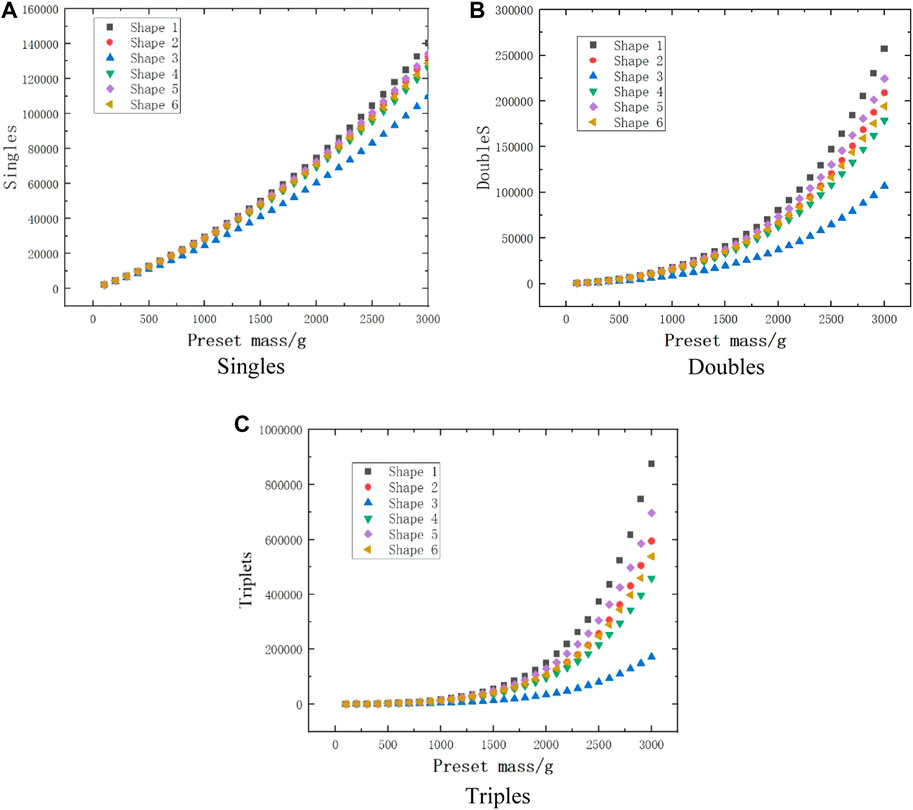
FIGURE 3. Variation of three count rates with mass for different shapes. (A) Singles. (B) Doubles. (C) Triples.
Based on the three count rates of the six shaped samples at different masses in Figure 3, it appears that the shape has the least effect on the singles count rate and a greater effect on the doubles and triples count rates, especially at large masses. The three count rates simulated for samples of shapes 1-6 at different masses were calculated by the neutron multiplicity equation of the point model to obtain the sample mass information. In order to observe the effect of statistical rise and fall on the calculated masses, the simulated were repeated 20 times for the same mass sample and the calculated results were plotted as in Figure 4 and the relative deviation of their simulated masses from the preset masses was plotted as in Figure 5.
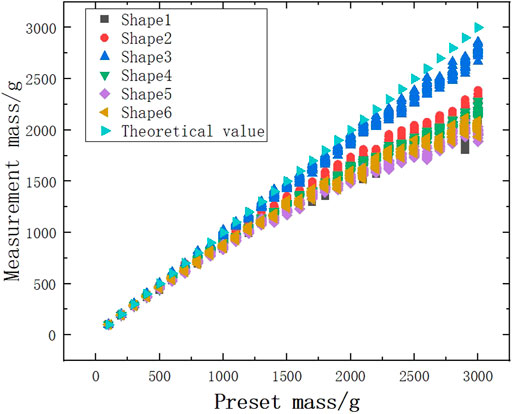
FIGURE 4. Simulated mass of different shaped samples.
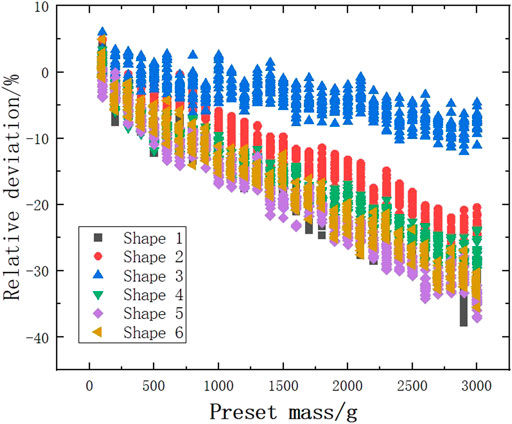
FIGURE 5. Mass simulated deviation of different shaped samples.
As can be seen from Figure 4, 5, the deviations simulated for different shapes of samples at the same mass are different. It was found long ago that such deviations originate from the variable neutron multiplication, which corresponds to different neutron multiplicities for different shapes at the same mass. The relative deviation of the calculated neutron multiplication from the actual neutron multiplication for the six shapes of the samples is plotted in Figure 6.
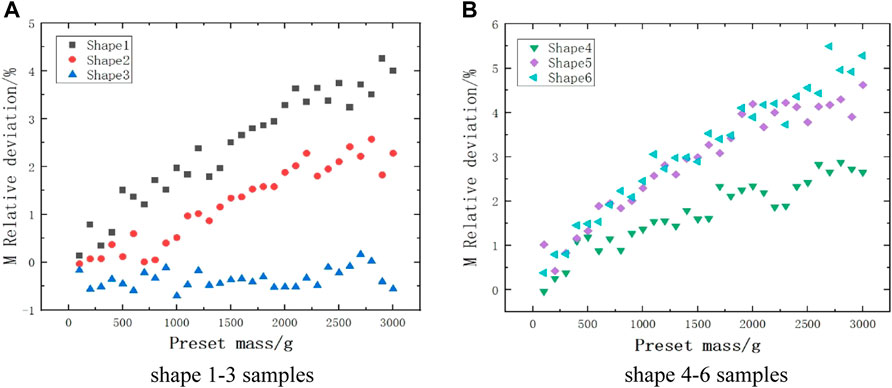
FIGURE 6. Relative error of neutron multiplication with mass for different shapes. (A) Shape 1-3 samples. (B) Shape 4-6 samples.
As can be seen from Figure 6: Shapes 1, 2, 4, 5, and 6 samples have similar multiplicity trends in error variation, and the calculated neutron multiplication is higher than the actual value, which also leads to similar trends in the calculated mass values for these shapes of samples. The trend of estimated deviation change for shape 3 is slower compared to the other ones, and the estimation error is the smallest, which directly leads to the existence of a smaller deviation in its simulated mass. The relative error between the calculated and actual values of neutron multiplication for the different shape samples has an overall increasing trend, leading to an increasing deviation of the calculated m-value with increasing preset mass.
Multi-layer perceptron
Since its error comes from the simplification assumed in the point model, we hope to get more accurate m values based on single, double, and triple count rates. Here, we introduce the multilayer perceptron model, whose structure is shown in Figure 7. The number of nodes in the hidden layer is chosen to be 7 according to the empirical formula, the input is the singles, doubles and triples count rates, the output is the preset quality, and the training times, learning rate and target error are set to 2000, 0.01 and 0.001, respectively. The gradient descent method is used to find the corresponding weight threshold to make the model continuously fit the training data.
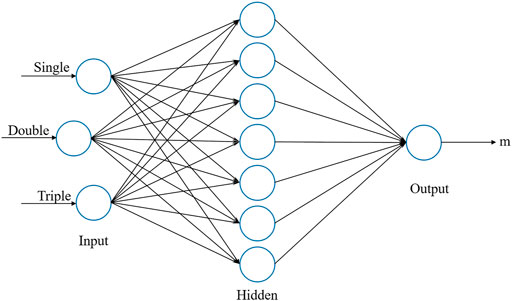
FIGURE 7. Multi-layer perceptron model.
Samples of shapes 1-6 are increased by 100 g each time on the basis of 100 g, up to 3 kg, and the same shape mass sample is repeatedly simulated 20 times without distinguishing sample shapes anymore, and the singles, doubles, and triples count rates of the simulation results and the corresponding preset masses are used as training data for the multilayer perceptron to obtain the trained model. Shape samples No. 7–10 are within 100 g-3 kg, Three counting rates of each shape-quality sample are repeatedly simulated 20 times as test data. The trained model is used to predict the corresponding mass of the three counting rates of the training data and the test data, and the relative deviation is calculated, which is plotted as shown in Figure 8.
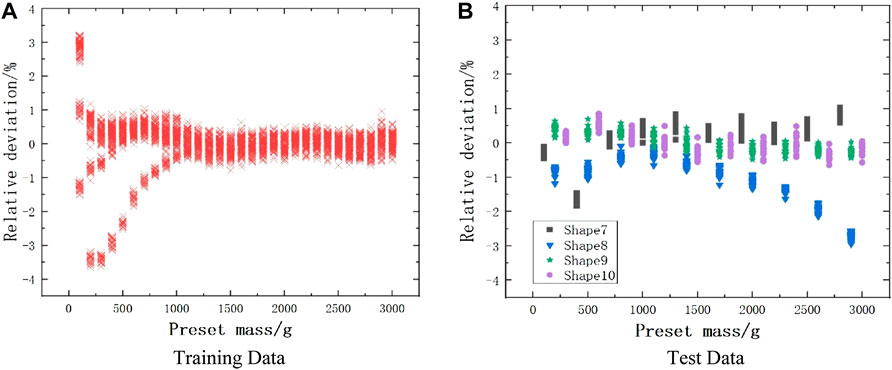
FIGURE 8. Multi-layer perceptron predicts quality deviations. (A) Training Data. (B) Test Data.
As seen in Figure 8A: the introduction of the multilayer perceptron model can better fit the relationship between the three count rates and the masses of the shape samples 1-6 at 100 g-3 kg. As seen in Figure 8B: the trained model predicts the mass of approximate shapes and the accuracy can reach 3% within 100 g-3 kg, which is a very effective improvement compared to the point model calculation results, and the simulation results seem to show that the effect brought by different shapes on the mass can be neglected. However, for shape 8, a further increase in sample mass may lead to an increase in error.
Sparrow search algorithm optimization
Although the deviation of the predicted masses from the actual values by the multilayer perceptron model reaches a low level, it can satisfy the application of neutron multiplicity to the metallic plutonium mass properties. However, it is worth noting that the initial weights and thresholds are usually randomly generated when training the multilayer perceptron, leading to incomplete consistency in the results of each training, which is due to the gradient descent method, which is not always able to find the global optimal solution. To solve this problem, the sparrow search algorithm is introduced to randomly generate the initial population of sparrows as the weights and thresholds of the multilayer perceptron, and the optimal initial values are continuously searched for using the iterative method (Li et al., 2021b). The training process takes the mean square error of the prediction quality as the fitness value, the maximum number of iterations is set to 100, and the fitness value of the search process of the sparrow search algorithm changes as shown in Figure 9. The mean square error in Figure 8A are 1871.6 and 469.93, respectively.
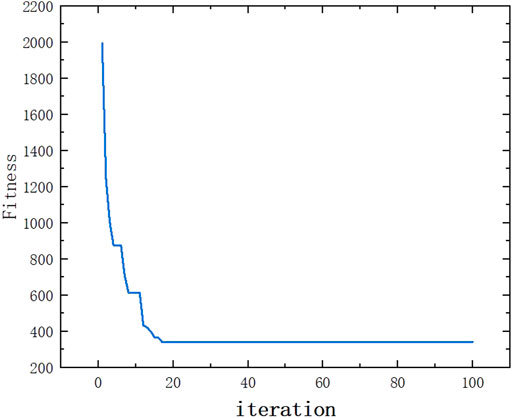
FIGURE 9. Sparrow search algorithm adaptation value change.
As seen in Figure 9: the sparrow search algorithm can effectively reduce the mean square error of the training data and make the fit of the three count rates and masses in the training data more compatible. Using the optimal population value in the optimization process as the initial value of the multilayer perceptron, the training data in Figure 8 is trained again, and the results are kept consistent each time. The trained model was used to predict the training data and test data separately, and the prediction deviations were plotted as in Figure 10.
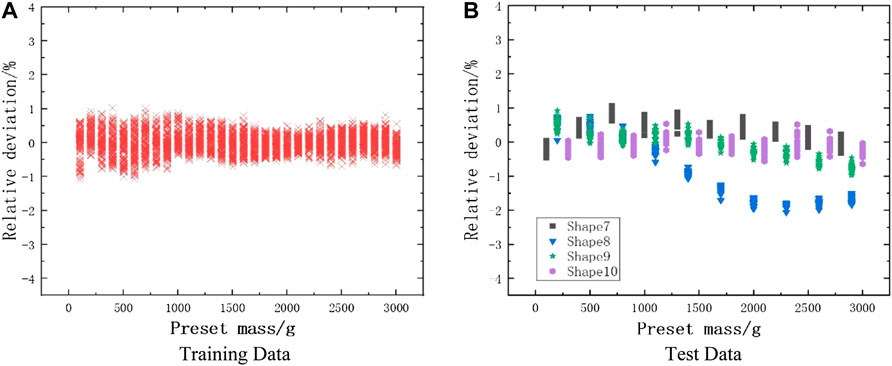
FIGURE 10. Predicting quality deviation after optimizing multi-layer perceptron. (A) Training Data. (B) Test Data.
As seen in Figure 10: Optimizing the multilayer perceptron model using the sparrow search algorithm can effectively reduce the fitting error and predict the sample quality more accurately by the values of the three count rates. The mean squared errors in Figures 10A,B are 341.42 and 418.89, respectively. The results show that the trained multilayer perceptron model can fit the three count rates versus mass for samples of shapes 1-6 at different masses with an accuracy of more than 1%. It can predict the sample mass using three count rates for samples of shapes 7–10 within 100 g-3 kg with an accuracy of more than 2%. The results have a good ability to apply neutron multiplicity properties.
Conclusion
To address the problem of large negative deviations in the measured sample masses with increasing masses when measuring metallic plutonium materials by the neutron multiplicity method in nuclear arms control verification, the introduction of a sparrow search algorithm to optimize the model of the multilayer perceptron could be a better solution. The multiplicity distributions of six shaped samples at 100 g-3 kg mass were simulated, and the corresponding singles, doubles, and triples count rates were calculated. The three counting rates of the six shape samples are trained with the corresponding preset quality information of the multilayer perceptron, and the three counting rates and qualities of the other four samples with little difference in shape are tested with the trained model. The results show that the multi-layer perceptron model optimized by the sparrow search algorithm can well fit the relationship between count rate and mass for six different shaped samples, and the sample mass can still be well predicted by the three count rates with a prediction error of no more than 2% when the shapes do not differ much, which has some research value in neutron multiplicity measurement. In addition, the generalization ability of the multilayer perceptron to sample shapes can be improved by increasing the variety of shape samples in the training data. Since the multilayer perceptron model needs to normalize the data, the three count rates and masses of the predicted samples cannot exceed the maximum and minimum values in the training data, which has some limitations and can be solved by increasing the quality range of the training data in practical applications.
Data availability statement
The original contributions presented in the study are included in the article/supplementary materials, further inquiries can be directed to the corresponding author.
Author contributions
YL and YW performed the analysis. YL validated the analysis and drafted the manuscript. QZ reviewed the manuscript. QY and YL designed the research. All authors have read and approved the content of the manuscript.
Conflict of interest
The authors declare that the research was conducted in the absence of any commercial or financial relationships that could be construed as a potential conflict of interest.
Publisher’s note
All claims expressed in this article are solely those of the authors and do not necessarily represent those of their affiliated organizations, or those of the publisher, the editors and the reviewers. Any product that may be evaluated in this article, or claim that may be made by its manufacturer, is not guaranteed or endorsed by the publisher.
References
Böhnel, K. (1985). The effect of multiplication on the quantitative determination of spontaneously fissioning isotopes by neutron correlation analysis. Nucl. Sci. Eng. 90 (1), 75–82. doi:10.13182/nse85-2
Geist, W .H., Krick, M .S., and Mayo, D .R. (2004). “Reduction of bias in neutron multiplicity assay using a weighted point model,” in Proc. Of the annual meeting of the INMM.
Geist, W .H., Mayo, D .R., and Krick, M .S. (2004). “Achieving accurate neutron-multiplicity analysis of metals and oxides with weighted point model equations,” in Proc. Of the annual meeting of the INMM.
Hage, W., and Cifarelli, D. M. (1992). Correlation analysis with neutron count distribution for a paralyzing dead-time counter for the assay of spontaneous fissioning material. Nucl. Sci. Eng. 112, 136–158. doi:10.13182/nse92-a28410
Klausz, M., Kanaki, K., Zagyvai, P., and Hall-Wilton, R. J. (2019). Performance evaluation of the boron coated straws detector with Geant4. Nucl. Instrum. Methods Phys. Res. Sect. A: Accel. Spectrom. Detect. Assoc. Equip. 943, 162463. doi:10.1016/j.nima.2019.162463
Krick, M .S., Geist, W .H., and Mayo, D .R. (2005). A weighted point model for the thermal neutron multiplicity assay of high-mass plutonium samples, 14157. LA-.
Krick, M. S., Geist, W. H., and Mayo, D. R. (2005). A weighted point model for the thermal neutron multiplicity assay of high-mass plutonium samples (No. LA--14157). Office of Scientific and Technical Information.
Lacy, J. L., Athanasiades, A., Sun, L., Martin, C. S., and Vazquez-Flores, G. J. (2014). “A straw based HLNCC multiplicity counter with improved FOM in same form factor,” in INMM annual meeting proc.
Lacy, J. L., Athanasiades, A., Sun, L., Martin, C. S., and Vazquez-Flores, G. J. (2009). “Boron coated straw detectors as a replacement for 3 He,” in 2009 IEEE nuclear science symposium conference record (NSS/MIC) (IEEE), 119–125.
Langner, D. G., Stewart, J. E., Pickrell, M. M., Krick, M. S., Ensslin, N., and Harker, W. C. (1998). Application guide to neutron multiplicity counting (No. LA-13422-M). Los Alamos, NM: Los Alamos National Laboratory.
Li, .G, Hu, .T, and Bai, .D (2021). BP neural network improved by sparrow search algorithm in predicting debonding strain of FRP-strengthened RC beams. Adv. Civ. Eng., 1–13. doi:10.1155/2021/9979028
Li, K., Li, S., Zhang, Q., Cai, X., and Yang, J. (2021). Studies on fast neutron multiplicity measurement based on neural network. AIP Adv. 11 (5), 055309. doi:10.1063/5.0045381
Liu, X., and Chen, L. (2021). A two parameter iterative approach of multiplication correction for assaying plutonium metal parts with neutron multiplicity counting. Nucl. Instrum. Methods Phys. Res. Sect. A: Accel. Spectrom. Detect. Assoc. Equip. 1016, 165779. doi:10.1016/j.nima.2021.165779
McConn, R. J., Gesh, C. J., Pagh, R. T., Rucker, R. A., and Williams, R. (2011). Compendium of material composition data for radiation transport modeling (No. PNNL-15870 Rev. 1). Pacific Northwest National Lab.(PNNL). Richland, WA (United States).
Keywords: boron-coated straw tube, neutron multiplicity, plutonium sample mass property measurement, multilayer perceptron, sparrow search algorithm
Citation: Lu Y, Zhang Q, Yao Q and Wang Y (2022) Simulation study of neutron multiplicity of plutonium samples of different shapes. Front. Energy Res. 10:996063. doi: 10.3389/fenrg.2022.996063
Received: 17 July 2022; Accepted: 12 August 2022;
Published: 01 September 2022.
Edited by:
Elsayed Salama, The British University in Egypt, EgyptReviewed by:
Elsayed Elmaghraby, Egyptian Atomic Energy Authority, EgyptA. Abdelghafar Galahom, Higher Technological Institute, Egypt
Copyright © 2022 Lu, Zhang, Yao and Wang. This is an open-access article distributed under the terms of the Creative Commons Attribution License (CC BY). The use, distribution or reproduction in other forums is permitted, provided the original author(s) and the copyright owner(s) are credited and that the original publication in this journal is cited, in accordance with accepted academic practice. No use, distribution or reproduction is permitted which does not comply with these terms.
*Correspondence: Quanhu Zhang, emhhbmdxaF8xMDJAc2luYS5jb20=