 Shuiqing Zhou
 Tianle Zhang
 Zijian Mao1,2
94% of researchers rate our articles as excellent or good
Learn more about the work of our research integrity team to safeguard the quality of each article we publish.
Find out more
ORIGINAL RESEARCH article
Front. Energy Res. , 09 January 2023
Sec. Process and Energy Systems Engineering
Volume 10 - 2022 | https://doi.org/10.3389/fenrg.2022.994654
Large axial fans are widely used in industrial refrigeration, building ventilation, and other scenarios because they have inlet guide vanes (IGVs) and outlet guide vanes (OGVs) to make their operation economical and efficient. However, unreasonable guide vane structure is prone to flow separation, forming a tail vortex and interfering with other blades, thereby resulting in the deterioration of working conditions and large noise. Taking a large axial fan with both IGVs and OGVs as the research object, this paper analyzed the structural variables of the fan by global sensitivity analysis method and determine the target of settings optimization as IGV according to the analysis results and the internal flow characteristics of the fan. Furthermore, IGV was parametrically designed, and Kriging model was established and optimized by the second non-dominated sorting genetic algorithm (NSGA-II). Eventually, total pressure and sound pressure level (SPL) were used as targets for multi-objective optimization. The results indicated that the noise produced by the optimized fan was reduced by 6.4 dB and total pressure was increased by 156.4 Pa, with an increase of 0.86% in the total pressure efficiency at the rated working condition, which proved the reliability of the proposed method. This paper also provides a valuable reference for the optimization of similar fluid equipment.
Blades are the core components of large axial fans, which are crucial to the aerodynamic noise and performance characteristics as well as the safe and stable operation of the fans (Zhao et al., 2020; Gu et al., 2021). A large nuclear-grade axial fan with a diameter of 1250 mm was used as the research object of this study. It is generally used in the ventilation system of nuclear power plants, working at medium pressure, with Mach <0.3 and Reynolds >4000. At this time, potential dangers in the internal flow field of the blade is likely to obstruct fluid flow, affect the efficiency of the fan and even damage motor, which will endanger stable operation and lead to equipment damages or power plant shutdown, and thus huge economic losses and adverse social impact (Zhang et al., 2018; Fakhraei et al., 2021). Therefore, it is of great urgency to optimize the fan.
Since the fans under study are used in ventilation systems, huge noise generated during operation would have an impact on the health of nearby personnel (Zhang C. et al., 2021), so optimization objective is to simultaneously increase pressure and reduce noise, which is quite difficult to achieve (Hu and Lu, 2017; Kromer et al., 2019). And it cannot be achieved by increasing the size of the fan because of its large size and complex structure, nor can it be achieved by the traditional methods. In addition, with the implementation of China’s carbon neutrality and carbon peaking policies, the energy efficiency ratio of the equipment is becoming increasingly important (Tanasic et al., 2011; Huang et al., 2020). In this context, it is vital to find a way to simultaneously increase pressure and reduce noise without increasing fan size and power consumption. One of the most important methods is to optimize the structure of the fan.
The structural optimization of axial flow fans has been studied by many outstanding scholars. KIM et al. (Kim et al., 2014) used a weighted average proxy model to optimize the design with a single objective for five design variables and performed multi-objective optimization on this basis to improve efficiency while reducing SPL. CANEPA E et al. (Canepa et al., 2016) investigated the tip leakage noise generated by a shrouded rotor of an axial fan and calculated the acoustic response function of the tested configuration using the spectral decomposition method. The findings showed that upstream geometry had a more significant effect on radiated noise than on performance and that a sharp decline in tip-gap failed to entirely eliminate relevant noise. ZHANG (Zhang S. G. et al., 2021) used a single-stage axial fan based on the radial basis function (RBF) enhanced differential evolutionary (RADE) algorithm to conduct dual-objective optimization with power consumption and static pressure efficiency as the design objectives. The results suggested an increase of 6% in the static pressure efficiency of the axial fan and a decrease of 7 dB in the first blade pass frequency (BPF) noise after optimization.
Nowadays, approximate models are mostly used for the optimization of fan structures to reduce computational effort and improve efficiency. CHOI et al. (Choi et al., 2019) applied the response surface method (RSM) based on central composite design for single objective optimization to enhance the aerodynamic performance at a specified total pressure, and the optimization results showed an increase in the total pressure and efficiency of 5.2% and 2.0% respectively. Using gradient enhanced response surface model (GERSM), TANG et al. (Tang et al., 2017) optimized the aerodynamic shape of a transonic fan and gave the geometric characteristics and relevant details of the optimal design. NISHI et al. (Nishi et al., 2022) applied a one-dimensional design approach to a very small axial fan by combining experimental design, response surface method (RSM) and optimization method and eventually succeeded in improving the efficiency of the fan by about 9.1% through numerical analysis and experiments.
Despite various approximate models have been used for the structural optimization of fans, most of the studies have clear objectives, and the studied structures are single-stage blades with fewer influencing factors (Venturelli and Benini, 2016; Chai et al., 2020; Taghinezhad et al., 2021). In addition, sensitivity analysis is rarely performed. Therefore, based on a preliminary investigation (Zhou et al., 2022), this paper optimized the complex structures of large axial fans and analyzed the responsivity of multiple influencing factors to pressure and noise by using global sensitivity analysis method and combining the research results and the internal flow characteristics of the fans to determine the structure after verifying the feasibility of numerical simulations. On this basis, Kriging model with relevant optimization variables and target response was established and optimized by NSGA-II with pressure and noise as the target. Finally, the optimization results were verified by air performance and noise tests. The above method is also applicable to the optimal design of other fans with complex structures such as multi-stage blades and similar machinery, which have certain reference and application value.
A large axial fan mainly consists of a fairing, IGVs, moving vanes, OGVs, and a motor, as shown in Figure 2.
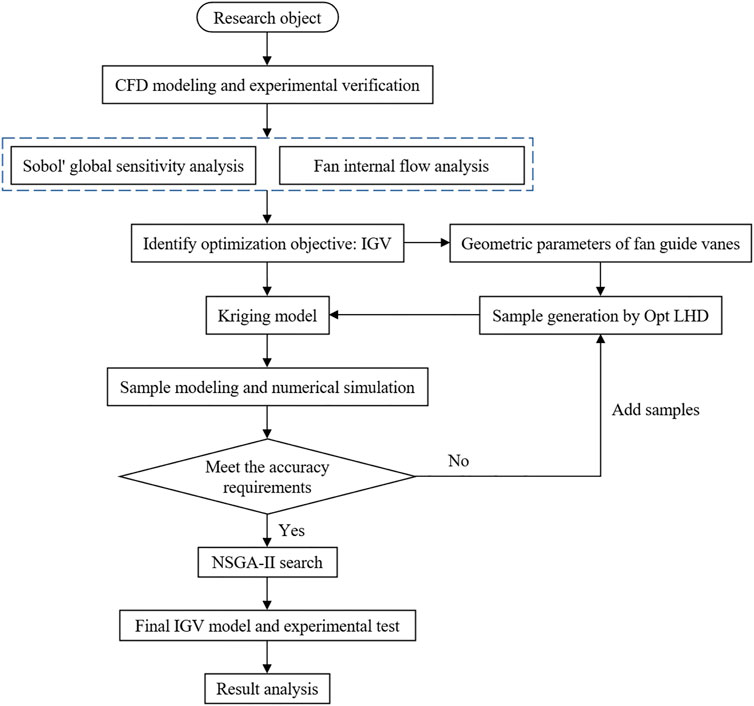
FIGURE 1. Optimization flow chart.
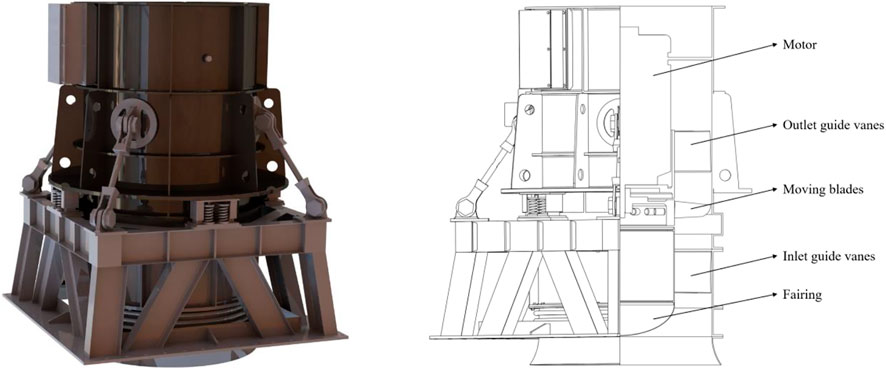
FIGURE 2. Axial fan structure diagram.
Structural parameters are shown in Table 1.

TABLE 1. Structural parameters of axial flow fan.
To facilitate the calculation of the internal component area and grid division of the fan, the geometric model of the fan was divided into five components, namely inlet, IGV, rotation, OGV, and outlet, whose simplified diagram is shown in Figure 3.
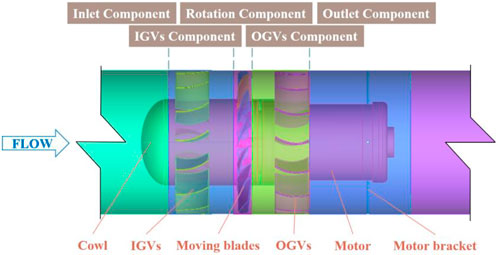
FIGURE 3. Division of axial fans.
Figure 4 shows grid delineation. The important parts (moving vanes, IGVs, OGVs) were structurally meshed to improve the mesh quality. The meshes of IGV, rotation and OGV grids are respectively displayed in Figures 4B–D. The complete fan grid is shown in Figure 4A. In this case, the first node was placed in the region of the viscous substratum with y+ ≤ 5. The Y+ empirical formula is expressed as Eq. 1 (Moaveni, 1999):
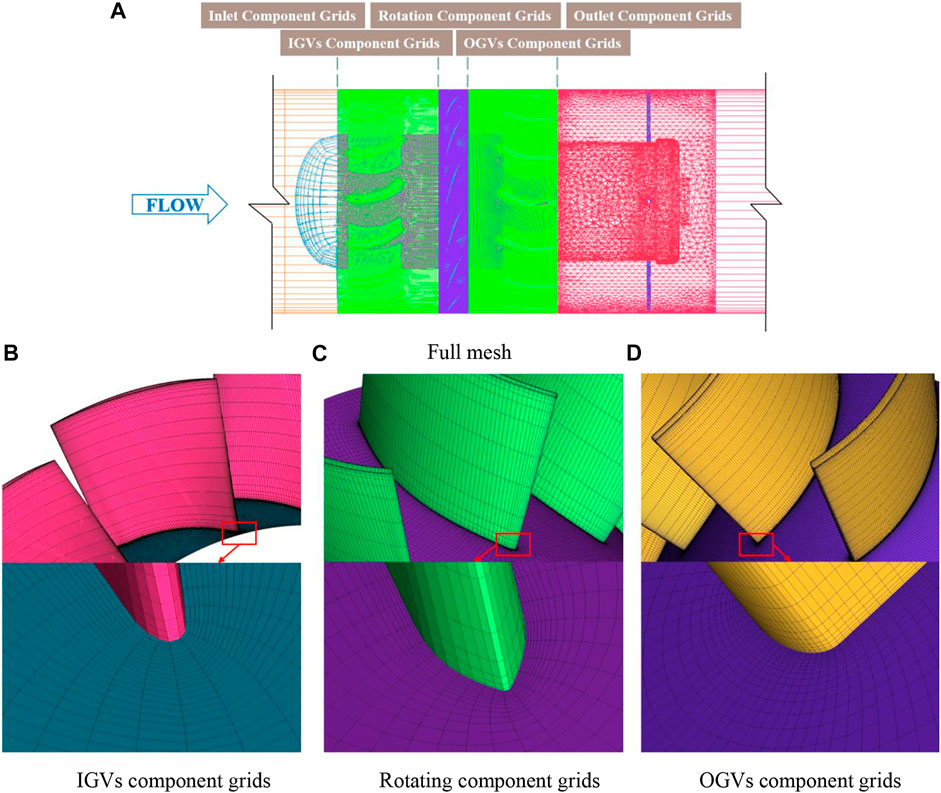
FIGURE 4. Computational grid (A) Full mesh (B) IGVs component grids (C) Rotating component grids (D) OGVs component grids.
Grid independence was verified after grid division, as demonstrated in Figure 5. When there were a total number of about 8 × 10⁶ grids, the total pressure of the fan obtained from numerical simulation remained unchanged, while its total pressure efficiency fluctuated by less than 1%, then the calculation results were believed to be independent of the number of grid. At this time, there were 8,267,684 grids in the whole fan component in total.
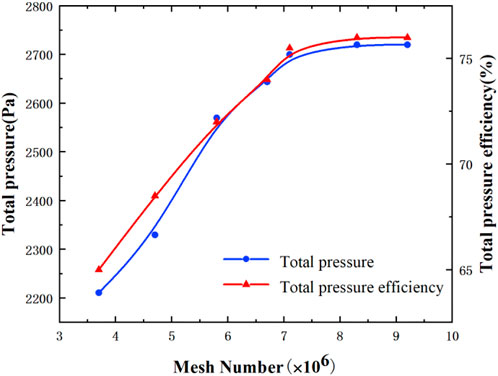
FIGURE 5. Grid independence verification.
To verify the accuracy of the computational model, the aerodynamic performance and noise of the fan was numerically and experimentally simulated. Then the simulation and experimental results were compared and analyzed. The pressure of the fan was simulated on the computational model. The steady-state calculation was conducted using the multi-reference system model (MRF). To solve the implicit pressure-based solution, the standard k-ε turbulence model was used to solve the three-dimensional Reynolds-averaged N-S equation, the working fluid was 25°C air, and the inlet and outlet boundary conditions were set to Mass-flow-inlet and Pressure-outlet. The SIMPLE algorithm was employed couple pressure and velocity, with each exponential parameter of aerodynamic performance being set to second-order headwind. However, Under-Relaxation factors were set by default. The calculation converged when the residual value was less than 1 × 10⁻⁵.
According to the requirements of “GB/T 1236–2017 duct industrial ventilator standardized duct performance test” (General Administration of Quality Supervision, 2017) for fan aerodynamic test, a C-type air chamber was adopted. The schematic diagram of air performance test and field experimental setup is shown in Figures 6A,B. The performance of the fan was tested at room temperature and pressure, air parameters corresponding to various operating conditions of the axial fan were recorded by a comprehensive atmospheric pressure, temperature and air humidity tester at the front of the inlet collector (wind speed was zero), and the opening and flow rate of the cylinder were regulated by the inlet throttling device. During the experiments, the inlet throttling device was adjusted to record the inlet and outlet pressures and the pressure difference between the Pitot tube and hydrostatic tube under ten sets of flow conditions.

FIGURE 6. Aerodynamic performance test (A) Air performance experimental setup diagram (B) Field experimental setup (C) Comparison of experimental and numerical simulation performance curves.
Figure 6C compares the numerical simulation with experimental results. It can be seen from the figure that the simulated values of total pressure and efficiency were basically consistent with the experimental values. The simulated value of total pressure was slightly lower than the experimental value, with a maximum error of less than 5%. There was a small difference between the simulated and experimental values in terms of efficiency, with a maximum error of 9.09% at low flow rates and an error of less than 3% at the remaining positions. Therefore, the computational model is considered to be highly reliable.
Noise was simulated on the computational model using a large eddy combined with sound simulation theory. The steady flow field was firstly calculated and then used as the initial flow field for calculating the unsteady flow field. The far-field noise of the fan was determined in the commercial software by calculating the time-domain integral and area fraction. The time required to rotate the hub by 1° is represented by the time step Δt, where Δt = 1/(6n). Therefore, in order to accurately obtain the information about near-field flow field, the time step was set to 0.0001 s in this study.
The sound field was calculated by fast Fourier transform (FFT) to determine the SPL and noise spectrum. The formula for solving the time domain for the instantaneous sound pressure p (Wu Chen and Zhou, 2021) is:
where r is the distance from the sound source to the receiving point, “·” represents the derivative of time,
According to the noise test standard “GB/T2888-2008 Fan and Roots Blower Noise Measurement Method” (General Administration of Quality Supervision, 2008), the noise receiving point was set at 1,250 mm (diameter) at a horizontal position of 45° from the center of the outlet surface. The schematic diagrams of noise monitoring points and experimental settings are individually shown in Figures 7A,B.
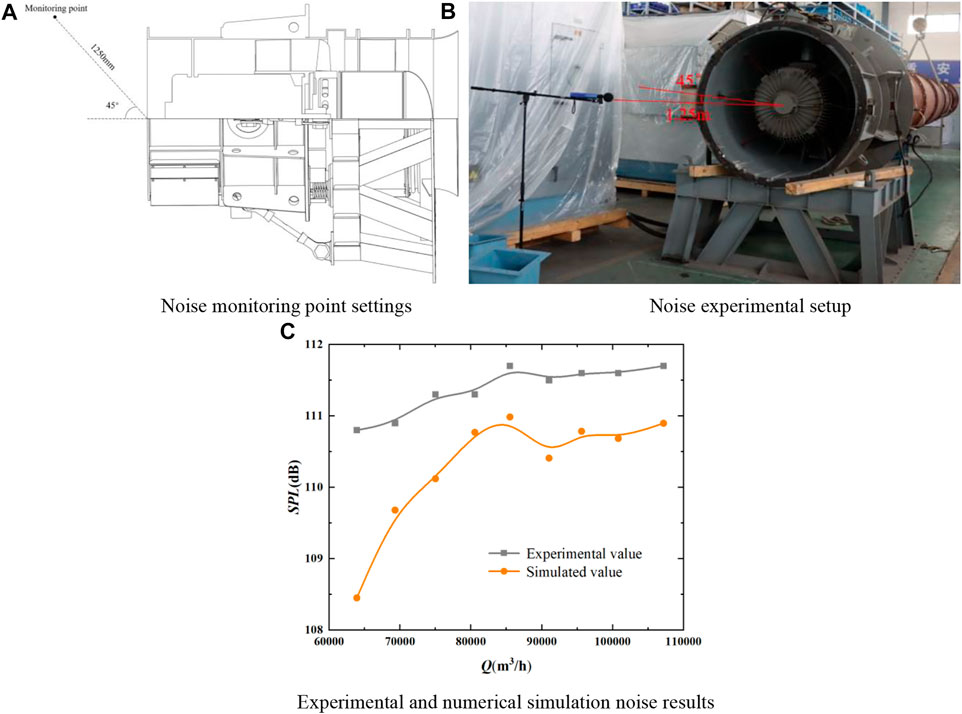
FIGURE 7. Noise test (A) Noise monitoring point settings (B) Noise experimental setup (C) Experimental and numerical simulation noise results.
Figure 7C shows the experimental and numerical simulation noise results. As can be seen from the figure, the fan was under extreme conditions at the flow rate of around 70,000 m³/h, whose simulated noise value was lower than the experimental one, with a maximum error of less than 3%. However, the two values tended to be consistent when the fan was working at the flow rate of more than 75,000 m³/h. And when the flow rate was close to the designed one, the average noise values during experiment and simulation were respectively 111.52 dB and 110.88 dB, with a relative error of ≤0.57%.
The above analysis demonstrates that the noise of the fan designed according to the standard of nuclear counting fan exceeded the requirements, with aerodynamic performance poorer than the standard, so it needed to be optimized. The fan is a non-standard design, with many structural components and interactional influencing factors, so it is of great importance to analyze these factors to identify the optimal optimization objective.
A large number of influencing factors were involved in this study, and Sobol’ global sensitivity analysis method was selected because it can quantify the input and output uncertainties as probability distributions and attribute the output variance to the combination between the input variables that fits better with the problem in this study.
Global sensitivity analysis (Hart and Gremaud, 2018) gives the relationship between the partial derivatives of the output concerning the input variables over the entire input variable space, i.e.
The global sensitivity metric
where
For some input variable xi, the global sensitivity principal indicator is:
The fan mainly consisted of IGV, moving vane, OGV, etc. Therefore, a total of 14 parameters, namely the number of IGV ω1, the number of moving vane ω2, the number of OGV ω3, hub ratio ω4, IGV and moving vane spacing ω5, moving vane and OGV spacing ω6, blade top clearance ω7, IGV bending angle ω8, IGV chord length ω9, moving vane bending angle ω10, moving vane swept angle ω11, OGV bending angle ω, OGV chord length ω13, fan diameter ω14, were analyzed by the Sobol’ global sensitivity analysis method. The analysis procedure is specifically displayed in Figure 8 and the schematic diagram of structural parameters is shown in Figure 9.
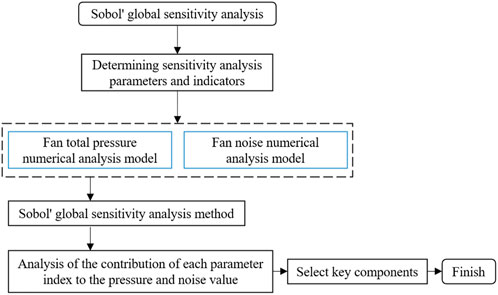
FIGURE 8. Flow chart of sensitivity analysis.
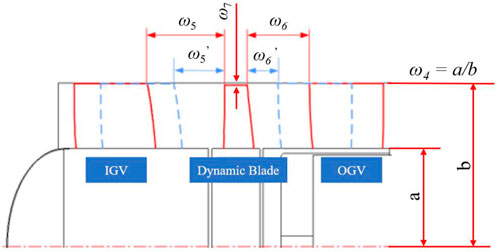
FIGURE 9. Schematic diagram of structural parameters.
The global sensitivity values of each parameter to the total pressure and noise of the fan were obtained, as illustrated in Figure 10. In general, the influence of parameters such as IGV bend angle ω8, IGV and moving vane spacing ω5, and IGV chord length ω9 was greater, among which moving vane bend angle ω10 and IGV bend angle ω8 had the highest total global sensitivity values to pressure, which were 31.214% and 30.113%, respectively, and IGV bend angle ω8 and IGV and moving vane spacing ω5 had the highest total global sensitivity values to noise, which were 33.124% and 30.145%, respectively.
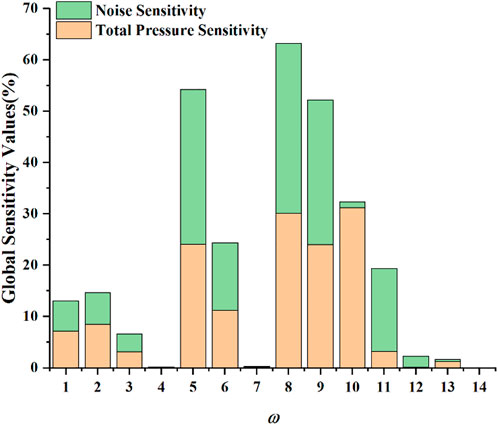
FIGURE 10. Summary of global sensitivity.
According to the above analysis, IGV and moving vane had a large impact while OGV had a relatively small impact on the aerodynamic performance and noise. The internal flow characteristics of the fan will be analyzed as follows to further clarify the optimization objective.
The radial section of the hub with blade flow surface R = 280 mm (0.5 times the blade height, Plane1) was selected to study the internal flow characteristics of the fan, and a vertical section was made over the center of the fan circle (as shown in Plane 2). Figure 11 shows the schematic diagram of the radial section of the hub.
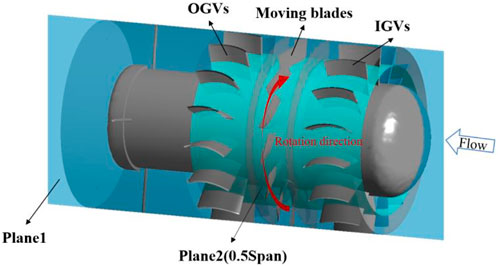
FIGURE 11. Schematic diagram of the internal structure of the fan.
Figure 12 shows the velocity vector distribution on Plane 1. As shown in the figure, there was an obvious vortex in the IGV area, which was located between the IGVs. The vortex was mainly concentrated on the pressure surface of the IGV, which was attributable to the blade shape of the guide vane. At the same time, there was a low-speed region in the reflux area, while a high-speed region on the suction surface of the moving blade, which resulted in flow disorder in the dynamic-static coupling zone between the IGV and the moving vane.
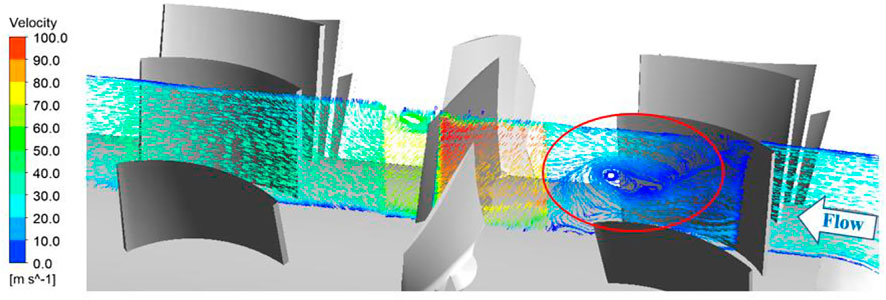
FIGURE 12. The velocity vector distribution on plane 1.
As a part of the fan, IGV deflected the air flow before entering the hub, increased the flow rate and pressure drop. It was hence an important part of a large axial flow fan. The above analysis also indicates that the structural design of the IGV was not rational and had a significant impact on the performance and noise of the fan, so IGV was identified as the optimization objective of this study.
The IGV of axial fan is composed of blades with the same thickness. Its shape is formed by thickening and lofting the midline of the blade profile, and the midline is determined by controlling the arc length of a circle with radius R.
The parameters of the IGV are shown in Figure 13. The IGV midline was determined by chord length σa, angle α corresponding to the chord, tip deflection angle was defined as β, and the axial distance from the nearest point of the IGV midline to the leading edge of the moving vane as σb. These four parameters were optimized in this study.
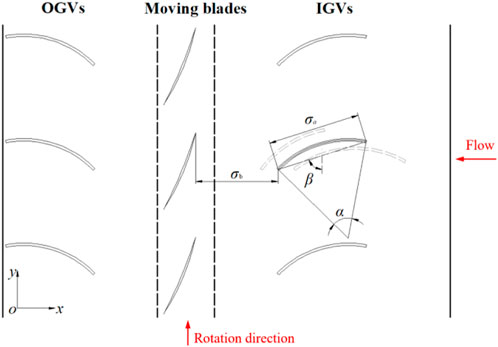
FIGURE 13. The structure parameters of IGVs.
A single circular arc blade is generally adopted in the nuclear power fans. The new IGV midline can be obtained by controlling parameter change and characterizing profile change. Under the premise of ensuring the smooth curvature of the blade, the variable range of each parameter is determined as follows: σa: 234–350 mm, α: 44–68°, β: 58–86°, σb: 208–312 mm.
Kriging model is an unbiased estimator with minimum variance. The design variables
where f(x) is a vector of regression function consisting of polynomials, l is the dimension of the corresponding values, and β:,l is the corresponding regression coefficient. zl(x) is a random variable with variance σl2, which means that the value is zero. γ* is the local correlation coefficient, r(x) is a vector describing the local correlation, R is the correlation matrix between the random variables, and F is the sample matrix.
To establish the Kriging model, samples should be obtained through experimental design. The optimal Latin hypercube experiment design (Opt LHD) is generally adopted to overcome the deficiencies of random sample space selection and sample concentration in Latin hypercube method. And its formula is expressed as:
As shown in Figure 14, the optimal Latin overshoot method was used to establish 55 groups of spatial samples for the variation range of design parameters, among which the first 50 groups were used as samples to draw IGV profiles, of which the first 50 groups were used as samples to draw the IGV profiles. It can be seen from the figure that the resulting samples were evenly distributed and well filled in space.
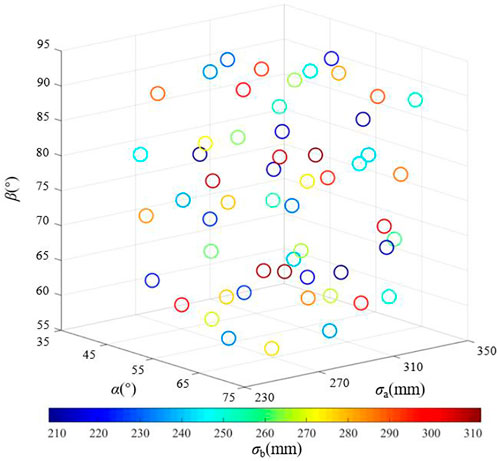
FIGURE 14. Schematic diagram of the spatial distribution of samples.
This study involves a typical multi-objective optimization problem. In order to seek the optimal solution and reduce the computational time while ensuring accuracy, the model was optimized by NSGA-II based on the fast non-dominated sorting method to reduce the computational amount while retaining excellent individuals, and the elite strategy was introduced to ensure the accuracy of the optimization results. In addition, crowding degree and crowding degree comparison operator are used to overcome the defects of NSGA that need to manually specify the sharing parameters while ensuring population diversity.
The IGV chord length σa, rounding angle α, tip deflection angle β, and the shortest axial distance σb between the IGV and the moving vane were taken as design variables, and the total pressure and noise of the fan as the optimization objectives. The corresponding mathematical model is:
The constraint is:
Figures 15, 16 are the fitting results of Kriging model and the mean square error (MSE) of fitting design variables with the optimized target total pressure and SPL, respectively. The MSE value was calculated according to the mean squared error MSE formula (Eq. 17) and the linear regression coefficient was determined by R2 formula (Eq. 18), and it can be seen from the figures that the MSE value of noise was less than 0.1 and that of pressure was less than 0.15, verifying that the accuracy of the established Kriging model met the requirements.
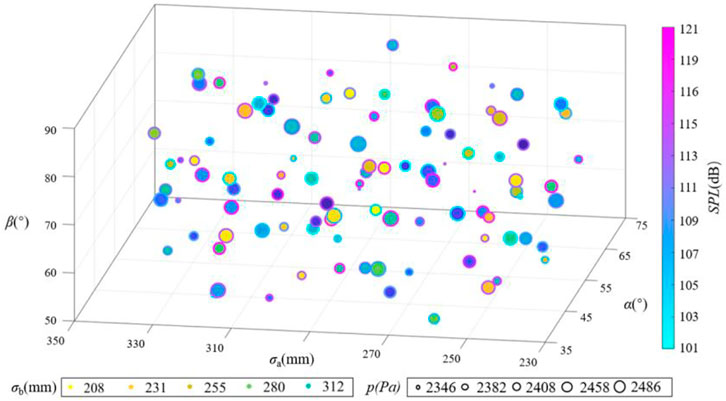
FIGURE 15. Kriging model fitting results of design variables and total pressure and SPL.
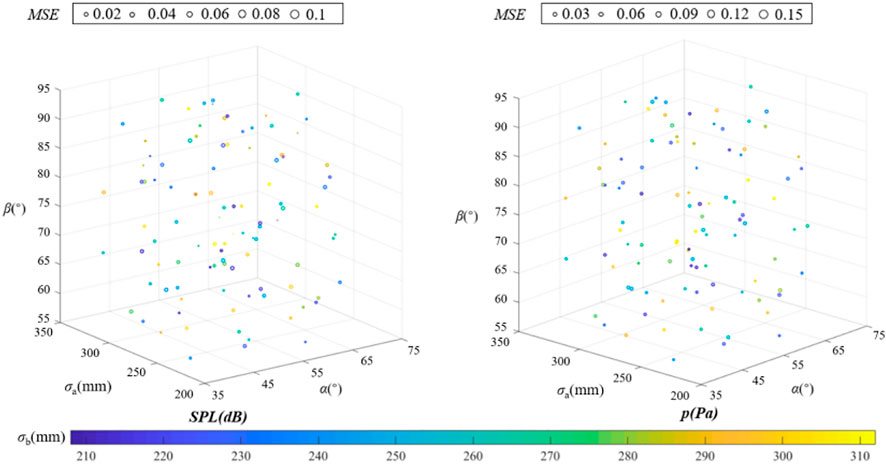
FIGURE 16. Fitted mean square error MSE.
The constructed Kriging model was solved by NSGA-II with the overall number being set to 100, the mutation probability to 0.01, the crossover probability to 0.8, and the number of iterations to 400. The Pareto-front is shown in Figure 17, and the optimal solutions are listed in Table 2.

FIGURE 17. Pareto-front diagram.
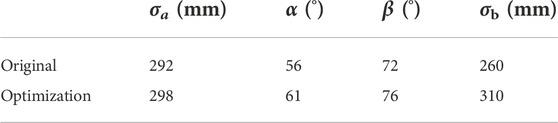
TABLE 2. Comparison of parameters before and after optimization.
To verify the accuracy of the model optimization results, the obtained optimization results were brought into the model to recalculate the MSE, as shown in Table 3. As can be seen from the table, MSE was reduced significantly, indicating that the mean and variance of the obtained results were reduced to meet the design requirements and complete multi-objective optimization.
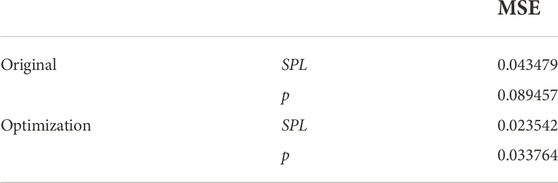
TABLE 3. MSE before and after optimization.
Figure 18 shows the settings optimization of IGV. The chord length σa of the IGV was increased by 55 mm, the corresponding circular angle α by 5°, the nearest distance σb from the IGV to the moving vane by 48 mm, and its angle with the y-axis β by 3°. The physical models are compared in Figure 19.
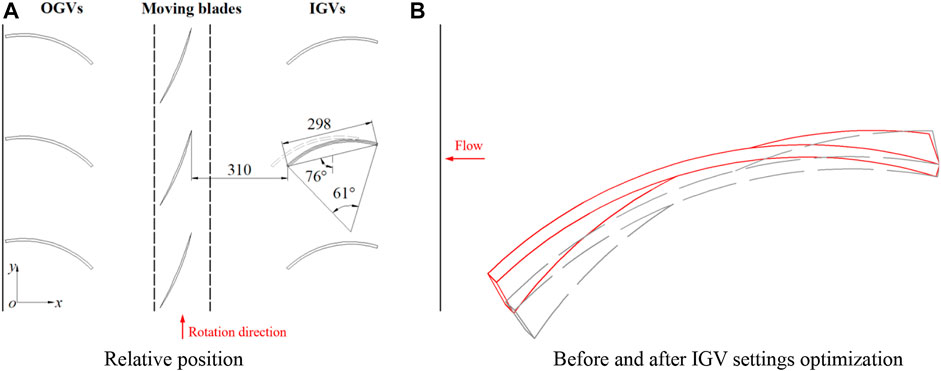
FIGURE 18. Settings optimization model structure (A) Relative position (B) Before and after IGV settings optimization.
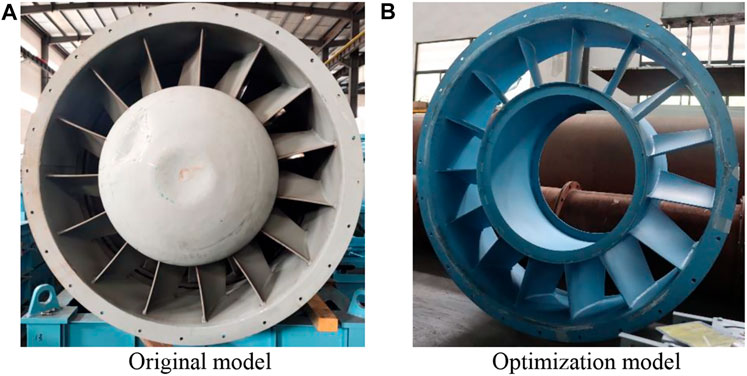
FIGURE 19. Comparison of original and optimized models (A) Original model (B) Optimization model.
To study the internal flow characteristics of the optimized fan, three planes were intercepted in the hub radial direction along the blade height located at R = 150 mm (10% blade height), R = 280 mm (50% blade height) and R = 430 mm (90% blade height) in the hub radial direction. The rotary surface is shown in Figure 20.
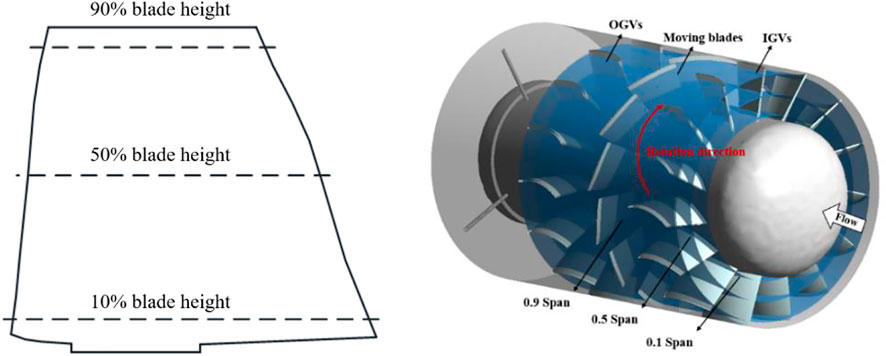
FIGURE 20. Schematic diagram of the rotating surface.
Figure 21 shows the streamlines at the blade heights of 0.1, 0.5, and 0.9 of IGV obtained by numerical simulation before and after optimization. It can be seen from the figure that vortices were more evident at the blade heights of 0.1, 0.5 and 0.9 and were only present at the blade height of 0.1. After optimization, the vortex disappeared on the IGV and OGV at each blade height, but still accompanied by a low-speed region. Based on the results of the simulated internal flow field, the optimization effect was satisfactory and the proposed method was reliable to some extent.
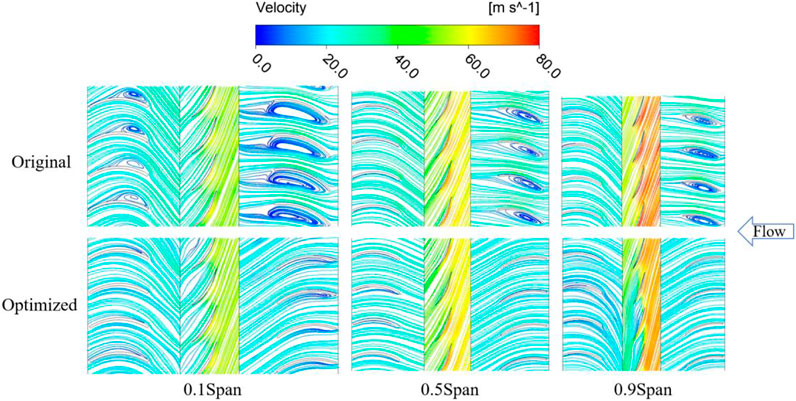
FIGURE 21. Streamlines coloured by flow velocity at different spans.
The static pressure distributions at the blade heights of 0.1, 0.5 and 0.9 of IGV obtained by numerical simulation are shown in Figure 22. Cp is the pressure coefficient. Eq. 13 gives the Cp empirical formula (Clancy, 1975):
where p is the static pressure at the point of the required pressure coefficient, p∞ is the static pressure away from any disturbance, ρ∞ is the fluid density, V∞ is the fluid velocity.

FIGURE 22. IGVs pressure distribution before and after optimization (A) Original (B) Optimization.
It can be seen that from Figure 22 the pressure coefficients of each blade height of the original IGV showed the same trend, but the pressure gradients were larger, and the separation points were all located before 0.2. In the interval of 0–0.2, the pressure surface Cp dropped from about 0.52 to about 0.18, indicating the possible presence of shedding vortices in such interval. After optimization, pressure coefficient amplitude increased, pressure gradient decreases, and the separation point was shifted back, suggesting that the pressure on the IGV surface changed more smoothly and the shedding vortex was reduced, which further reduced noise caused by the pressure fluctuation on the IGV surface. In addition, the optimized airflow kinetic energy decreased, the pressure of the fan increased, and the aerodynamic performance and efficiency were subsequently improved.
The numerical simulation results before and after optimization are shown in Figure 23. From Figure 23A, it can be found that the total pressure and efficiency at all flow rates were improved after optimization. At the flow rate of >70,000 m3/h, the total pressure increased more significantly by about 140.97 Pa at the design working condition, and at the flow rate of <85,000 m3/h, the efficiency of the fan at the design working condition was more obviously improved by about 2.06%. Moreover, the noise of the optimized fan at all flow rates at the at the design working condition was significantly reduced by about 3.08 dB.
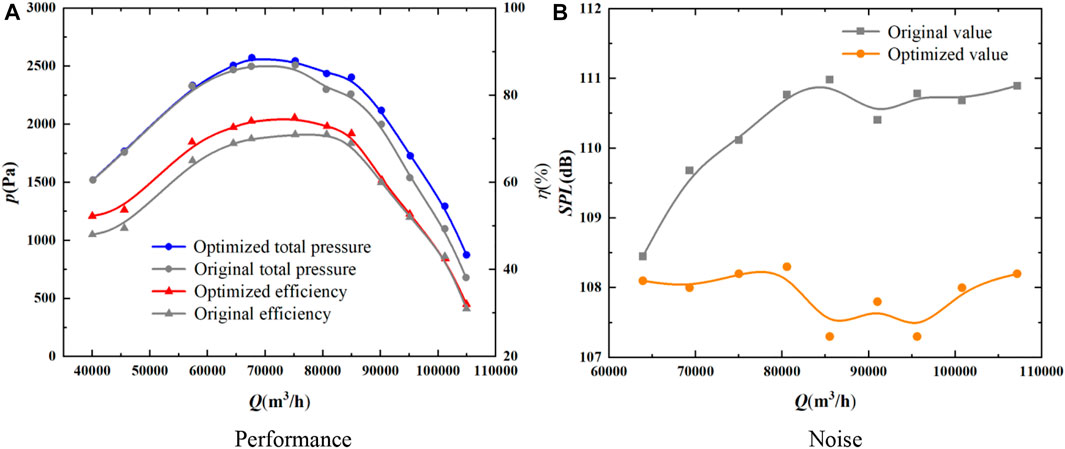
FIGURE 23. Numerical simulation results of aerodynamic performance before and after optimization (A) Performance (B) Noise.
The aerodynamic performance of the axial flow fan was tested based on the provisions and requirements of the “GB/T 1236–2017 standardized air duct performance test for industrial ventilators on air ducts”. The settings diagrams of air performance test and field experiment have been mentioned in Section 2.2.
The aerodynamic performance curve of the fan before and after optimization is shown in Figure 24. It can be seen from the figure that the fan had the same trend in terms of aerodynamic performance before and after optimization, but the total pressure and total pressure efficiency of the optimized fan under various working conditions were much higher. The total pressure, static pressure and efficiency of the fan was respectively increased by 220.3 Pa, 257.8 Pa and 4.2% at most after optimization. At the design operating point (82,400 m3/h), the total pressure of the fan was increased by about 156.4 Pa, the static pressure by 231.2 Pa, and the efficiency by about 0.86%. The increase in total and static pressure enabled the fan to overcome greater resistance, and the increase in efficiency reduced motor power and saved energy.

FIGURE 24. Comparison of aerodynamic performance curves of fans before and after optimization.
Referring to the noise test standard “GB/T 2888-2008 fan and roots fan noise measurement method”, noise receiving points were set at 45° from the center of the outlet surface, one time that of the diameter (1250 mm) at a horizontal position, and the noise of the optimized fan was also tested.
The SPL at the far-field noise receiving point of the original and optimized fans at the frequency of 0–5500 Hz were compared, as shown in Figure 25. Before and after optimization, the SPL spectrum distribution peaked at the motor operating frequency (14 Hz), fundamental frequency (302 Hz) and double fundamental frequency (604 Hz), and gradually decreased, which was the noise of the fan was converted from discrete to turbulent in such frequency range. And discrete noise in the fan contributed less to the far-field noise than turbulent broadband noise. After optimization, the peak value of the fundamental frequency dropped from 111.7 dB to 105.3 dB.
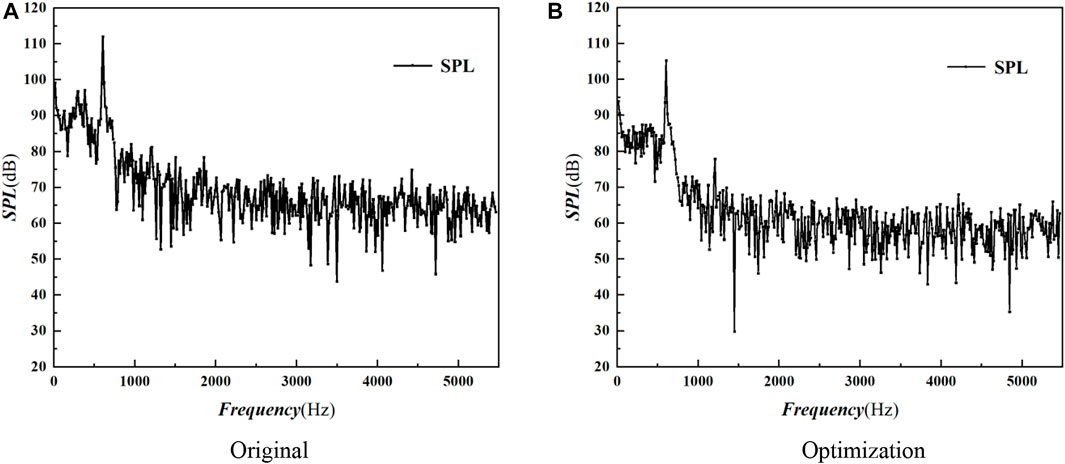
FIGURE 25. Comparison of noise spectrum before and after optimization of large axial fan (A) Original (B) Optimization.
The noise values of the original and optimized IGV structures under different operating conditions are presented in Table 4. It can be found from the table that noise was significantly reduced under different operating conditions. The SPL of the optimized fan operating at the low flow rate was reduced by 5.5 dB. With the increase of air volume, the SPL gradually decreased, and when the air volume exceeded 70,000 m³/h, the SPL of the fan gradually stabilized. At the design working point, the SPL of the fan was reduced by about 6.4 dB, indicating satisfactory optimization effect, which confirmed the reliability of the optimization method.
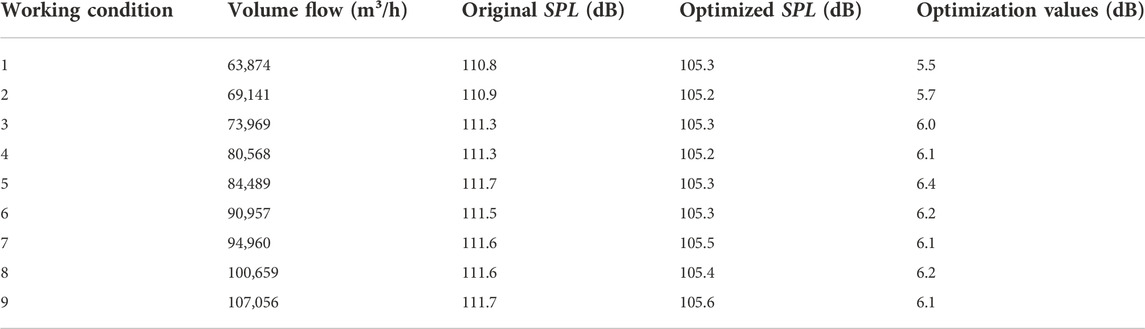
TABLE 4. Noise values under different working conditions in the test.
This study performed multi-objective optimization on an IGV for a large axial fan based on NSGA-II, and verified its feasibility and effectiveness through experiments and numerical simulations. The main conclusions of this work are as follows.
1) Using Sobol’ global sensitivity analysis method, IGV bending angle and moving blade bending angle have the maximum sensitivity to the total pressure of the fan, and the distance between the IGV and the moving blade has the maximum sensitivity to noise. According to the analysis on the internal flow characteristics of the fan, there is obvious vortex between IGVs and the vortex is mainly concentrated on the pressure surface of IGVs.
2) The IGV pressure distribution before and after optimization was analyzed by numerical simulation. The results indicate that the static pressure gradient of the fan after optimization changed more smoothly and the shedding vortices were reduced. The experimental results confirm that the performance of the fan under various working conditions is improved after optimization, and the total pressure is increased by about 156.4 Pa and the total pressure efficiency by about 0.85% while noise is reduced by 6.4 dB.
3) In this study, the NSGA-II optimized Kriging model was applied to the multi-objective optimized design of a large axial fan IGV. The feasibility of the method was verified and new ideas were provided for the optimal design of other large axial fans.
The original contributions presented in the study are included in the article/supplementary material, further inquiries can be directed to the corresponding author.
SZ (First Author and Corresponding Author) and TZ participated in the design of this study, and they both perfoemed the statistical analysis. SZ carried out the study and collected important backgroud information. TZ drafted the manuscript. ZM and LL carried out the concepts, design, definition of intellectual content, literaturesearch, data acquisition, data analysis and manuscript preparation.
The authors declare that the research was conducted in the absence of any commercial or financial relationships that could be construed as a potential conflict of interest.
All claims expressed in this article are solely those of the authors and do not necessarily represent those of their affiliated organizations, or those of the publisher, the editors and the reviewers. Any product that may be evaluated in this article, or claim that may be made by its manufacturer, is not guaranteed or endorsed by the publisher.
Canepa, E., Cattanei, A., Mazzocut Zecchin, F., Milanese, G., and Parodi, D. (2016). An experimental investigation on the tip leakage noise in axial-flow fans with rotating shroud. J. Sound Vib. 375, 115–131. doi:10.1016/j.jsv.2016.04.009
Chai, X. Y., Xu, L. Z., Sun, Y. X., Liang, Z. W., Lu, E., and Li, Y. M. (2020). Development of a cleaning fan for a rice combine harvester using computational fluid dynamics and response surface methodology to optimise outlet airflow distribution. Biosyst. Eng. 192, 232–244. doi:10.1016/j.biosystemseng.2019.12.016
Chen, W., and Zhou, Y. (2021). Research on aerodynamic noise of tandem double cylinders based on K-fwh sound comparsion method. J. Beijing Univ. Aeronautics Astronautics 47, 10.
Choi, Y. S., Kim, Y. I., Kim, S., Lee, S. G., Yang, H. M., Lee, K. Y., et al. (2019). “A study on improvement of aerodynamic performance for 100HP axial fan blade and guide vane using response surface method,” in ASME-JSME-KSME Joint Fluids Engineering Conference, San Francisco, California, USA, July 28–August 1, 2019 (New York: Amer Soc Mechanical Engineers).
Cui, L. J., Lu, Z. Z., and Zhao, X. P. (2010). Moment-independent importance measure of basic random variable and its probability density evolution solution. Sci. China Technol. Sci. 53 (4), 1138–1145. doi:10.1007/s11431-009-0386-8
Fakhraei, A., Faghihi, F., Rabiee, A., and Safarinia, M. (2021). Coolant flow rate instability during extended station blackout accident in NuScale SMR: Two approaches for improving flow stability. Prog. Nucl. Energy 131, 103602. doi:10.1016/j.pnucene.2020.103602
General Administration of Quality Supervision, (2008). “Standardization administration of the people's republic of China,” in GB/T 2888-2008 Noise measurement method for fans and Roots blowers (Beijing: China Standard Press).
General Administration of Quality Supervision, (2017). “Standardization administration of the people's republic of China,” in GB/T 1236-2017 Standardized air duct performance test for air duct industrial ventilator (Beijing: China Standard Press).
Gu, Z. Y., Zhu, Y. Y., Xiang, J. L., and Zeng, Y. (2021). A prediction method of operation trend for large axial-flow fan based on vibration-electric information fusion. J. Cent. South Univ. 28 (6), 1786–1796. doi:10.1007/s11771-021-4629-6
Hart, J. L., and Gremaud, P. A. (2018). AN approximation theoretic perspective of sobol' indices with dependent variables. Int. J. Uncertain. Quantif. 8 (6), 483–493. doi:10.1615/Int.J.UncertaintyQuantification.2018026498
Hu, Z. H., and Lu, W. (2017). “Numerical investigation on performance and aerodynamic noise of high speed axial flow fans,” in 2nd IEEE Advanced Information Technology, Electronic and Automation Control Conference (IAEAC), Chongqing, China, 25-26 March 2017, 885–889.
Huang, W. H., Chen, L., Wang, W. J., Yang, L. J., and Du, X. Z. (2020). Cooling performance optimization of direct dry cooling system based on partition adjustment of axial flow fans. Energies 13 (12), 3179. doi:10.3390/en13123179
Kim, J. H., Ovgor, B., Cha, K. H., Kim, J. H., Lee, S., and Kim, K. Y. (2014). Optimization of the aerodynamic and aeroacoustic performance of an axial-flow fan. Aiaa J. 52 (9), 2032–2044. doi:10.2514/1.J052754
Kromer, F. J., Moreau, S., and Becker, S. (2019). Experimental investigation of the interplay between the sound field and the flow field in skewed low-pressure axial fans. J. Sound Vib. 442, 220–236. doi:10.1016/j.jsv.2018.10.058
Moaveni, B. S. (1999). Finite element analysis theory and application with ANSYS. New Jersey, United States: Prentice-Hall.
Nishi, Y., Mori, N., Yamada, N., and Inagaki, T. (2022). Study on the design method for axial flow runner that combines design of experiments, response surface method, and optimization method to one-dimensional design method. Renew. Energy 185, 96–110. doi:10.1016/j.renene.2021.12.009
Taghinezhad, J., Alimardani, R., Masdari, M., and Mahmoodi, E. (2021). Performance optimization of a dual-rotor ducted wind turbine by using response surface method. Energy Convers. Manag. X 12, 100120. doi:10.1016/j.ecmx.2021.100120
Tanasic, N., Jankes, G., and Skistad, H. (2011). Cfd analysis and airflow measurements to approach large industrial halls energy efficiency: A case study of a cardboard mill hall. Energy Build. 43 (6), 1200–1206. doi:10.1016/j.enbuild.2010.12.034
Tang, X., Luo, J. Q., and Liu, F. (2017). Aerodynamic shape optimization of a transonic fan by an adjoint-response surface method. Aerosp. Sci. Technol. 68, 26–36. doi:10.1016/j.ast.2017.05.005
Venturelli, G., and Benini, E. (2016). Kriging-assisted design optimization of S-shape supersonic compressor cascades. Aerosp. Sci. Technol. 58, 275–297. doi:10.1016/j.ast.2016.08.021
Zhang, C., Li, A. G., Li, J. X., Hou, Y. C., and Chen, X. (2021a). Radiation noise control of a 90° rectangular elbow in ventilation and air conditioning systems. J. Build. Eng. 37, 102157. doi:10.1016/j.jobe.2021.102157
Zhang, S. G., Li, R. Z., Zhang, Y. F., and Chen, H. X. (2021b). Aerodynamic optimization and noise reduction of a two-stage series compact fan. J. Aerosp. Eng. 34 (5). doi:10.1061/(asce)as.1943-5525.0001304
Zhang, W. J., Yuan, J. P., Zhou, B. L., Li, H., and Yuan, Y. (2018). The influence of axial-flow fan trailing edge structure on internal flow. Adv. Mech. Eng. 10 (11), 168781401881174. doi:10.1177/1687814018811745
Zhao, F. T., Jing, X. D., Yang, M. S., Wang, D. Y., Sha, Y. D., and Luan, X. C. (2020). Experimental study of rotor blades vibration and noise in multistage high pressure compressor and their relevance. Chin. J. Aeronautics 33 (3), 870–878. doi:10.1016/j.cja.2019.02.008
Zhou, S. Q., Hu, Y. J., Lu, L. F., Yang, K., and Gao, Z. L. (2022). IGV optimization for a large axial flow fan based on MRGP model and Sobol' method. Front. Energy Res. 10. doi:10.3389/fenrg.2022.823912
D Diameter (mm)
E Mathematical expectation
F Sample matrix
IF Failure indicator function
m1 Number of IGVs
m2 Number of OGVs
n Rotaing speed(r/min)
ptf Total pressure(Pa)
Q The fan volume flow(m³/h)
r Vector of local correlations
R2 Linear regression coefficient of determination
Si Global Sensitivity Indicator
V (·) Variance Operator
xi Random Variable
y+ A dimensionless parameter
yl Response
Z Number of moving blade
zl Random variables
α Central angle
β Guide vane tip deflection angle
β:,l Regression coefficients
γ* Local correlation coefficient
σa The chord length of the guide blade(mm)
σb The distance between moving blade and IGVs (mm)
σl2 Variance
ωi Structure parameters
CFD Computational Fluid Dynamics
FW-H Ffowcs Williams and Hawkings
GERSM Gradient-Enhanced Response Surface Model
IGV Inlet guide blade
MSE Mean Square Error
NSGA-II Non-dominated Sorting Genetic Algorithm-II
OGV Outlet Guide Blade
Opt LHD Optimal Latin hypercube design
SPL SPL (dB)
Keywords: kriging model, sensitivity analysis, parameterization, multi-objective optimization, axial fan
Citation: Zhou S, Zhang T, Mao Z and Lu L (2023) Multi-Objective optimization of an IGV for a large axial fan based on NSGA-II. Front. Energy Res. 10:994654. doi: 10.3389/fenrg.2022.994654
Received: 15 July 2022; Accepted: 15 September 2022;
Published: 09 January 2023.
Edited by:
Xiaohu Yang, Xi’an Jiaotong University, ChinaReviewed by:
Adel Ghenaiet, University of Science and Technology Houari Boumediene, AlgeriaCopyright © 2023 Zhou, Zhang, Mao and Lu. This is an open-access article distributed under the terms of the Creative Commons Attribution License (CC BY). The use, distribution or reproduction in other forums is permitted, provided the original author(s) and the copyright owner(s) are credited and that the original publication in this journal is cited, in accordance with accepted academic practice. No use, distribution or reproduction is permitted which does not comply with these terms.
*Correspondence: Shuiqing Zhou, enNxd2g5ODZAMTYzLmNvbQ==
Disclaimer: All claims expressed in this article are solely those of the authors and do not necessarily represent those of their affiliated organizations, or those of the publisher, the editors and the reviewers. Any product that may be evaluated in this article or claim that may be made by its manufacturer is not guaranteed or endorsed by the publisher.
Research integrity at Frontiers
Learn more about the work of our research integrity team to safeguard the quality of each article we publish.