 Guang Yang1
 Yong Zhu
- 1Power China Hubei Electric Engineering Co. Ltd, Wuhan, China
- 2State Grid Hefei Power Supply Company, Hefei, China
New energy systems, such as wind power and photovoltaic and distributed power supply, in the power generation and grid-connected transmission system basically will use stronger insulation design, higher operational safety, and smaller footprint GIL equipment, while the new energy transmission system of the smart grid development trend requires accompanying the electronic transformer equipment to promote a large area. However, the current GIL equipment used in new energy transmission systems has caused great electromagnetic interference to the electronic equipment due to the compact layout of the equipment and the transient signals generated by normal operation, which has seriously restricted the development of smart grids and became a major obstacle to the grid connection of new energy systems. In order to study the characteristics and developmental law of transient electromagnetic interference signal of GIL equipment in new energy transmission and transformation system, this study proposes a dynamic arc model based on an optimized arc extinguishing criterion, verifies the correctness of the improved dynamic arc model through theoretical analysis, simulates calculation combined with the test measurement data, and compares and analyzes the simulation results with test measurement data to study the transient electromagnetic interference source signal during arc burning duration. The simulation results and test data are compared and analyzed to study the pulse steepness, size of the wave head, and overall waveform development law of the transient electromagnetic interference source signal during the arc burning process. It is concluded that the dynamic arc model based on the optimized arc extinguishing criterion can be better used to study the transient electromagnetic interference signal in the GIL equipment. Meanwhile, the transient electromagnetic interference signal has the characteristics of large amplitude and high frequency, the maximum overvoltage can reach 1.9 p.u., the UHF can reach 30 MHz, and the wave head rise time is about 12 ns. This study provides theoretical support for subsequent research on suppressing transient electromagnetic interference source signals, improving the anti-electromagnetic interference performance of electronic devices, and is dedicated to solving the obstruction problem in the process of grid connection of new energy transmission and substation systems.
1 Introduction
The goal of “carbon peaking and carbon neutrality” has begun to rapidly integrate with various medium- and long-term plans of various countries. For the corresponding power system, the focus of development is not only from the integrated development of “source network, load, and storage” but also to focus on the construction of new energy power generation systems. Traditional coal-fired power generation is gradually transitioning to new energy power generation methods such as wind, light, and nuclear energy. Under the background of policy increases, the systematic construction of new power transmission and transformation that matches the connection of power generation to the grid has been continuously upgraded. Among them, the new power transmission and transformation system of new energy power generation and grid connection basically adopts the design form of the user’s GIL equipment. On the one hand, the reason is that land resources have become tight due to urban development, and on the other hand, the indoor GIL equipment is safer and more reliable, and it is not easy to cause the rejection of the surrounding residents. Therefore, more and more new power transmission and transformation systems connected to the grid for new energy power generation use the GIL equipment.
At the same time, with the development of smart grids, the development trend of new energy transmission and transformation systems is the widespread use of electronic transformer equipment used in conjunction with the compact GIL equipment. As shown in Figure 1, compared with the traditional open power transmission and transformation system, one of the major drawbacks of the GIL equipment is that the space is compact, so it is easy to ignore the electromagnetic interference under the premise of ensuring the insulation margin. At the same time, the transient signal generated by the equipment operation of the new energy grid-connected terminal GIS substation will have a serious folding reflection in the pipeline equipment (including the GIL equipment), thus further enhancing its hazard. According to relevant statistics, the failure rate of electronic transformer equipment that has passed the factory electromagnetic interference test has reached 30%, and the corresponding research shows that the main reason why electronic transformer equipment has not been widely promoted in new energy transmission and transformation systems is the high failure rate caused by the strong electromagnetic interference (Liu et al., 2012).
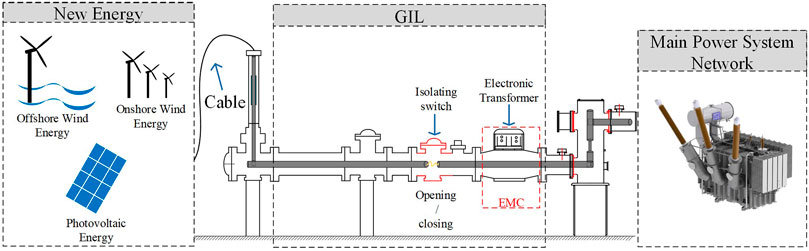
FIGURE 1. Schematic diagram of the grid connection process of the new energy system.
The electromagnetic environment within the substation is complex, and one of the most serious sources of interference is currently recognized as a fast transient signal (Zeng et al., 1996), that is, VFT (Very Fast Transient), which is generated by the GIL internal isolation switch. On the one hand, the isolation switch gear cannot perform automatic arc extinguishing, and on the other hand, the gate knife contact of the isolation switch moves slowly, which easily leads to arc pulling. Therefore, due to the VFT interference source signal that produces a large amplitude and high frequency during the operation of the GIL disconnect switch, the interference characteristics of the VFT interference signal are the wave head rising in the ns level and the high-frequency component up to about 30 MHz (Zhao et al., 2015).
The key point of the VFT electromagnetic interference problem lies in the repeated reignition of the arc between the disconnecting switch action process breaks and the resulting repeated oscillation of the attenuated wave signal in the GIS pipeline constantly folded and reflected superimposed on the generated electromagnetic interference source signal (Chen et al., 2019). For the VFT problem at home and abroad, which began to be researched very early, the overall research trend can be divided into two major aspects, one is to ignore the complex arc process mode, with only a simple switch split instead, and rough simulation of the VFT characteristics can meet the engineering needs of a particular situation; and another research direction is to continuously optimize the arc model through theoretical calculations and simulation modeling to maximize the simulation of the arc development. However, the development process of the arc involves a variety of physical and chemical phenomena coupled, it is difficult to make a breakthrough in purely theoretical calculations, and thus the optimization of the simulation model is the mainstream trend of VFT research. For the arc simulation model research, the most commonly used method is to use the arc resistance characteristics of the arc to simulate the arc process and the literature (Meng et al., 2010) according to the measured data fit to get the arc resistance function model to simulate the study of the arc process generated under the action of the disconnecting switch, but the study is limited to a single-arc study and failed to achieve the modeling of the complete repeated arcing process. Lin et al., 2012aLin, Wang and Xu, ,2012a) obtained the analytic equation of the VFT electromagnetic interference source signal from the theoretical point of view and then analyzed the development law of the signal, but the theoretical analysis was always unable to define the arc model as a function and therefore could not meet the current demand.
Because the traditional arc model of the arc extinguishing conditions is only the arc current natural over zero moment, and the actual arc energy conservation law does not match the situation. This study proposes an improved arc model to optimize the arc extinguishing criterion, through theoretical analysis, simulation modeling combined with actual test data to verify the feasibility of the improved arc model, and the use of simulation modeling to study the interference characteristics of the VFT electromagnetic interference source signal. The simulation data will also be compared with the test waveform to study the waveform signal steepness, wave head size, and the change of 10 consecutive single-arc ignition processes for the subsequent study to suppress the fast transient signal to improve the electronic transformer. At the same time, the simulation data are compared with the measured waveform to study the pulse steepness, wave head size, and the waveform change of 10 consecutive single-arc combustion processes, which provides theoretical support for the subsequent research on suppressing the fast transient signal to improve the anti-electromagnetic interference performance of electronic transformers.
2 Theoretical analysis
2.1 Very fast transient typical waveform
The root cause of VFT interference source in the GIS device system is that the isolation switch has no arcing capability. The strong electromagnetic interference to the adjacent equipment is caused by repeated arc burning between the isolating switch knife edges due to dielectric breakdown and propagation of wave signals in the circuit. Figure 1 shows the typical VFT signal waveform of a no-load line cut by a disconnecting switch (Duan et al., 2015).
From Figure 2, we can see that from the moment the disconnect switch contacts are separated, the VFT signal begins to form, and the overall development trend of the waveform is presented as a continuous “ladder,” and the rise and fall of the “ladder” is consistent with the change in trend of the power supply side voltage US. At the same time, it is obvious that the maximum and minimum values of VFT appear at the “peak” and “trough” of US, respectively, which is because the “peak” and “trough” of US are both at the “peak” and “trough” of US. This is because the US “peak” and “trough” are the absolute maximum amplitude moment when the arc is more likely to occur. In addition, the horizontal line of each “ladder” represents a complete single-arc burning process, and the blue-dotted waveform in Figure 2 is a complete single-arc waveform.
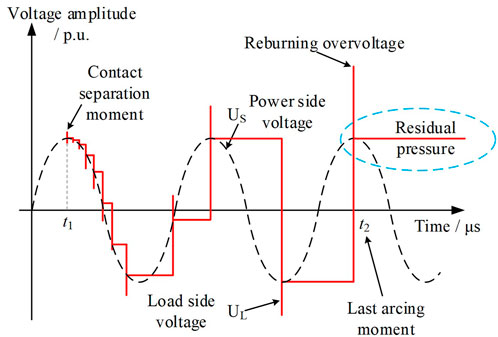
FIGURE 2. VFT typical waveform.
According to relevant standards, the single arcing part of the VFT signal is basically composed of four parts (Wang et al., 2000), and the typical waveform is shown in Figure 3.
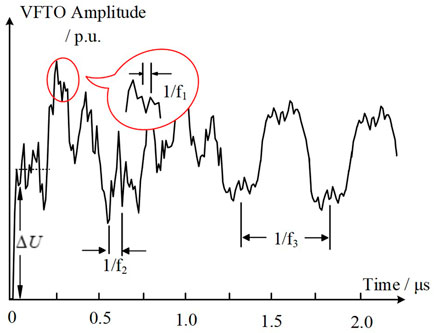
FIGURE 3. Typical waveform of VFT single arcing.
Figure 3 shows that VFT, as single pulse waveform of arc, is delta ΔU superimposed vibration attenuation with the change in trend of high-frequency distortion, and the high-frequency waveform has three main parts: the UHF f1 component part determines the high-frequency distortion, the ultra-high frequency f2 component part determines the signal peaks, and the high-frequency f3 component determines the overall trend of oscillation waveform, The f1 and f2 components are partly caused by the obvious mutation of reflection and wave impedance in the signal propagation process, while the main frequency part of the VFT signal is f3 component, which is generated by resonance caused by the equivalent capacitance characteristic of the external equipment, and this part can be analyzed through theoretical calculation.
2.2 Theoretical calculation of very fast transient dominant frequency component
Taking the disconnector breaking the no-load line as an example, the schematic diagram is shown in Figure 4 , and the combination of R, LS, and K in the dotted box in the figure is equivalent.
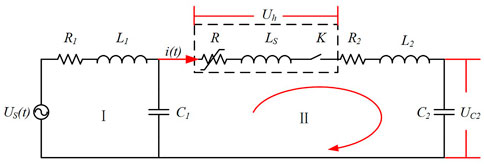
FIGURE 4. Disconnector breaking no-load line.
Assuming that at some point t is in the burning arc state, the switch K is closed and the loop II is turned on, and according to Kirchhoff’s law, the following equation is satisfied:
C1 and C2 are the residual voltage before U1 (0) and U2 (0), respectively, at time t, Uh is the voltage at both ends of the isolating switch, namely, the arc voltage. i (t) is the current flowing through the isolation switch, that is, the arc current. Meanwhile, according to the energy conservation principle of inductor LS and capacitor C2, it can be known that
According to the knowledge of differential equations, the condition that the equation has a solution is to satisfy Eq. 3;
At this time, resonant overvoltage will be generated in the circuit, which is the f3 component of the VFT signal. Let the capacitance C be the series value of C1 and C2 and solve the differential equation to obtain
According to the formula characteristics of differential function solution, in the abovementioned formula, ω0 determines the oscillation of the function, which is called the natural angular frequency. α0 determines the attenuation speed of the function, which is called the attenuation coefficient. Further solution can be obtained as follows:
It can be seen from Eq. 5 that the inductance and resistance value on the load side are the determinants of signal attenuation speed, while all component parameters in the loop, including the inductance, capacitance, and line resistance on the power side and the load side of the isolating switch, together determine the frequency of signal oscillation. Assuming that C0 is a constant, the following equation can be obtained:
It can be seen from Eq. 6 that the equipment connected by the isolation switch close to the line side, taking C2 as an example, is subjected to oscillation attenuation of the VFT interference source signal, and the basic waveform of UC2 (t) is the shock pulse superimposed on the attenuation oscillation waveform. The previously derived calculation results show that the main frequency f3 component of the VFT signal is partly generated by resonance caused by line capacitive parameters, that is, the line capacitive parameters determine the main development trend of the VFT signal (Shen et al., 2020).
3 Modeling and simulation
3.1 Modeling background
Taking the GIS disconnector breaking the no-load line as the research background and selecting the commonly used transient analysis software EMTP of the power system as the research carrier, it is necessary to establish the EMTP equivalent circuit model of each equipment element. The most common method is to obtain the equivalent model and parameters of the element by means of field circuit combination (Duan, 2016; Kang, 2016). For example, the power system is equivalent to the ideal power supply and internal resistance, and the line is equivalent to the wave impedance element of impedance Z and wave velocity V. Considering the complexity of the overall GIS disconnector disconnection no-load line model, some components need to be combined and simplified. The simplified topology is shown in Figure 5.
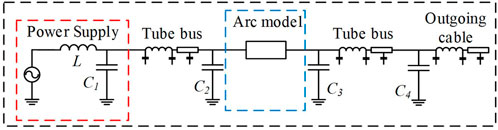
FIGURE 5. Simulation component diagram of the GIS disconnector breaking no-load line.
The system equivalent model of capacitive component is more, and the equivalent capacitance is research emphasized, thus merging the processing capacity equivalent to the system parameters. Figure 4 shows that C1 is the transformer equivalent entrance capacitance in parallel wire casing of capacitance, C2 for transformer exports to lateral load isolation switch all the basin insulator GIS pipeline the sum of the equivalent earth capacitance in parallel, C3 is the equivalent ground capacitance of the load-side isolator, and C4 is the sum of the equivalent ground capacitance of all basin insulators in the GIS pipeline from the load-side isolator to the outlet bushing in parallel.
3.2 Single-arc burning model
A key point in the simulation modeling of the VFT electromagnetic interference source signal is the processing of the arc model. Currently, there are mainly three kinds of arc models for research for single-arc burning: fixed resistance, time-varying resistance, and dynamic resistance model. The fixed resistance model represents the whole process with the simplest stable arc burning state, and the current relevant research is based on the measured arc data using software fitting to obtain a specific value of 0.5 Ω for the arc resistance during stable arc ignition (Tian et al., 2013). The time-varying resistance model is an arc path resistance change function roughly fitted according to relevant data (Liu et al., 2013), expressed in Eq. 7, but the limitation is that the parameters cannot be modified under different working conditions.
The dynamic model is mainly based on Cassie and Mayr arc theory, both of which are assumptions based on the arc path arc energy variation law (Lin et al., 2012).
Taking Cassie’s model as an example, its formula is summarized as follows:
where E is the arc potential per unit length in the arc burning state, θ is the arc burning time constant per unit length, g is the arc conductance, and E0 is the voltage peak at both ends of the isolating switch blade. In the Cassie model, E0 is constant by default, so it is suitable for the case of large arc current.
Three single-arc burning models were simulated and compared, and the fast transient voltage signal was obtained as shown in Figure 6.
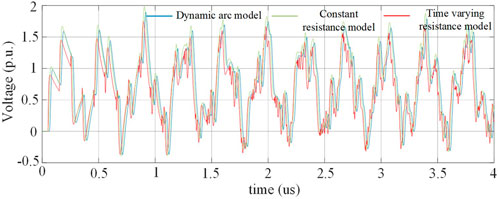
FIGURE 6. Simplified equivalent circuit diagram.
As can be seen from Figure 6, the fixed-value arc resistance model, the time-varying arc resistance model, and the dynamic arc of a single-arc simulation results are basically the same, with only minor differences in the details of the magnitude. Also, it is obvious that the fixed-value resistance model only considers the stable arc state, so the basic peak voltage is larger than the results of the other two models, while the arc resistance of the arc extinguishing stage will instantaneously and rapidly increase. The simulated time-varying resistance model for this peak voltage is the smallest, and the dynamic arc model results between the two are more in line with the actual results. Further Fourier analysis of the results is shown in Figure 7.
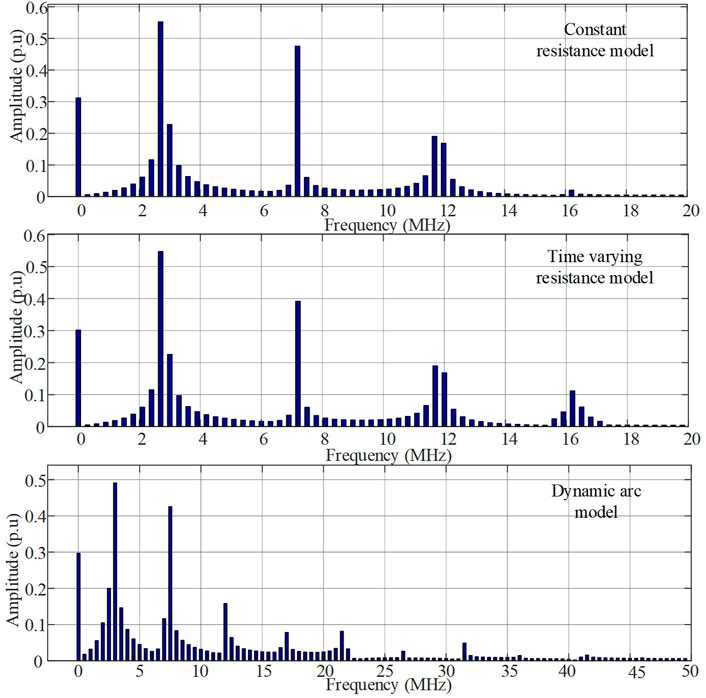
FIGURE 7. Frequency analysis of the fast transient voltage signal under the single arcing model.
As the fast transient signal spectrum within 20 MHz frequency is determined by the parameters of the circuit components, the variable arc resistance will change the amplitude of different frequency parts, and dynamic arc model consideration is more realistic, making the frequency composition more complex. This point from the Fourier analysis results can be observed: three models to generate the waveform frequency composition are more complex, fixed-value resistance model and time-varying resistance model. The main frequencies of the models are smaller, both around 12 MHz, with 2.6, 3, 7, and 12 MHz as the main ones, which are small overall. In the dynamic resistance model, the frequency is more complicated due to the fluctuation of the arc resistance in different stages, except that the frequency composition is similar to that of the other two waveforms within 12 MHz, and the 17 and 21 MHz parts also account for a significant amplitude.
To sum up, the single-arc model is more inclined to the dynamic electric group model.
3.3 Improved dynamic arc model based on the optimized arc extinguishing criterion
The process of the electric arc is the repeated cycle of arc initiation, arc ignition, and arc extinguishing, i.e., the arc is continuously reignited, so the establishment of the reignited arc model is the purpose of the study, and the connection of multiple single-arc ignition models based on the dynamic resistance model into the complete arc ignition process by means of arc ignition and arc extinguishing judgment is the focus of the study. In the literature (Teng, 2013), a model based on the logical judgment language for reignition and arc-extinguishing stage judgment is proposed to realize preliminary arc full process simulation, but the limitation is that the logical judgment language of the arc-extinguishing module is too idealized, and the default arc current naturally passes zero when the arc is extinguished, and the actual study finds the dissipation of the arc energy as the direct cause of arc extinguishing. Therefore, the model in the arc extinguishing judgment is used to distinguish between frequency over zero and high-frequency oscillation over zero. Two different arc currents over the zero mode of logic are not reasonable, only the natural over zero judgment language is set, the arc current over zero is only a necessary condition for arc extinguishing, and the arc current over zero when the arc energy will not be just consumed, so the simple arc current over zero judgment is not only enough to conclude that the arc extinguished but also needs to assist at this time that the smaller the rate of change of the arc current. The lesser the arc energy change tends to be smooth, and the arc does not have arc extinguishing conditions (Meng et al., 2010).
According to the logic judgment ideas proposed in the literature (Teng, 2013) to optimize the arc extinguishing criterion to generate an improved dynamic arc model, the model of the arc ignition judgment logic is relatively simple, and the arc extinguishing state at a certain moment when the voltage difference between the two ends of the isolation switch cutter is greater than the dielectric breakdown strength at that moment is the occurrence of arc ignition. The arc extinguishing criterion has been optimized for the arc current over zero when the arc is extinguished to assist the current change rate criterion at this time, and the two are with the gate. The relationship between the two is with the gate. The overall logic of the improved dynamic arc model is shown in Figure 8.
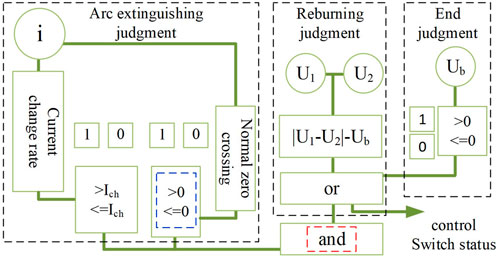
FIGURE 8. Logic judgment schematic of arc simulation.
As shown in Figure 8, the logic judgment module of the improved dynamic arc model is mainly divided into three parts, the arc extinguishing criterion, the arc burning criterion, and the end criterion, in which the end criterion is the logic language to determine whether the operation of the isolation switch is over. Ub is the dielectric breakdown voltage of the knife port, which varies with the size of the knife port spacing, that is, as a function of time t. The input quantity of the arc burning module is the voltage at both ends of the isolation switch knife port U1 and U2 and the input of the arc extinguishing criterion is the arc current i (t) and through the software function automatically obtains the previous arc current i (t-Δt) at the moment t. Ich is a measure of the smaller rate of change of current, and the specific value is determined with the cutter spacing and SF6 concentration of the GIL disconnecting switch gear, and the value taken in the simulation is a reference value according to the literature (Zheng, Wu, 2010) “and” indicates with the gate logic that the logic model mainly controls the switch division and closure and is used to put in and out of the single arc burning model.
3.4 Simulation result
Based on the simulation topology in Figure 4 and the dynamic arc model after the optimization of the quenching criterion, the voltage level is 330 kV. The isolation switch is simulated to split and close the no-load line, focusing on the waveform of VFT on the equivalent ground capacitance C2 of the no-load line. The simulation results are shown in Figure 9. The simulation step length is 35 ns, and the simulation duration is 8 ms.
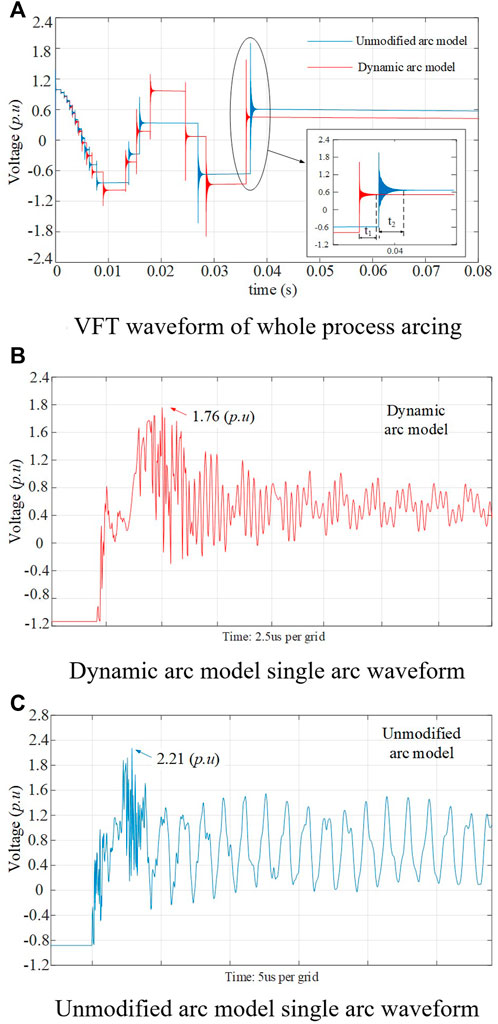
FIGURE 9. Comparison of VFT simulation results under different arc models.(A) VFT waveform of whole process arcing (B) Dynamic arc model single-arc waveform (C) Unmodified arc model single-arc waveform.
As shown in Figure 9A, the whole process of the arc waveform presents a “ladder” shape, with the theoretical analysis of typical VFT development patterns being consistent. At the same time, comparing the two arc models, the simulation results after optimization criterion arc energy attenuation law conforms to the objective laws, and the overall number of the arc model improved more. In addition, the signal attenuation of the improved single arc burning is faster (t2 >> t1). It can be seen from Figure 9B and Figure 9C that the single-arc burning waveform of the improved arc model is a typical pulse signal superposition oscillation attenuation waveform. By comparison, the simulation results of the improved dynamic arc model after the optimization of the arc extinguishing criterion are more consistent with those of the typical waveform of the VFT single-arc burning.
Further analyses of the spectrum of the single-arc waveform of the two arc models are shown in Figure 10.
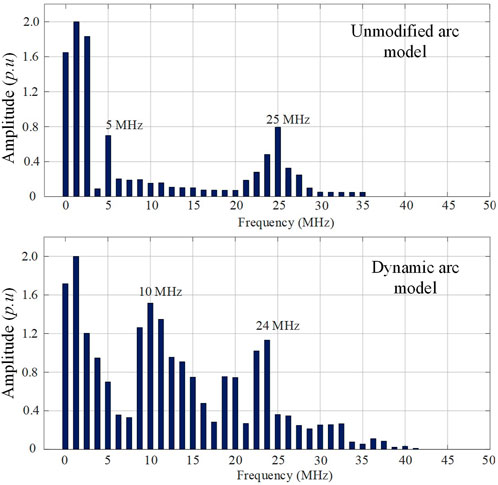
FIGURE 10. Spectrum analysis of single arcing waveform with different arc models.
It can be seen from Figure 10 that the spectrum within 20 MHz in the single-arc signal waveform of the improved arc model is more complex and can better simulate the actual arc burning process, and the UHF part beyond 35 MHz can also be simulated by the improved arc model because the variable arc resistance will change the amplitude of different frequency parts, while the improved dynamic arc model is more practical and makes the frequency composition more complex.
In conclusion, the simulation model after optimizing the judgment logic can well-realize the whole simulation process of VFT, so it is feasible to simulate the development law of the VFT signal by this model.
4 Comparison between simulation and VFT characteristics
4.1 Build test platform
In order to minimize external interference, a GIS disconnector on–off no-load line test platform is chosen. The layout diagram of the platform is shown in Figure 11. The dotted box on the right represents the power side. The test process is as follows: first, the platform is charged without the load, and the circuit breaker is opened after a period of time. Then, the voltage and current signals are measured at the corresponding measurement position when the disconnector on the line side is opened, and the test platform is actually boosted by 330 kV.
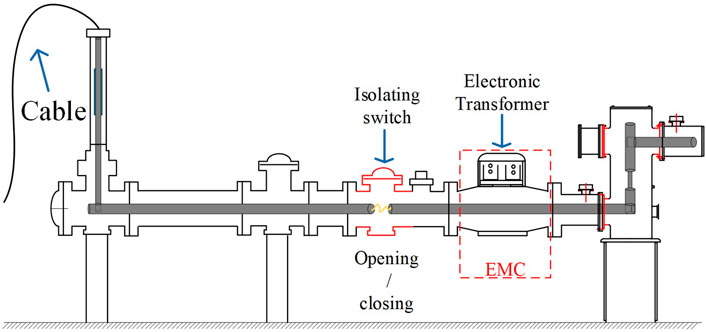
FIGURE 11. Layout of field test platform device.
During the preliminary test, the voltage is boosted to 330 kV. To facilitate the corresponding analysis with the simulation data, the action process lasts for 8 ms, and the test also considered the test item of the effect of the outgoing bushing with a capacitive load on the VFTO signal, and the purpose of the outgoing bushing with a capacitive load is to simulate the capacitive effect of the no-load long line. Each item is opened and closed several times to eliminate the randomness. The measurement items are divided into the following four cases, as shown in Table 1.
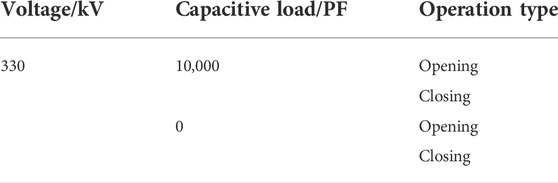
TABLE 1. Test measurement plan.
Each group of tests are opened and closed several times. This is because the opening and closing process of the disconnector has strong randomness, so the strong VFT interference signal is taken for many times. The waveform amplitude and frequency of the measured data of the four groups of tests are close, but the measured results show that the VFT interference signal generated by the opening operation is stronger than that generated by the closing operation. The reason is that there will be residual voltage in the line before the opening operation, and the residual voltage is opposite to the voltage on the power side. The breakdown voltage at both ends of the knife edge of the disconnector greater and produces a stronger pulse part. In addition, the interference signal with no-load is stronger than that with a capacitive load because the main frequency of the VFT signal is resonance caused by capacitive elements. Under the conditions of this test, the equivalent capacitance value of the no-load line meets the resonance conditions, but increasing the capacitive load will destroy the resonance conditions and reduce the overvoltage amplitude. The strongest transient signal is imported into MATLAB as shown in Figure 12.
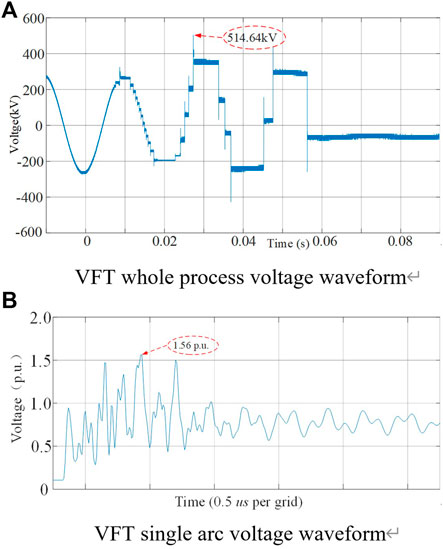
FIGURE 12. Measured VFT waveform generated by disconnector opening and closing no-load line.(A) VFT whole process voltage waveform. (B) VFT single-arc voltage waveform.
It can be clearly seen from Figure 12A that the measured VFT electromagnetic interference signal is consistent with the theoretical analysis and simulation results and presents a “ladder” shape as a whole. Due to the electromagnetic interference of the measured environment, the waveform of the measured data is wide during arcing, which is different from the simulation. The strongest single arcing waveform in the measured data can be seen from Figure 12B, which is also consistent with the previous analysis. It is the pulse wave superimposed oscillation attenuation signal. The VFT maximum overvoltage of the overall measured data is 514.64 kV (1.91 p.u), which is greater than the maximum overvoltage amplitude of 1.76 p.u simulated under the same conditions, and the measured data are random, so the maximum overvoltage may not be the strongest signal. The VFT electromagnetic interference signal generated in the opening and closing process of the disconnector is strong, which will seriously threaten the insulation and electromagnetic compatibility performance of the adjacent equipment.
Furthermore, the characteristics of the VFT electromagnetic interference source signal are analyzed, the single-arc burning waveform of simulation and test results is selected, and the spectrum of waveform and the characteristic quantity of wave head steepness are extracted for comparative analysis and research.
4.2 Spectrum comparison between simulated and measured data
According to the theoretical analysis, the fundamental frequency of the VFT signal determines the development trend of the arc burning waveform in the whole period, while for the single-arc burning waveform, the focus belongs to the composition of high frequency and UHF. The strongest single arcing waveform of simulation data and measured data is analyzed by MATLAB. The results are shown in Figure 13.
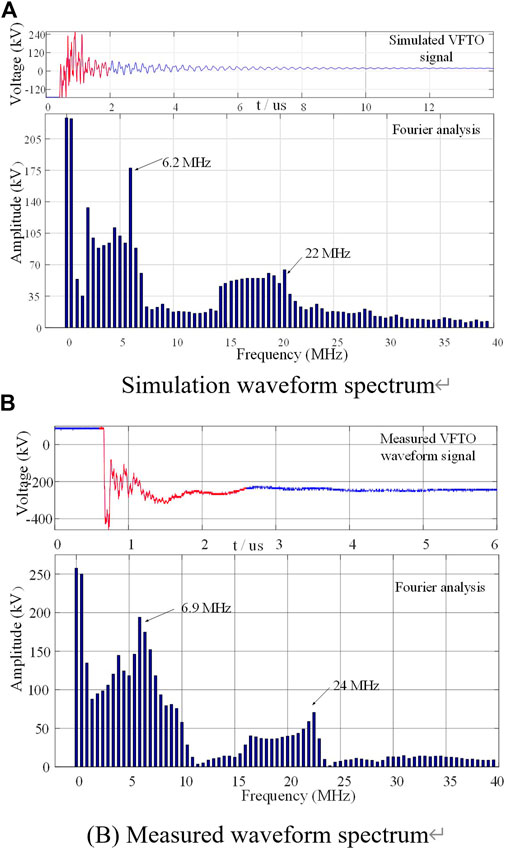
FIGURE 13. Comparison diagram of VFT signal simulation and measured spectrum. (A) Simulation waveform spectrum. (B) Measured waveform spectrum.
The waveform diagram in Figure 13 is the signal source of analysis, the red part is the waveform period selected by Fourier analysis, the analysis selection period is about 2us, the histogram is the Fourier analysis spectrum, and the basic frequency during analysis is 0.5 MHz. The waveforms of the simulated and measured last ignition arc selected for this study were subjected to Fourier analysis. Due to the random nature of the process, the last ignition arc of the simulated results occurred at the forward wave peak, while the last ignition arc of the measured results occurred at the reverse wave peak. However, the analysis of the spectrum of the single-arc-burning waveform and the positive and negative directions of the voltage and current signals are not directly related and do not affect the conclusion of the analysis.
It can be seen from Figure 11 that the frequency spectrum of the single arcing waveform in the VFT electromagnetic interference source signal obtained by the two methods is similar. The high frequency of the simulation signal is concentrated at about 6.2 Mhz, and the corresponding amplitude reaches about 175 kV, while UHF is concentrated at about 22 MHz, and the corresponding amplitude is only about 70 kV. The high frequency of the actual VFT waveform is slightly higher, 6.9 Mhz, UHF is concentrated at 24 MHz, and the corresponding amplitude of the two frequencies is slightly higher than the simulation value. This is because the simplified processing of equivalent ground capacitance of some equipment during simulation and because the measured acquisition is subjected to environmental electromagnetic interference, and the amplitude proportion of lower frequency in the spectrum is significantly greater than that of simulation. On the whole, they have high spectral consistency.
The spectrum of the VFT electromagnetic interference source signal is complex, the maximum frequency can exceed 40 MHz, and the amplitude of some high-frequency signals is strong, which will cause strong electromagnetic interference to the primary equipment.
4.3 Comparison of wave head steepness between the simulated and measured waveform data
The wave head of the VFT signal refers to the pulse of waveform. It can be seen from Figure 2 that the wave head of the single-arc burning waveform is the first voltage “rise” after arc burning, which is expressed by ∆u, and the voltage rise time of the wave head is very short, which is an ns-level surge. Li et al. (2015) point out that the more dangerous in VFT is the ns-level surge steep wave. The research shows that the surge phenomenon of the wave head of the VFT signal is due to the sudden change of voltage of static contact of the disconnector and the dielectric breakdown of knife edge gap. The voltage on the static contact needs to suddenly change into the voltage on the power side of the moving contact, so it will form a surge of the NS wave head.
To analyze the dangerous degree of surge of the pulse wave head, we should not only pay attention to the amplitude of pulse wave but also the time consumed by the pulse wave rising to the peak, which is a very important factor. Chen et al. (2013) point out that the rising pulse wave time of the VFT signal is determined by the size of discharge gap. There are tips at both ends of the GIS disconnector contact, which is prone to tip discharge. Therefore, the knife edge gap of the disconnector is an uneven electric field, and the voltage required for breakdown discharge is small, resulting in a long time for wave head lifting, about 3–20 ns. Through the statistical analysis of many measured test data by Zhu et al. (2016), it is found that the average rise time of the single-breakdown arc waveform pulse where the VFT peak is located is within 12 ns.
The steepness D of the wave head is defined as the ratio of the lifting amplitude ΔU1 of the wave head to the lifting time tR of the wave head, including
As can be seen from Figure 11B, the measured data show that the wave head of single-arc burning is obvious, the rise time is about 13.93 ns, the amplitude ΔU1 = 1.33 p.u, and the wave head steepness D = 0.0955. As can be seen from Figure 8, the rise time of the wave head of single-arc burning is about 12.68 ns, the amplitude ΔU1 = 0.98 p.u, and the steepness of the wave head D = 0.0773. It can be seen that the lifting amplitude of the measured data is large, the wave head duration is long, and the wave head steepness of the maximum single-arc burning is greater than the simulation data.
For further comparison, the last 10 single arcing waveform data of the measured VFT waveform in the opening process are selected and compared with the simulation data under the same conditions. The statistical results are shown in Table 2:
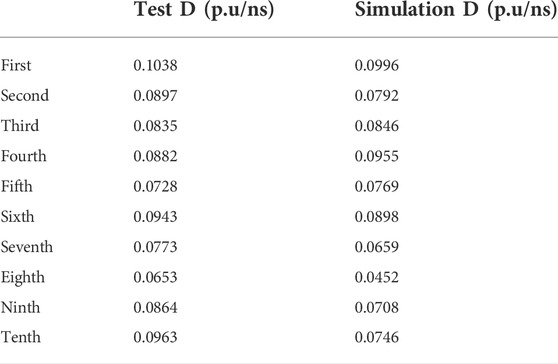
TABLE 2. Statistics of wave head steepness of the last 10 single arcing waveforms of VFT during opening.
It can be seen from Table 2 that the wave head steepness of the overall simulation result is slightly less than the measured data because the premise of simulation is the selection of equivalent parameters, which is different from the actual situation. At the same time, it can be seen that the overall development of the wave head steepness in the last 10 arcing of the measured data has no law to follow and has great randomness, which is also the main reason why the VFT electromagnetic interference signal has not been accurately analyzed at present. However, the wave head steepness in the simulation results of the optimized arc model is also consistent with the measured results. It is verified again that the model has desirable value in the research of the VFT electromagnetic interference signal.
At the same time, from the last 10 single arcing waveforms in the process of opening arcing, the more the VFT signal waveform in the process of opening, the steeper the wave head of the transient signal, and the stronger the harm due to the superposition of residual voltage.
5 Conclusion
New energy systems in power generation and grid-connected transmission and substation systems are basically used in the indoor GIS equipment, despite the stronger insulation design and higher safety and reliability of the GIS equipment, but the current new energy transmission and substation systems used in the GIS equipment due to the compact layout of the equipment lead to the VFT transient signal to electronic equipment, causing great electromagnetic interference, which seriously restricts the development of smart grid footsteps. It is also a major obstacle to the grid connection of new energy systems. In order to study the characteristics and development law of the VFT transient electromagnetic interference signal of the GIS equipment in new energy transmission and transformation system, the study uses theoretical analysis, simulation modeling combined with the experimental measurement method to reproduce the characteristics and development trend of the VFT electromagnetic interference signal by a dynamic arc model with optimized arc extinguishing criterion and analyzes the spectrum and wave head characteristics of the VFT electromagnetic interference signal. The following conclusions are obtained.
1) The problem of VFT transient electromagnetic interference in the indoor GIS equipment used in new energy transmission and transformation systems is the main reason that restricts the development process of smart grid electronic transformer equipment to promote a large area.
2) The single-arc waveform of the VFT electromagnetic interference signal is a pulse voltage superimposed oscillation attenuation wave, and the repeated re-ignition of the arc makes the development of the arc waveform in the whole process showing a “ladder” change trend.
3) The improved dynamic arc model based on increasing the change rate of arc current and optimizing the arc extinguishing criterion can be used to study the VFT electromagnetic interference signal generated during the action of the GIS disconnector. The overall development trend of the simulation waveform and single-arc burning waveform are consistent with the theoretical analysis and measured results.
4) The maximum overvoltage of the VFT electromagnetic interference signal generated under the opening and closing action of the GIS disconnector can reach 1.9 p.u, UHF can reach 30 MHz, and the rise time of the wave head is about 12 ns. The VFT signal with large frequency amplitude, high frequency, and steep wave head will cause great insulation threat and electromagnetic interference to the equipment near the knife edge of the disconnector.
5) With the development of the power grid, the suppression of the VFT signal can be a good solution to the new energy grid process to the new power system in the electronic type of intelligent equipment electromagnetic interference problem, composed of a new power system and the development of smart grid, as shown in Figure 14, for the new power system structure diagram.
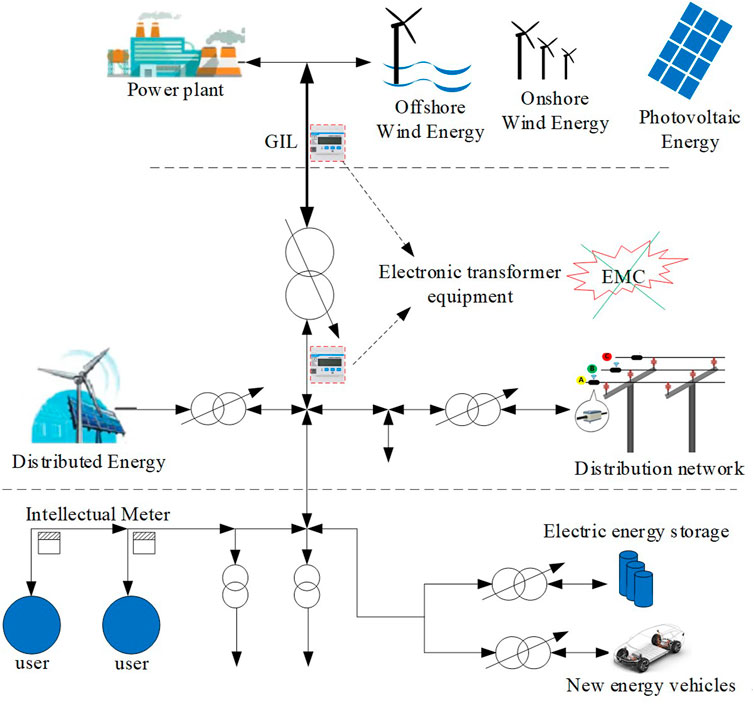
FIGURE 14. New power system structure diagram.
Data availability statement
The original contributions presented in the study are included in the article/Supplementary Material. Further inquiries can be directed to the corresponding author.
Author contributions
The individual contributions of the authors are as follows: data curation, GY; formal analysis, YC; methodology, FZ; supervision, SZ; writing (original draft), YZ. All authors have read and agreed to the published version of the manuscript.
Conflict of interest
Authors GY, FZ, SZ, and YC were employed by Power China Hubei Electric Engineering Co. Ltd. Author YZ was employed by State Grid Hefei Power Supply Company. All authors declare that the research was conducted in the absence of any commercial or financial relationships that could be construed as a potential conflict of interest.
Publisher’s note
All claims expressed in this article are solely those of the authors and do not necessarily represent those of their affiliated organizations, or those of the publisher, the editors, and the reviewers. Any product that may be evaluated in this article, or claim that may be made by its manufacturer, is not guaranteed or endorsed by the publisher.
References
Chen, J., Guo, J., Wang, L., Dai, M., Jiao, L. X., and Cui, L. Y. (2013). Analysis of steep wave characteristics of metal oxide arrester model. Porcelain arrester.. 2013 (04), 68–74. (In Chinese). doi:10.16188/j.isa.1003-8337.2013.04.016
Chen, W. J., Zhao, J., Bian, K., Wang, D. L., Wan, B. Q., Zhou, Z. X., et al. (2019). Research progress on transient electromagnetic disturbance of GIS substation switch operation. Chin. J. Electr. Eng. 39 (16), 4935–4948. (In Chinese). doi:10.13334/j.0258-8013.pcsee.181400
Duan, S. F. (2016). Modeling and simulation of GIS disconnector transient arc DISS. Beijing: North China Electric Power University Beijing. [master’s thesis].
Duan, S. F., Zhao, L., Li, Z. B., Zhan, H. M., Li, C. R., and Yao, L. Z. (2015). Research on statistical characteristics test and simulation method of VFT and VFTC in GIS. Power grid Technol. 39 (12), 3634–3640. (In Chinese). doi:10.13335/j.1000-3673.pst.2015.12.045
Kang, B. (2016). Research on ultra-fast transient overvoltage in GIS and its influence on electronic transformer. [Wuhan]: Wuhan University. [master’s thesis].
Li, X., Jin, X., Bi, H. T., Li, B., and Lu, X. C. (2015). Numerical calculation of fast transient overvoltage in UHV gas insulated substation under variable gap arc model. High. Volt. Technol. 41 (04), 1306–1312. (In Chinese). doi:10.13336/j.1003-6520.hve.2015.04.031
Lin, X., Wang, N., and Xu, J. Y. (2012). Calculation and analysis of ultra-fast transient overvoltage characteristics under dynamic arc model. Chin. J. Electr. Eng. 32 (16), 157–164. (In Chinese). doi:10.13334/j.0258-8013.pcsee.2012.16.022
Liu, B., Ye, G. X., Guo, K. Q., Tong, Y., and Wan, G. (2012). Performance detection and problem analysis of electronic transformer. High. Volt. Technol. 38 (11), 2972–2980. (In Chinese). doi:10.3969/j.issn.1003-6520.2012.11.027
Liu, J. M., Du, W., Wang, Z. Z., Sun, W., and Li, Y. G. (2013). Research progress of GIS disconnector arc model in VFT simulation. High. Volt. Appar. 49 (05), 21–25. (In Chinese). doi:10.13296/j.1001-1609.hva.2013.05.006
Meng, Z. Z., Qi, X. H., Lv, L., and Li, Y. M. (2010). Study on reburning overvoltage in capacitive small current test of disconnector. High. Volt. Appar. 46 (11), 74–76. (In Chinese). doi:10.13296/j.1001-1609.hva.2010.11.011
Shen, Y., Zhu, Y., Liang, Y. F., Chen, F., and Zhang, D. H. (2020). Comparative study on full-time simulation and measurement of VFT. Electr. Meas. Instrum. 57 (14), 83–87. (In Chinese). doi:10.19753/j.issn1001-1390.2020.14.014.10
Teng, H. (2013). Calculation and analysis of VFT in GIS under accurate arc model. Nanning, Guangxi: Guangxi University. [master’s thesis].
Tian, Y., Wu, X. X., and Zhang, H. (2013). Research on arc burning model of disconnector in VFT calculation. High. Volt. Appar. 49 (05), 106–113. (In Chinese). doi:10.13296/j.1001-1609.hva.2013.05.020
Wang, J. S., Li, Y. M., Qi, Q. C., Zhong, L. K., Wang, J. Q., and Wang, K. (2000). National high voltage test technology and insulation coordination standardization technical committee.Extremely fast impulse high voltage test technology Part 1: Measurement system for steep wavefront overvoltage in gas insulated substation
Zeng, Z. H., Lin, J. M., Ban, L. G., Jiang, W. P., and Chen, L. P. (1996). Ultra-fast transient overvoltage and its research examples. Power grid Technol. 20 (3), 10–14. (In Chinese).
Zhao, J., Chen, W., and Zhang, J. (2015). Analysis of electromagnetic compatibility immunity requirements for switching transients in secondary equipment of intelligent substations[J]. High. Volt. Technol. 41 (5), 9. (In Chinese). doi:10.13336/j.1003-6520.hve.2015.05.037
Keywords: new energy transmission and substation, GIL, VFT signal, transient electromagnetic interference, simulation and test
Citation: Yang G, Zhu Y, Zen F, Zhou S and Chen Y (2022) Electromagnetic transient characteristics and overvoltage suppression strategy of renewable energy-oriented power system connected by gas-insulated transmission lines. Front. Energy Res. 10:991355. doi: 10.3389/fenrg.2022.991355
Received: 11 July 2022; Accepted: 15 August 2022;
Published: 08 September 2022.
Edited by:
Jian Zhao, Shanghai University of Electric Power, ChinaCopyright © 2022 Yang, Zhu, Zen, Zhou and Chen. This is an open-access article distributed under the terms of the Creative Commons Attribution License (CC BY). The use, distribution or reproduction in other forums is permitted, provided the original author(s) and the copyright owner(s) are credited and that the original publication in this journal is cited, in accordance with accepted academic practice. No use, distribution or reproduction is permitted which does not comply with these terms.
*Correspondence: Yong Zhu, emh1eW9uZzAyMTJAMTYzLmNvbQ==